Modeling of Pore Pressure using Artificial Neural Networks
Received: 26-Mar-2020 / Accepted Date: 11-Apr-2020 / Published Date: 20-Apr-2020 DOI: 10.4172/2472-0518.1000168
Abstract
Most formation pressure prediction techniques employed in the industry today are based on formulations that are exclusively compatible with petro-physical input data obtained either from well logs or seismic surveys. This trend has consequently restricted the prognosis of pore pressure to these models that are sometimes unsuitable for certain environments. This paper presents an approach for modeling the pore pressure of the formation using Artificial Neural Network. The Artificial Neural Network was employed in forecasting the pore pressure from a wire line formation test data in the form of Modular Dynamic Tester dataset consisting of the measured pore pressure, true vertical depths, mobility, and temperature and pretest volume. . The dataset was portioned into two groups, the learning dataset as well as the prediction dataset. The former was used in training the Artificial Neuron Network model while the latter was employed in the validation of the model’s accuracy. The True vertical depths, mobility, and temperature and pretest volume were employed as inputs into the artificial neural network .The Artificial Neural network produced high-prediction accuracy as seen from the correlation coefficient of 0.9927 and Root Mean Square Error of 0.6628. Considering the results obtained, the Artificial Neural network will be effective in forecasting pore pressures and would provide an alternative means of doing that.
Keywords: Model; Neural network; Pore pressures
Introduction
Knowledge of the pore pressure of a potential drilling formation is crucial to an efficient drilling plan. Pore pressure is essential to the selection of locations to place casing strings as well as the selection of relevant grade of casings to apply to enable effective well drilling. The knowledge of pore pressure would enable the driller to strike a balance between a drilling mud that would prevent kicks and at the same time avoid breaking the formation, which could lead to costly Nonproductive time.
Machine learning algorithms are now vital and frequently applied tools for predicting key variables for complex oil and gas systems with multiple influencing variables displaying highly irregular and/or nonlinear relationships. Their application and diversity are growing [1]. Machine learning techniques have caught the eyes of engineers thanks to their ability to correlate input data to the output data. One of such is the Response Surface Model which is utilized in numerous facets of reservoir engineering such as history matching [2], determining the initial uncertainty of hydrocarbons [3], locating spots for well placement [4], and estimating initial hydrocarbon uncertainty. Production variation has been forecasted with the aid of pattern recognition based on the well locations [5].
Artificial Neural Networks are computational techniques that mimic the human brain in unraveling solutions to problems. It consists of a series of interconnected nodes, which are more or less the artificial versions of the neurons in the brain. Each node symbolizes the artificial neuron, while the arrows symbolize the link from an output node to an input node. The ANN executes tasks by learning from given examples, with. Individual neurons can receive, process and send signals to one another. Artificial Neural Networks possess a number of layers, with each layer executing different tasks based on the input data. The signals move from the initial layer to the final layer after travelling across the layers numerous times. The use of Artificial Neural Networks commenced way back in the 90's, particularly for the interpretation of data obtained from well tests [6]. The viscosity of petroleum and the Gas - oil ratios has been estimated with the aid of the artificial neural networks [7]. Similarly, the Artificial Neural Network has been employed in forecasting formation volume factors and bubble point pressures [8]. The heterogeneity of reservoirs such as the fluid saturations, permeability and porosities have been characterized using well log data with the help of Artificial Neural networks [9]. The flow rates of crude oil in pipes in varied temperatures and pressures have been estimated using ANN [10].
Lately, Artificial Neural Networks have been applied in a number of facets of the oil and gas industry such as; the modeling of fracture distribution in reservoirs, modeling of injection rates, forecast of petroleum production from shale, production optimization, and evaluation of PVT properties. In this work the use of Artificial Neural Network in the predicting pore pressure using Modular dynamic Tester data is demonstrated.
Methodology
The data employed in the work were basically wire line formation test data in the form of Modular Dynamic Tester data consisting of the measured pore pressures and their corresponding true vertical depths, pretest volume, mobility, and temperatures. These parameters are inputted into the Artificial Neuron Network model and the hidden layers apply a number of neurons to obtain the correlation between the input variables and the pore pressure which is the output (Figure 1).

Figure 1: Workflow employed in modeling pore pressure
The Pore pressure of the entire depth of interest was modeled using Artificial Intelligence software. Seventy percent (70%) of the pore pressure data set were chosen from the modular dynamic tester data in order to train the ANN while the remaining thirty percent (30%) data points were used to test and validate the accuracy of the Artificial Neuron Network model.
A statistical error analysis was conducted by computing the correlation coefficient and Root Mean Square Deviation of the actual data (Modular Dynamic Test data) and the predicted pressures so as to verify and ascertain the forecasting accuracy of the Artificial Neural network model.
The workflow adopted in the work is as follows;
• Importing the Modular Dynamic Tester data set into the software
• Partitioning the data set into two groups; the training or learning data set and the testing data set.
• Training the ANN model using the learning data set
• Applying the model with the aid of the testing set to predict the pore pressures.
• Evaluating the performance of the Artificial Neural Network model by computing the correlation coefficient and Root Mean Square Deviation of the results.
The data set is initially inputted into the file reader node of the software where it is inspected for anomalies after which it moves to the partitioning node where it is split into two groups, the training and the evaluation set. The training set is utilized in training the model while the evaluation set is employed in testing the accuracy of the model. The two sets of data are then sent to the learner and predictor nodes respectively , where the output from the predictor node is conveyed to the scorer node where statistical error analysis are conducted (Table 1).
| TVD (ft) | Pore Pressure (psi) | Mobility | Temperature (oF) | Pretest Volume (cc) |
|---|---|---|---|---|
| 14162.2 | 13349.2 | 866.4 | 303.94 | 17.4 |
| 14122.2 | 13344.51 | 545.5 | 306.04 | 17.2 |
| 14172.7 | 13353 | 4.1 | 307.08 | 15.1 |
| 14176.7 | 13353.84 | 914.4 | 308.25 | 15 |
| 14181.7 | 13354.71 | 4239.2 | 309.27 | 15.2 |
| 14190.2 | 13356.21 | 136 | 310.24 | 15 |
| 14195.2 | 13357.77 | 3.6 | 310.8 | 15 |
| 14205.2 | 13358.83 | 32.7 | 311.82 | 15 |
| 14257.1 | 13366.94 | 1.5 | 312.1 | 15 |
| 14276.1 | 13371.01 | 0.2 | 313.77 | 6.2 |
| 14291.1 | 13371.1 | 16.5 | 314.48 | 15.1 |
| 14298.1 | 13371.95 | 15.2 | 315.29 | 14.8 |
| 14308.1 | 13373.2 | 0.01 | 316.04 | 4.9 |
| 14320.1 | 13375.76 | 14.8 | 316.68 | 15 |
| 14341 | 13378.97 | 1.1 | 317.61 | 11.1 |
| 14278 | 13370.2 | 0.2 | 318.1 | 5.7 |
Table 1: Data set employed in learning and testing Artificial Neural Network model.
Coefficient of Correlation
This is a statistical measure which indicates the relationship between an independent parameter and the dependent parameters. It ranges in value between -1 to 1. The closer the value is to 1 the stronger the correlation.
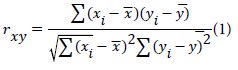
Where
rxy= Correlation coefficient of the linear relation between variables x and y.
xi= values of the parameter x in the data set.
Mean value of the x parameter
Mean value of the y parameter
Root Mean Square Error
It is a measure of the variation between the predicted values of a model and the observed values. It is a measure of the accuracy of the predictive model. It is computed using the expression;
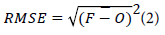
Where
F= forecasted or expected values
O= Observed or known values.
The bar at the top of the differences of the squares is the mean.
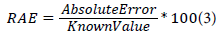
Relative Absolute error
This is the absolute error divided by the magnitude of the actual value. It expresses how large the absolute error is in comparison to the actual magnitude of the variable of interest. It is computed using the formulae;
Results and Discussion
The tables below present the results obtained from the modeling of Pore pressure using the Artificial Neural network. As can be seen in (Table 2), the Artificial Neural Network model showed a high degree of correlation with the actual pore pressures as evidenced by the low errors recorded at individual pressure points. More so, results of the statistical error analysis, (Table 3), further underscores the accuracy of the model with the model yielding a coefficient of correlation of 0.9927, a Root Mean Square Error of 1.6628 and a Relative Absolute Error of 10.95%. Figure 2 and 3 is a scatter plot of the predicted pore pressure against the actual pore pressure generated from the validation data set. The predicted pore pressure is on the Y-axis while the actual pore pressure is on the X-axis. The data points are represented by crosses whose size indicates the value of the error for that data point. The smaller the cross size, the smaller the error and in turn the more accurate the prediction at that instance. It can be seen from the plot that the data crosses are relatively small in size and they form an imaginary straight line which is indicative of a strong correlation between the predicted and actual pore pressure. These results imply a strong degree of correlation and by extension the high accuracy of Artificial Neural Network model in predicting pore pressure.
| Actual Pore pressure (psi) | Predicted pore pressure (psi) | Error |
|---|---|---|
| 13353 | 13352.643 | -0.357 |
| 13371.01 | 13368.547 | -2.463 |
| 13344.51 | 13347.152 | -2.642 |
| 13375.76 | 13375.9 | -0.14 |
| 13371.95 | 13372.744 | -0.794 |
Table 2: Predictions on Test split data.
| Statistical measure | |
|---|---|
| Correlation coefficient | 0.9927 |
| Root Mean Square Error | 1.6628 |
| Relative Absolute Error | 10.95% |
Table 3: Evaluation of model’s performance using test split data.

Figure 2: Artificial Neural Network model with input parameters and pore pressure

Figure 3: Scatter plot results of Artificial Neural Network model run of predicted Pore Pressure versus actual Pore Pressure data.
Conclusion
Machine Learning models aimed at forecasting pore pressures in formations can be effectively trained and applied to Modular Dynamic Tester data. In this paper, the pore pressure of a formation was modeled using pressure data obtained from Modular Dynamic Tester using Artificial Neural Network model. Four key variables were employed as inputs into the model namely; True vertical depths, pretest volume, mobility, and temperatures. The model was trained with seventy percent of the dataset after which the remaining thirty percent was utilized in the validation of the model’s accuracy. Results obtained showed that the model has a high level of correlation with the MDT pressures considering the high Correlation coefficient obtained of 0.9927 and the low RMSE of 1.6628. More so, the scatter plot of the actual and predicted pore pressures buttressed the good accuracy of the model by yielding a linear correlation between them. By and large, it can be surmised that Artificial Neural Networks can be successfully employed in the prognosis of formation pressures as evidenced by the results obtained.
References
- Schmidhuber J (2015) Deep Learning in Neural networks: An Overview. Neural Net 61: 85-117.
- Ahmadi MA, Soleimani R, Bahadori A (2014) A Computational Intelligence Scheme for prediction of equilibrium water dew point of natural gas in TEG dehydration systems. Fuel 137: 145-154.
- Mohaghegh S (2006) Quantifying uncertainties associated with reservoir simulation. SPE Annual Technical. Texas.
- Manceau E, Mezghani M, Zabalza-Mezghani I, Roggero F (2001) Combination of experimental design and joint modeling methods for quantifying the risk associated with deterministic and stochastic uncertainties. SPE Annual Technical Conference and Exhibition, Louisiana.
- Mohaghegh SD, Liu JS, Gaskari R, Maysami M, Olukoko OA (2012) Application of well based surrogate reservoir models (SRMs) to two offshore fields in Saudi Arabia. SPE Western Regional Meeting, Society of Petroleum Engineers. California.
- Juniardi IR, Ershaghi I (1993) Complexities of Using Neural Network in Well Test Analysis of Faulted Reservoirs. Society of Petroleum Engineers.
- Oloso M, Khoukhi A, Abdulraheem A, Elshafei M (2009) Prediction of crude oil viscosity and gas/oil ratio curves using recent advances to neural networks,. SPE/EAGE Reservoir Characterization and Simulation Conference.
- El-Sebakhy E, Tarek S, Said Y, Yasser S, Putu DR et al. (2007) Support vector machines framework for predicting the PVT properties of crude oil systems. 15th SPE Middle East Oil & Gas show and conference, Bahrain.
- Mohaghegh S, Arefi R, Ameri S, Hefner MH (1994) A methodological approach for reservoir heterogeneity characterization using artificial neural networks. SPE Annual Technical Conference and Exhibition. Louisiana.
- Ahmadi ME, Ebadi M, Shokrollahi A, Majidi SM (2013) Evolving artificial neural network and imperialist competitive algorithm for prediction oil flow rate of the reservoir. Applied Soft Computing 13: 1085-1098.
Citation: Tanko A, Bello A (2020) Modeling of Pore Pressure using Artificial Neural Networks. Oil Gas Res 6: 168. DOI: 10.4172/2472-0518.1000168
Copyright: © 2020 Tanko A, et al. This is an open-access article distributed under the terms of the Creative Commons Attribution License, which permits unrestricted use, distribution, and reproduction in any medium, provided the original author and source are credited.
Select your language of interest to view the total content in your interested language
Share This Article
Recommended Journals
Open Access Journals
Article Tools
Article Usage
- Total views: 2662
- [From(publication date): 0-2020 - Sep 23, 2025]
- Breakdown by view type
- HTML page views: 1843
- PDF downloads: 819