Review Article Open Access
Monitoring Rheological Properties in Biological Systems by Fluorescence Spectroscopy using Borondipyrromethene (Bodipy) Dyes: A Mini Review
Andrew C Benniston*Molecular Photonics Laboratory, School of Chemistry, Newcastle University, Newcastle upon Tyne, NE1 7RU, UK
- *Corresponding Author:
- Andrew C Benniston
Molecular Photonics Laboratory,School of Chemistry
Newcastle University, Newcastle upon Tyne, NE1 7RU,UK
Tel: +44 (0)191 222 5706
E-mail: a.c.benniston@ncl.ac.uk
Received date: October 27, 2014; Accepted date: November 13, 2014; Published date: November 17, 2014
Citation: Benniston AC (2014) Monitoring Rheological Properties in Biological Systems by Fluorescence Spectroscopy using Borondipyrromethene (Bodipy) Dyes: A Mini Review. J Anal Bioanal Tech 5:221 doi: 10.4172/2155-9872.1000221
Copyright: © 2014 Benniston AC. This is an open-access article distributed under the terms of the Creative Commons Attribution License, which permits unrestricted use, distribution, and reproduction in any medium, provided the original author and source are credited.
Visit for more related articles at Journal of Analytical & Bioanalytical Techniques
Abstract
This short review covers recent progress in the field of fluorescent rheology probes focussing on the Borondipyrromethene (Bodipy) dye. Attention is paid to the how the level of fluorescence output from molecular Bodipy systems responds to the local viscosity, and what information can be revealed from the measurements. In particular, the use of Bodipy dyes for looking at local viscosity in membranes, cells and other biological media is discussed.
Keywords
Bodipy; Rheology; Fluorescence; Cells; Membranes; Imaging; Singlet lifetimes
Introduction
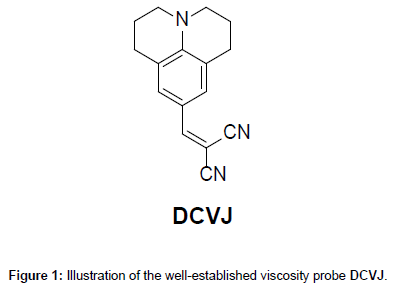
When thinking about viscosity the immediate image are largescale stirrers and treacle–like mixtures with paddle wheels blending against the mass flow. Certainly within the macroscopic world this scenario is consistent with the measurement of the rheology from a large-scale fluidic material. With a change in scale down to, for example, the microscopic domain a new class of sensors emerge based on, for instance, optical tweezers [1]. However, at the nanoscale the measurement of rheological properties become more of a challenge and sensors are needed with dimensions which match with their local surroundings [2]. In addition, a reporting method is required which affords real-time information that is both accurate and quantitative in some manner. The realm of nanoscale fluorescence-based viscosity probes is one that lends itself to solving the problem, by using the fact that emission from a molecule can be highly sensitive to a dye’s local environment [3]. Certainly there are several examples from past literature where fluorescence response was shown to be a good indicator of the local viscosity around a dye [4]. The case of dicyanovinyljulolidine (DCJ) (Figure 1) is a one such example, although the compound does have several drawbacks and is limited in its optical response window [5]. However, in this review the focus will be the viscosity probes based on the highly popular and well understood borondipyrromethene (Bodipy) dye [6]. Bodipy dyes have grown in popularity over the past ten years or so, to such a level that they dominate popular literature for many kinds of applications [7].
Bodipy Dyes
The basic Bodipy unit is illustrated in Scheme 1 and can be considered a half-porphyrin chelated with a BF2 group to help maintain structural rigidity. The basic unit can be decorated with many different groups (R through R3), although some of the most common Bodipy dyes are represented by R = aryl, R1= R3 = Me and R2 = Et [8]. Synthetically Bodipy dyes are generally straightforward to prepare and several review articles have highlighted the many different approaches [9]. The simplest procedure relies on the condensation of an aryl aldehyde with a suitable pyrrole derivative to produce the corresponding dipyrromethane, which can be isolated but is generally oxidised in situ and then chelated to the BF2 subunit (Scheme 1).
Yields of Bodipy dyes can be very reasonable and their purification via column chromatography uncomplicated. Another positive feature is the achievable in-depth characterisation by NMR spectroscopy covering several nuclei (e.g., 1H, 13C, 19F and 11B). In symmetrical Bodipy derivatives the 11B spectrum consists of a simple triplet from coupling to the two equivalent fluorine atoms (J ~ 30-40 Hz). A quartet is mainly observed for the 19F NMR spectrum because of coupling to the quadrupolar 11B (I = 3/2) nucleus; small satellite peaks can be visible from coupling to the 10B (I = 3) nucleus too [10]. A further positive feature of fully alkylated Bodipy derivatives is their reversible electrochemistry [11].
Photophysics of Bodipy Dyes
The extended π-conjugation pathway for basic Bodipy dyes gives rise to their intense red colour, and the appearance of narrow absorption bands with λABS values around 500 nm. In cases where the Bodipy core is highly conjugated, λABS can be pushed into the near infrared region [12]. The highly intense colour often observed for dilute solutions is a result of the high εmax values that tend to be in the range 12,000-110,00 M-1 cm-1. The absorption spectra for basic Bodipy compounds are only slightly affected by solvent. Emission from a Bodipy dye is relatively intense, and the low energy fluorescence profile is generally a good match to the absorption spectrum (Figure 2). The modest Stokes’ shift (SS) is taken to indicate that the structures of the excited state and ground state are similar. Singlet excited state lifetimes, τFLU, tend to be in the sub ns region, and it is generally noticed that radiative rate constants (kRAD = φF/τFLU ) do not vary greatly. Indeed, there is generally a good match between observed kRAD values and those calculated by the Strickler-Berg equation [13]. The energy of the triplet state for Bodipy derivatives is low (ca. 12,800 cm-1), and in fact phosphorescence is very rarely seen [14]. There are only a few reports concerning the low-temperature phosphorescence from Bodipy compounds [15]. The slow rate of intersystem crossing (ca. 106 s-1) is the main reason why triplet-based reactions are less important in such compounds. Thus,compound degradation via self-produced singlet oxygen is less of a problem than seen for comparable dyes in the literature.
Molecular Rotors
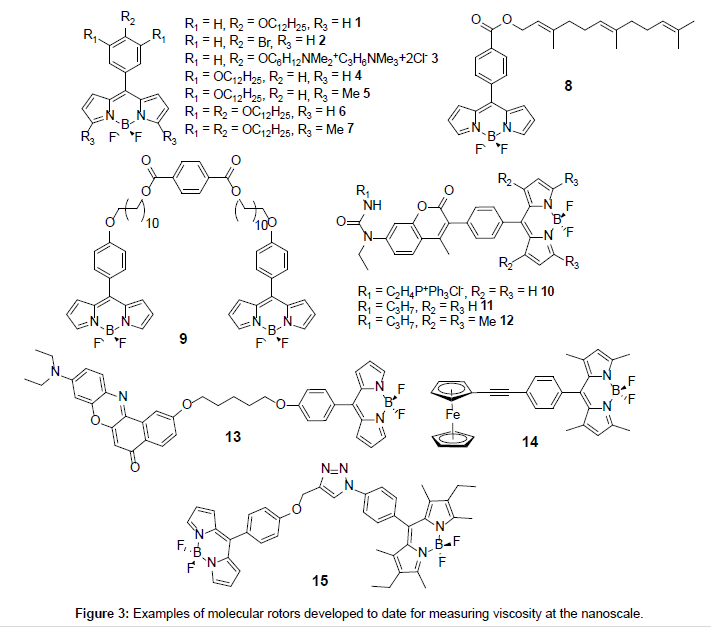
A close scrutiny of fluorescence quantum yields for Bodipy derivatives is very revealing in that they are highly sensitive to the presence or absence of alkyl groups on the dipyrromethene core [16]. It was noticed back in 2005 by Holten and co-workers that quantum yields for unsubstituted Bodipys (i.e., R1 = R2 = R3 = H) with a meso phenyl group were much lower than their fully alkylated counterparts [17]. This early report pointed to the important role played by the meso phenyl group in controlling fluorescence output, and how its “free” rotation because of the lack of substituents adjacent to the ring was extremely important. The mechanism of the fluorescence signal control is encompassed in the so called “rotor effect” [18] whereby rotation of the phenyl distorts the dipyrromethene backbone and enhances nonradiative deactivation of the excited state. Clearly any process which hinders the phenyl rotation will affect the fluorescence quantum yield. In this sense it is easy to see that the presence of alkyl groups (e.g., R1 = Me) will encumber the phenyl rotation- alkyl substituted Bodipys have relatively high fluorescence quantum yields [19]. A very simple way to restrict the rotation of the phenyl group is to change the viscosity of the solvent, since the spinning group must push past solvent molecules. Any application for such an effect in viscosity measurements was not realised until later by two pieces of independently published work by Kuimova et al. [20] and Benniston et al. [21] in 2008 using molecules 1 and 9, respectively (Figure 3). The study on compound 9 focused solely on the photophysics of the dye in different viscosity solvents, whereas the study of 1 targeted lifetime imaging of live cells. Since these two publications the area of viscosity probes based on Bodipy units has increased and new examples have emerged (Figure 3) and will be discussed later in more detail.
Basic theory and studies
The basis for how fluorescence output from a molecular rotor is related to bulk viscosity (η) is crudely covered by the Förster-Hoffmann expression (Eq. 1) [22]:
 (Eq. 1)
where φF is the fluorescence quantum yield, C is a constant and β is a coefficient that indicates the sensitivity of the probe to changes in viscosity. The equation can also be re-written in the form of lifetime (τFLU) for the probe (Eq. 2):
 (Eq. 2)
It is evident from the two equations that two parameters, which can be readily measured for any probe, link directly to solvent viscosity. It is worth stressing that although equations 1 and 2 are commonly employed a better representation of how a molecular rotor responds to viscosity is given by equations 3 and 4.
 (Eq. 3)
 (Eq. 4)
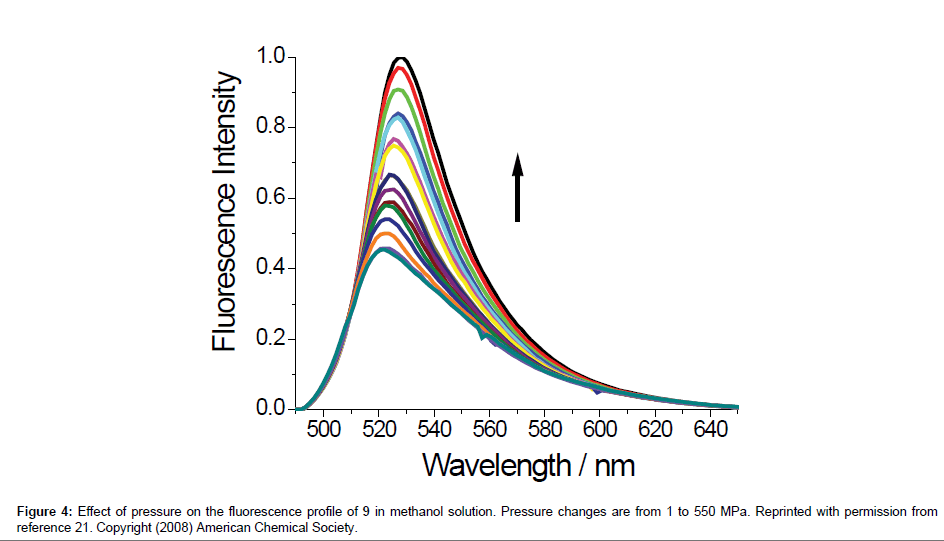
here kNR is the non-radiative rate constant, υ is the limiting pressure exerted by the rotor, α is a coefficient that describes frictional forces between rotor and the surrounding solvent and EA is the activation energy for internal rotation. The detailed studies conducted on rotor 9 evaluated C and β from Eq. 1 to be -1.30 and 0.44, respectively. Worth noting is that these results showed that bulk viscosity was an inappropriate measure of solute-solvent interactions and microviscosity was a better alternative. In addition, β is around 50% more pronounced than for DCVJ (Figure 1) showing that 9 is a more superior viscosity probe. A temperature dependent analysis of fluorescence output for 9 in ethanol in terms of Eq. 3 was also performed. At low temperature, where the viscosity is high, nonradiative decay was shown to be strongly activated; at ambient temperature this was not the case. At the high temperature limit the barrier for gyration of the phenyl ring in the excited state is only 2.5 kJ mol-1. More revealing studies involved the monitoring of fluorescence in methanol under high pressures. As illustrated in Figure 4 the fluorescence intensity increased as the pressure was increased on the sample up to around 550 MPa. The growth in intensity is associated with the increase in the viscosity of the solvent. One point to note is the isothermal conditions which this experiment was performed. Therefore, any complications (e.g., polarity changes), which are often introduced when temperature is used to alter viscosity, were minimised.
Further pressure dependent fluorescence studies were carried out by Harriman et al. [23] using the molecular rotor 2 (Figure 3), where the long-chain alkyl group is replaced by a spherical bromine atom. In the first experiment fluorescence yields for 2 in CHCl3 were measured after the addition of PMMA (polymethylmethacrylate) to the solution. A minor increase in φF (~ 19%) was observed by a change in the PMMA content up to ca. 25% w/v, despite the fact that the viscosity of the solution was enhanced considerably. It was concluded that the rotor 2 does not appear to interact with the polymer in CHCl3. However, under pressure in the presence of PMMA the rate of increase in φF was far more pronounced. Combined with control experiments the group hypothesised that the polymer wraps around the dye and thus curtails the rotor action.
Fluorescence anisotropy experiments by Suhling and co-workers [24] using rotor 1 have also been carried out. The aim was to see if such a probe, and other rotors in general, could be used to monitor viscosity on the microscopic scale using fluorescence depolarisation. Fluorescence anisotropy measurements are used to measure the rotational mobility of a molecule and are tied into the Perrin equation (Eq. 5):
 (Eq. 5)
where r is the measured anisotropy, r0 is the initial anisotropy and τc the rotational correlation time of the molecules. The group combined equations 5 and 2 to produce an expression (Eq. 6) which is the Perrin equation formulated for fluorescent molecular rotors:
 (Eq. 6)
A = CkBT/υ kRAD
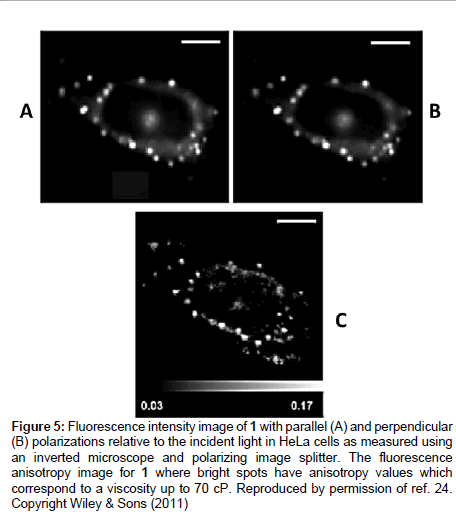
where kB is Boltzmann’s constant, υ is the hydrodynamic volume of the molecule and T the temperature. Steady state anisotropy data collected for 1 showed an adequate fit to Eq. 6 over a wide viscosity range and its response was far superior to DCVJ. The anisotropy method was also applied to imaging HeLa cells by staining them with the rotor 1 (Figure 5). Because the dye is lipophilic it accumulates in membranes of intracellular organelles. The bright regions of Figures 5A & 5B correspond to viscosity values of around 160 cP. From inspection of the anisotropy image (Figure 5C) the vesicle-like regions of the cell are targeted (bright spots), which are located at the periphery of the nucleus and the viscosity here is greater than 30 cP.
Figure 5: Fluorescence intensity image of 1 with parallel (A) and perpendicular (B) polarizations relative to the incident light in HeLa cells as measured using an inverted microscope and polarizing image splitter. The fluorescence anisotropy image for 1 where bright spots have anisotropy values which correspond to a viscosity up to 70 cP. Reproduced by permission of ref. 24. Copyright Wiley & Sons (2011)
Rheology Monitoring
In this section examples where Bodipy probes have been employed are discussed, focussing mainly on their biological applications. At the end the application to sol-gel formation is also mentioned.
Cells
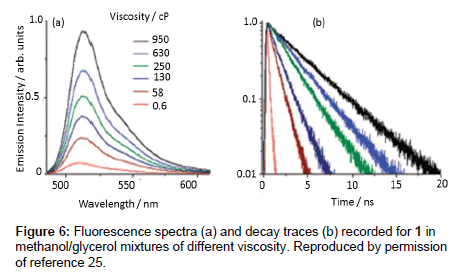
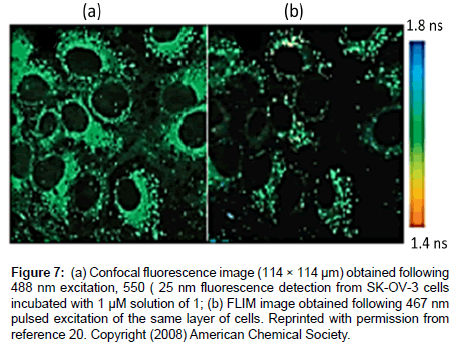
The first experiments to attempt to monitor viscosity in cells using a Bodipy rotor were reported by Kuimova et al. [20] using compound 1. Fluorescence measurements were firstly taken in methanol/glycerol mixtures of different viscosities. As illustrated in Figure 6 as the viscosity of the mixture increased both the fluorescence intensity and lifetime increased. A fit of the lifetime data to Eq. 2 afforded β = 0.50 ± 0.03. Compound 1 was also incubated in SK-OV-3 cells and the technique of FLIM (Fluorescence Lifetime Imaging Microscopy) was used to measure local viscosity (Figure 7). The dye appeared to locate in the endocytotic vesicles of the cells. By using a calibration curve and the FLIM lifetime date is was concluded that the average viscosity was 140 ± 40 cP in the cells.
Figure 7: (a) Confocal fluorescence image (114 × 114 μm) obtained following 488 nm excitation, 550 ( 25 nm fluorescence detection from SK-OV-3 cells incubated with 1 μM solution of 1; (b) FLIM image obtained following 467 nm pulsed excitation of the same layer of cells. Reprinted with permission from reference 20. Copyright (2008) American Chemical Society.
More recently the group have taken this work further by modification of the hydrocarbon tail to incorporate the farnesyl chain (compound 8, Figure 1) [25]. The idea here was to have a hydrophobic tail that rendered the dye highly soluble in the membrane of the cells. The FLIM images for 8 taken up in SK-OV-3 cells were consistent with the dye locating in the membrane and the cytosol. A histogram of fluorescence lifetimes was consistent with a bimodal distribution corresponding to 1.0 and 1.3 ns. The bimodal distribution for 1 was shown to be slightly different (1.7 and 2.0 ns). The shorter fluorescence lifetime corresponds to a viscosity of 160 cP, whereas the longer lifetime viscosity is about 260 cP.
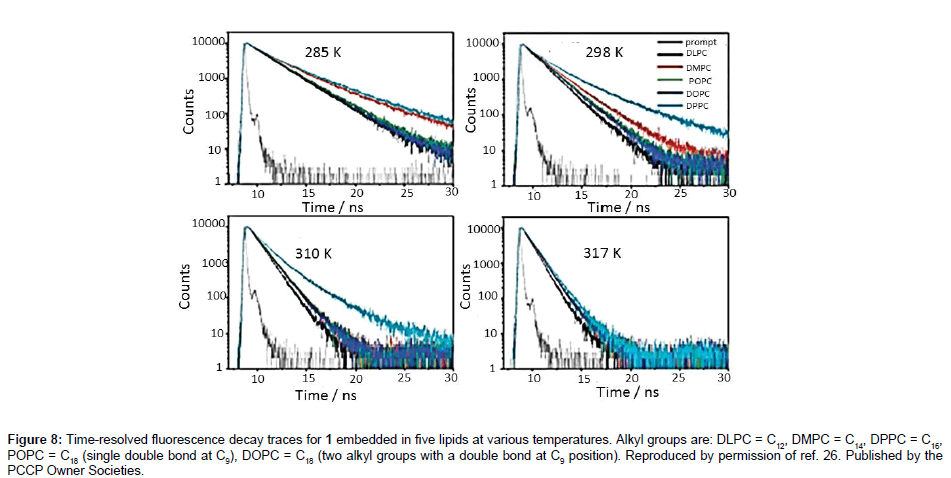
Still focusing on the rotor 1 three other pieces of work by the group of Kuimova and co-workers [26] have delved into viscosity measurements in membranes and lipid phases. It is known that cellular regulatory pathways involve lipid membranes, and the ability to measure viscosity and diffusion within them is extremely important. To model a membrane, large and giant unilamellar vesicles (LUVs & GUVs) incorporating phosphatidylcholine lipids were prepared and studied using FLIM. Fluorescence lifetimes were measured for 1 in single-lipid artificial bilayers prepared as LUVs. Different carbon chain length hydrocarbons were used to prepare LUVs of ca. 200 nm diameter, which had different gel-to-liquid (Lβ to Lα) transition temperatures. At optimised [lipid]:[1] concentrations time-resolved fluorescence traces were recorded for 1 in the lipid bilayer at temperatures between 285 to 345K (Figure 8). The first noticeable feature from the graphs was the change in shape of the profiles with temperature. At temperatures below the lipid transition temperature the decays are bi-exponential, which was taken to show that compound 1 resides in different rigidity/viscosity environments in the gel phase. By contrast, only one environment appeared to exist for 1 when it was incorporated into a liquid disordered (Ld) phase of a LUV.
Figure 8: Time-resolved fluorescence decay traces for 1 embedded in five lipids at various temperatures. Alkyl groups are: DLPC = C12, DMPC = C14, DPPC = C16, POPC = C18 (single double bond at C9), DOPC = C18 (two alkyl groups with a double bond at C9 position). Reproduced by permission of ref. 26. Published by the PCCP Owner Societies.
A rather interesting extension to the work involved cholesterol sensing in binary lipid mixtures, since the compound is essential in many membrane associated processes. In a series of experiments LUVs were prepared containing either DOPC (see Figure 8 for details) or sphingomyelin with varying amounts of added cholesterol. The viscosity of the LUV was determined using 1, again by measuring the fluorescence lifetime of the rotor. For a 40% cholesterol content the increase in viscosity within the LUV was about 16%. Other experiments focussed on phase-separated 1,2,-dioleoyl-sn-glycero- 3-phosphochotine-cholesterol-sphingomyelin GUVs where it was possible to visualise individual liquid ordered (Lo) and liquid disordered (Ld) domains using FLIM.
Other applications by the Kuimova group have focussed on the use of rotor 1 to investigate the viscosity of the inner membrane of Bacillus spores [27]. Here, the inner membrane of the sphores was shown to be extremely high (>1000 cP) corresponding to a lipid bilayer in the gel state. The group were also able to demonstrate that the membrane evolved during germination to reach a viscosity of ca. 600 cP. Other separate work focused on viscosity measurements within the plasma membranes of live cells [28]. A new rotor dye 3 (Figure 3) was introduced containing a dicationic alkyl chain which was added to eradicate the problem of endocytosis in live cells that hampered the use of the normal rotor 1.
If one alkyl chain is sufficient for membrane localisation of 1 then additional fatty chain units on the phenyl group might have an additional effect. The derivatives 4-7 (Figure 3) prepared by Cebecauer and co-workers [29] were intended to see if one, two or three fatty chains achieved a more defined and deeper positioning of a dye in membranes. The group prepared lipid vesicles including small unilamellar vesicles (SUVs), multilayer vesicles (MLVs) and GUVs similar to those used by Kuimova et al. [20] containing the rotor dyes. From the studies it was shown that compounds 5 and 7 locate deeper into the lipid bilayer when compared to 1. Other results pointed to the fact that the fluorescence properties of the rotors were influenced by both the lipid packing and the orientation of the probes in the membranes.
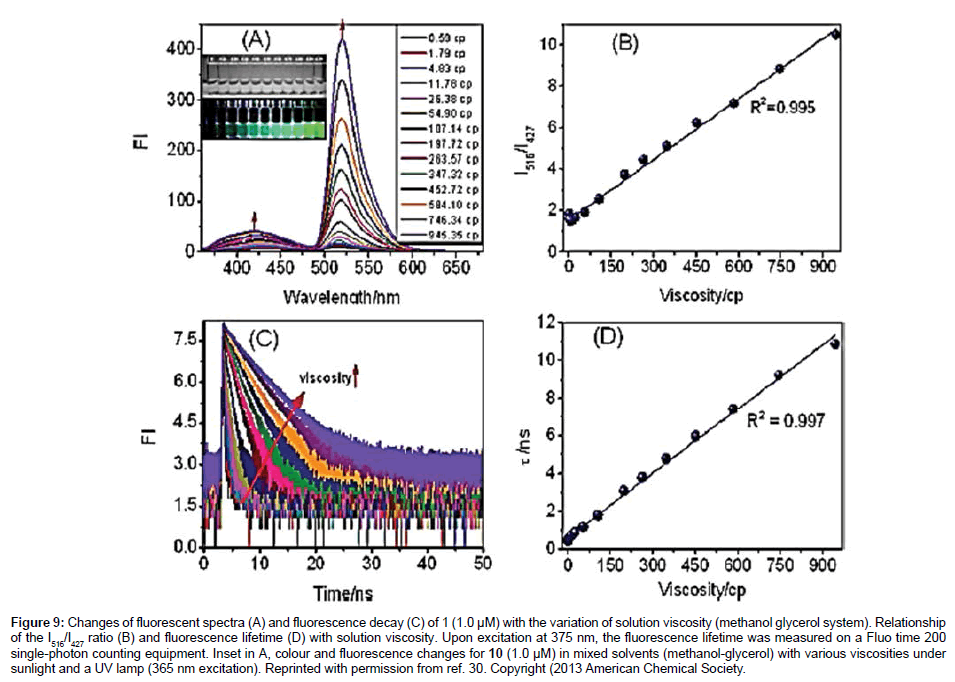
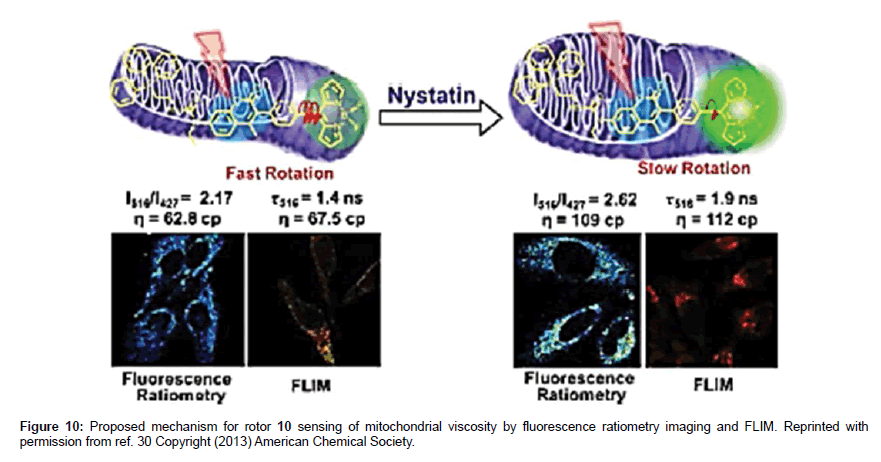
To finish off this section focus is placed on the more exotic rotor derivatives 10-14 as shown in Figure 3. The addition of a secondary group is introduced for a calibrating purpose (10-12), or as polarity sensor (13) and finally as a new type of rotor group (14). The groups of Kang and Kim [30] created the self-calibrating bipartite sensors 10- 12 for targeting mitochondria. The molecules incorporate a coumarin appended to either a rotor Bodipy (10,11) or a fully alkylated Bodipy (12). For this latter compound no Bodipy-based viscosity dependent fluorescence behaviour was expected or seen. As shown in Figure 9A two emission bands were observed for 10 at 427 nm (coumarin-based) and 516 nm (Bodipy-based). The emission intensity associated with the coumarin was found to be slightly sensitive to solvent viscosity, whereas the Bodipy fluorescence was enhanced considerably as the viscosity increased. A direct linear relationship was seen between the ratio I516/ I427 vs viscosity (Figure 9B). A similar linear relationship was also observed between the fluorescence lifetime for the Bodipy and viscosity (Figures 9C and 9D).
Figure 9: Changes of fluorescent spectra (A) and fluorescence decay (C) of 1 (1.0 μM) with the variation of solution viscosity (methanol glycerol system). Relationship of the I516/I427 ratio (B) and fluorescence lifetime (D) with solution viscosity. Upon excitation at 375 nm, the fluorescence lifetime was measured on a Fluo time 200 single-photon counting equipment. Inset in A, colour and fluorescence changes for 10 (1.0 μM) in mixed solvents (methanol-glycerol) with various viscosities under sunlight and a UV lamp (365 nm excitation). Reprinted with permission from ref. 30. Copyright (2013 American Chemical Society.
Further viscosity-based experiments showed that 10 localised in the mitochondria of HeLa cells whereas the control compounds 11 and 12 showed no such staining. The triphenylphosphonium group is the target unit for the mitochondria. The average viscosity for the mitochondria in HeLa cells was estimated to be 62.8 cP. There was an increase in viscosity for the mitochondria upon the treatment with monensin and nystatin because of induced swelling and structural changes. The technique of FLIM was also conducted on 10 in HeLa cells, and revealed a viscosity of 67.5 cP for the mitochondria in good agreement with the ratiometric method. The results also collected when cell apoptosis are in accord with an increase in viscosity as shown in Figure 10.
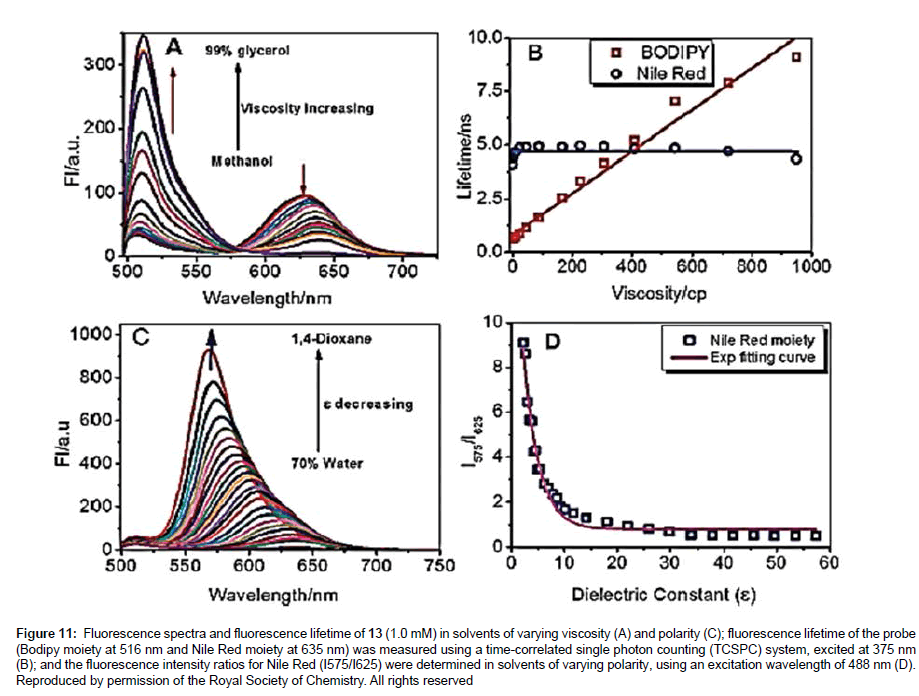
The Nile Red rotor derivative 13 was very recently prepared by the group of Kang and Kim [31] to observe changes in micropolarity and microviscosity of the endoplasmi reticulum (ER). The organelle ER is involved in the synthesis of secretory and membrane proteins, including their post-translational modification (e.g., glycosylation). It is known that accumulation of large amounts of unfolded/misfolded proteins in the ER promotes stress response, which has been linked to certain diseases such as diabetes and Alzheimer’s disease. Considering the structure of an ER where partially folded and glycosylated proteins accumulate there is a good chance that the viscosity and polarity change during stress. The probe 13 was designed to monitor simultaneously polarity (Nile Red) and viscosity (Bodipy). The graphs in Figure 11 illustrate two sets of experiments to demonstrate the effect of changing the viscosity of the solution (top) and the polarity of the solution (bottom). One point is worth noting; namely, two very distinct fluorescence profiles are observed for the viscosity experiment so that a ratiometric method can be employed. From the results, 13 is a good candidate as a bimodal probe to measure viscosity and polarity in ER. Further experiments from the group showed that during ER stress by tunicamycin the viscosity increased from 129.5 cP to 182 cP, and was accompanied by a polarity enhancement (Δε ~ 2.6).
Figure 11: Fluorescence spectra and fluorescence lifetime of 13 (1.0 mM) in solvents of varying viscosity (A) and polarity (C); fluorescence lifetime of the probe (Bodipy moiety at 516 nm and Nile Red moiety at 635 nm) was measured using a time-correlated single photon counting (TCSPC) system, excited at 375 nm (B); and the fluorescence intensity ratios for Nile Red (I575/I625) were determined in solvents of varying polarity, using an excitation wavelength of 488 nm (D). Reproduced by permission of the Royal Society of Chemistry. All rights reserved
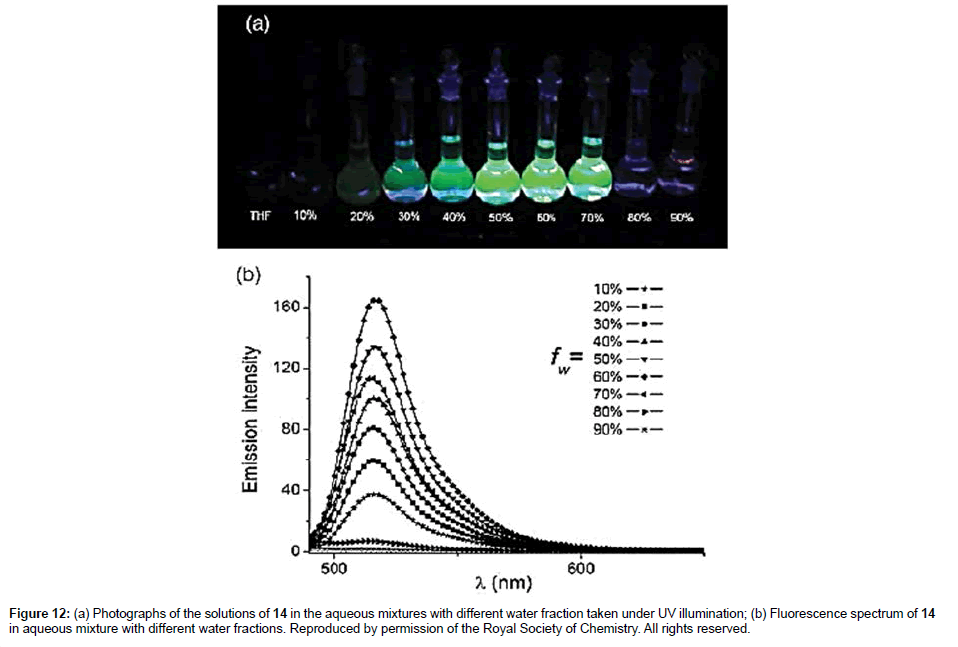
To conclude this section the final example 14 is discussed which is slightly different in its working in that a ferrocene moiety is used as the rotor [32]. The two methyl groups on the Bodipy restrict the rotation of the meso-phenyl group. Fluorescence spectra recorded for 14 in THF/ ethylene glycol mixtures displayed the typical intensity enhancement with increase in solvent viscosity in accord with the Förster-Hoffmann expression. Although non-radiative deactivation of the Bodipy excited state because of ferrocene rotation was proposed the actual mechanism is not clear. The ethynyl group is essential since in the derivative with this missing, the Bodipy is non-emissive because of excited state quenching by efficient electron transfer. Viscosity measurements were also carried out using 14 in H
Sol-gel formation
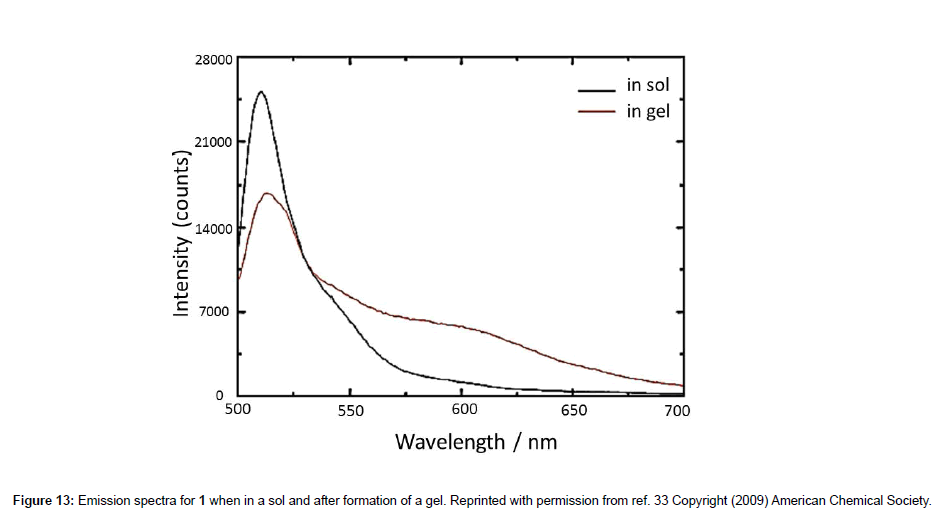
The sol-gel transition involves the transformation of a solution or biopolymer into an integrated network, which may comprise discrete particles or interlocked polymer chains. There has been great interest in the sol-gel process which is accompanied by a major alteration in the local viscosity. Probing the sol-gel transition by the Bodipy probe 1 was reported by Hungerford and co-workers [33] using fluorescence lifetime measurements. The experiments consisted of monitoring the sol-gel transition for tetraethyl-ortho-silicate (TEOS) systems; the process involves a colloidal suspension (sol) that undergoes hydrolysis and condensation to form a gel. The steady-state emission spectra for 1 before and after the sol-gel transition are shown in Figure 13. From both spectra it was evident that the rotor formed aggregates because of the presence of the long-wavelength broad band at ca. 600 nm. Certainly this feature was a deemed a problem, particularly when the authors considered the time-resolved fluorescence lifetime data for application to Eq. 2. A three exponential fit to the lifetime data collected was used and analysed to take into account molecular aggregates and a viscosity dependent contribution. The sol-gel transition appeared to go through a two-step process corresponding to a fast increase in viscosity followed by a slower gradual increase.
The authors also considered temperature induced alterations in a gellum gum structure which consists of a linear teterasaccharide repeating unit; a sol-gel transition at 33-50°C is known for commercial Gelrite. Again lifetime data were collected for the probe in Gelrite over a temperature range. Of course, to pull out of the data the viscosity effect is slightly problematic because the temperature is no longer constant. Despite this, however, the fluorescence lifetime data did not show any pronounced change at around 30°C, even though major structural changes were known to occur because of chain melting. More interesting results were found when Mg2+ ions were added to the Gelrite; the metal cation binds to the polysaccharide double helix and instigates aggregation. For example, at 20°C there was an apparent decrease in viscosity upon addition of Mg2+.
Rotor-FRET probes
To finish this review a brief look into the concept of combining the rotor effect with fluorescence resonance energy transfer (FRET) is described. The process of FRET involves the movement of energy from one part of a molecular assembly to the other through a Coulombic process (Förster energy transfer). FRET depends upon a number of parameters associated with the actual molecular components as detailed in Eq. 7:
 (Eq. 7)
where kEET is the rate constant for energy transfer, φD is the fluorescence quantum yield of the donor alone, τD is the lifetime of the donor alone, κ2 is the orientation factor, n is the solvent refractive index, R is the separation distance (in cm) and JF the overlap integral (in mmol-1 cm6) [34].
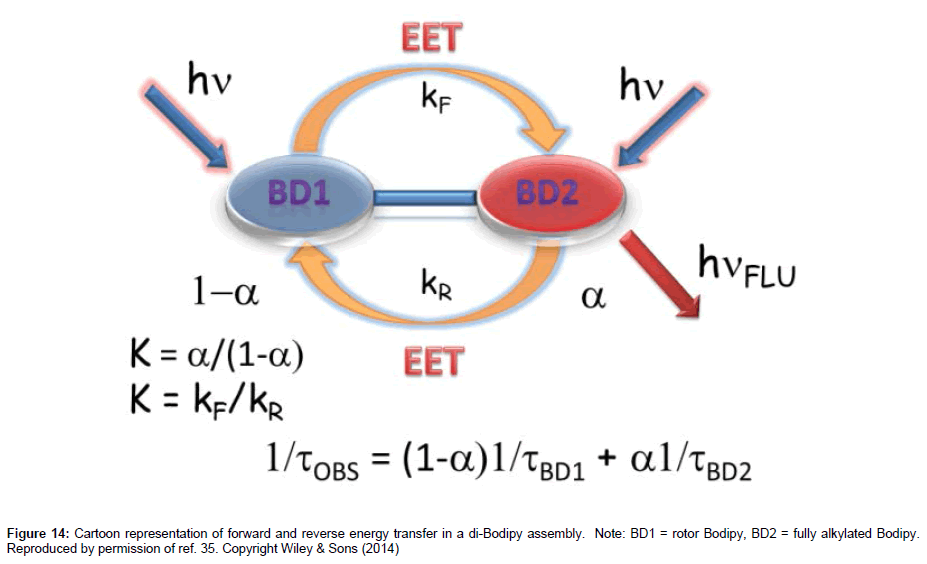
Two slightly different Bodipy groups are the components of the molecular system 15: one is a molecular rotor and the other is fully alkylated [35]. As a consequence of the difference the two subunits absorb and emit at slightly different wavelengths, with the rotor Bodipy absorbing/fluorescing towards higher energy. One upshot of this feature is Jf is appreciably large and kET is favoured for Förster energy transfer from the rotor to the other Bodipy. Since the fluorescence output from a rotor Bodipy is generally low the idea was to pass its energy over to the other more fluorescent unit so that it became the reporter. However, a slight complication to the system is the possibility of reverse energy transfer, although the probalility is less than the forward process. The overall scheme is represented in the cartoon shown in Figure 14. Detailed spectroscopic measurements performed on 15 confirmed the swapping back and forth of energy and viscosity dependent fluorescence output. The applicability of such a molecule to monitoring viscosity in real systems has yet to be tested. One advantage of using a molecule such as ROFRET is the much lower concentration of the probe needed to collect a reasonable output signal. This is certainly advantage for the monitoring of fluorescence in media where high dye concentration may cause cross signal contamination by intermolecular interactions.
Conclusion
Fluorescent Bodipy-based rotors offer the opportunity to measure viscosity in different environments that may otherwise be difficult to achieve by other methods. Since fluorescence can be readily monitored down to very low concentrations of dye the technique may even be applicable down to the single-molecule level. At present no studies have been attempted to monitor viscosity using Bodipy rotors under such extremely demanding spectroscopic conditions.
Acknowledgements
ACB would like to thank Newcastle University for financial support and the authors of the papers cited for their insightful work and use of their pictures.
References
- Zhang Y, Wu X, Wang Y, Zhu S, Gao BZ, et al. (2014) Measurement of the Microscopic Viscosities of Microfluids with a Dynamic Optical Tweezers System. Laser Phys 24: 065601.
- Haidekker MA, Theodorakis EA (2007) Molecular rotors--fluorescent biosensors for viscosity and flow. Org Biomol Chem 5: 1669-1678.
- Lakowicz JR (1999) Principles of Fluorescence Spectroscopy, Second Edition, Springer.
- Yang Z, Cao J, He Y, Yang JH, Kim T, et al. (2014) Macro-/micro-environment-sensitive chemosensing and biological imaging. Chem Soc Rev 43: 4563-4601.
- Kuimova MK (2012) Mapping viscosity in cells using molecular rotors. Phys Chem Chem Phys 14: 12671-12686.
- Benniston AC, Copley G (2009) Lighting the way ahead with boron dipyrromethene (Bodipy) dyes. Phys Chem Chem Phys 11: 4124-4131.
- Boens N, Leen V, Dehaen W (2012) Fluorescent indicators based on BODIPY. Chem Soc Rev 41: 1130-1172.
- Wood TE, Thompson A (2007) Advances in the chemistry of dipyrrins and their complexes. Chem Rev 107: 1831-1861.
- Loudet A1, Burgess K (2007) BODIPY dyes and their derivatives: syntheses and spectroscopic properties. Chem Rev 107: 4891-4932.
- Kim K, Jo C, Easwaramoorthi S, Sung J, Kim DH, et al. (2010) Crystallographic, Photophysical, NMR Spectroscopic and Reactivity Manifestations of the “8-Heteroaryl Effect” in 4,4-Difluoro-8-(C4H3X )-4-bora-3a,4a-diaza-s-indacene (X= O, S, Se) (BODIPY) Systems. Inorg Chem 49: 4881-4894.
- Lai RY, Bard AJ (2003) Electrogenerated Chemiluminescence 71. Photophysical, Electrochemical, and Electrogenerated Chemiluminescent Properties of Selected Dipyrromethene-BF2 Dyes. J Phys Chem B 107: 5036-5042.
- Umezawa K, Matsui A, Nakamura Y, Citterio D, Suzuki K (2009) Bright, color-tunable fluorescent dyes in the Vis/NIR region: establishment of new "tailor-made" multicolor fluorophores based on borondipyrromethene. Chemistry 15: 1096-1106.
- Strickler SJ, Berg RA (1962) Relationship between Absorption Intensity and Fluorescence Lifetime of Molecules. J Chem Phys 37: 814-822.
- Rachford AA, Ziessel R, Bura T, Retailleau P, Castellano FN (2010) Boron dipyrromethene (Bodipy) phosphorescence revealed in [Ir(ppy)(2)(bpy-C[triple bond]C-bodipy)](+). Inorg Chem 49: 3730-3736.
- Wu W, Sun J, Cui X, Zhao J (2013) Observation of the Room Temperature Phosphorescence of Bodipy in Visible Light-harvesting Ru(II) Polyimine Complexes and Application as Triplet Photosensitizers for Triplet–triplet-annihilation Upconversion and Photocatalytic Oxidation. J Mater Chem C 1: 4577-4589.
- Ulrich G, Ziessel R, Harriman A (2008) The chemistry of fluorescent bodipy dyes: versatility unsurpassed. Angew Chem Int Ed Engl 47: 1184-1201.
- Kee HL, Kirmaier C, Yu L, Thamyongkit P, Youngblood WJ, et al. (2005) Structural control of the photodynamics of boron-dipyrrin complexes. J Phys Chem B 109: 20433-20443.
- Loutfy RO, Arnold BA (1982) Effect of Viscosity and Temperature on Torsional Relaxation of Molecular Rotors. J Phys Chem 86: 4205-4211.
- Hu R, Lager E, Aguilar-Aguilar A, Liu J, Lam JWY, et al. (2009) Twisted Intramolecular Charge Transfer and Aggregation-Induced Emission of BODIPY Derivatives. J Phys Chem C 113: 15845-15853.
- Kuimova MK, Yahioglu G, Levitt JA, Suhling K (2008) Molecular rotor measures viscosity of live cells via fluorescence lifetime imaging. J Am Chem Soc 130: 6672-6673.
- Alamiry MAH, Benniston AC, Copley G, Elliott KJ, Harriman A, et al. (2008) A Molecular Rotor Based on a Unhindered Boron Dipyrromethene (Bodipy) Dye. Chem Mater 20: 4024-4032.
- Förster Th, Hoffmann GZ (1971) Viscosity Dependence of Fluorescent Quantum Yields of Some Dye Systems. Phys Chem 75: 63-76.
- Alamiry MAH, Bahaidarah E, Harriman A, Bura T, Ziessel R (2012) Fluorescent Molecular Rotors Under Pressure: Synergistic Effects of an Inert Polymer. RSC Advances 2: 9851-9859.
- Levitt JA, Chung PH, Kuimova MK, Yahioglu G, Wang Y, et al. (2011) Fluorescence anisotropy of molecular rotors. Chemphyschem 12: 662-672.
- Levitt JA, Kuimova MK, Yahioglu G, Chung PH, Suhling K, et al. (2010) Fluorescence Lifetime Imaging of Molecular Rotors to Map Microviscosity in Cells. Chin Opt Lett 8: 926-930.
- Wu Y, Stefl M, Olzynska A, Hof M, Yahioglu G, et al. (2013) Molecular Rheometry: Direct Determination of Viscosity in Lo and Ld Lipid Phases via Fluorescence Lifetime Imaging. Phys Chem Chem Phys 15: 14986-14993.
- Loison P, Hosny NA, Gervais P, Champion D, Kuimova MK, et al. (2013) Direct investigation of viscosity of an atypical inner membrane of Bacillus spores: a molecular rotor/FLIM study. Biochim Biophys Acta 1828: 2436-2443.
- López-Duarte I, Vu TT, Izquierdo MA, Bull JA, Kuimova MK (2014) A molecular rotor for measuring viscosity in plasma membranes of live cells. Chem Commun (Camb) 50: 5282-5284.
- Olšinová M, Jurkiewicz P, Pozník M, Šachl R, Prausová T, et al. (2014) Di- and tri-oxalkyl derivatives of a boron dipyrromethene (BODIPY) rotor dye in lipid bilayers. Phys Chem Chem Phys 16: 10688-10697.
- Yang Z, He Y, Lee JH, Park N, Suh M, et al. (2013) A self-calibrating bipartite viscosity sensor for mitochondria. J Am Chem Soc 135: 9181-9185.
- Yang Z, He Y, Lee JH, Chae WS, Ren WX, et al. (2014) A Nile Red/BODIPY-based bimodal probe sensitive to changes in the micropolarity and microviscosity of the endoplasmic reticulum. Chem Commun (Camb) 50: 11672-11675.
- Yin X, Li Y, Zhu Y, Jing X, Li Y, et al. (2010) A highly sensitive viscosity probe based on ferrocene-BODIPY dyads. Dalton Trans 39: 9929-9935.
- Hungerford G, Allison A, McLoskey D, Kuimova MK, Yahioglu G, et al. (2009) Monitoring sol-to-gel transitions via fluorescence lifetime determination using viscosity sensitive fluorescent probes. J Phys Chem B 113: 12067-12074.
- Braslavsky SE, Fron E, Rodríguez HB, Román ES, Scholes GD, et al. (2008) Pitfalls and limitations in the practical use of Förster's theory of resonance energy transfer. Photochem Photobiol Sci 7: 1444-1448.
- Bai D, Benniston AC, Whittle VL, Lemmetyinen H, Tkachenko NV (2014) ROFRET: A Molecular-scale Fluorescent Probe Displaying Viscosity Enhanced Intramolecular Förster Energy Transfer. ChemPhysChem 15: 3089-3096.
Relevant Topics
Recommended Journals
Article Tools
Article Usage
- Total views: 16875
- [From(publication date):
December-2014 - Aug 30, 2025] - Breakdown by view type
- HTML page views : 12011
- PDF downloads : 4864

