Natural Hazard and Crop Yield in Oleh, South-South Nigeria: Flooding in Perspective
Received: 10-Dec-2013 / Accepted Date: 17-Jan-2014 / Published Date: 22-Jan-2014 DOI: 10.4172/2157-7617.1000181
Abstract
We examined the effects of flooding on crop yield in Oleh, South-South Nigeria. The length of the different farmlands were taken, the length of the flooded period, the percentage of total length and the depth of the flood water were all recorded and used for the study. The period of water retention on the farmlands was measured and the flood type categorized. The estimated yield and estimated loss from the farmlands for the two years (2011 and 2012) were recorded and analyzed. The study revealed that there was a high level of inundation in farmlands in Oleh soon after every rain event. A mean value of 0.608 kilometers of flooded portion was recorded at Odah in 2011, 0.441 kilometers at Iwhreotah in 2011, 0.547 kilometers at Erorin in 2011 and 0.485 kilometers at Odah in 2012, 0.425 kilometers at Iwhreotah in 2012 and 0.598 kilometers of flooded portion in 2012 at Erorin quarters were generally observed in the farm lands. The study revealed that all the crops cultivated in the area (cassava, melon, yam, maize, plantain) were affected by flooding above 50 percent of total yield of each crop cultivated in the area except yam (46.9%). We recommend that fast growing and quick yielding species of plants be introduced in the area as well as the ridge and furrow method of farming. The ridge will be used to plant the crops, while the furrow acts as a check to the excess water found on the farmland.
Keywords: Oleh; Crop yield; Natural hazard; Flooding; Nigeria
5712Introduction
Flooding is considered as the world’s worst global hazard in terms of magnitude, occurrence, and geographical spread, loss of life and property, and displacement of people and socio economic activities. Today, despite greatly improved knowledge of weather systems, the use of meteorological satellites and advanced computer simulation of the climate, farmers are more exposed to climate extremes than ever before. While such extremes are becoming increasingly common as a result of climate change, vulnerability has increased for other reasons as well: population densities have increased; marginal land is increasingly used to grow inappropriate crops, leading to potential soil erosion and flash floods; deforestation has denuded steep land of its protective vegetative cover; powerful machinery has made it possible to strip land of its vegetation in a fraction of the time that used to be required; and economic pressures on farmers to increase productivity through high input farming have led to unstable and unsustainable farming practices. It should come as no surprise that as urban development increases, the impact on neighbouring agricultural producers - particularly those farms in lowland areas could be severe.
Flood is one of the natural environmental hazards ravaging the landscape of mankind over the years. Whenever this occurs, they result in the loss of properties, lives, destruction of farmlands etc in most towns in the world. For example, the Bangladesh floods of 1970 claimed well over three hundred thousand (300,000) lives on 12, November (http://www.wmo.int/pages/about/wmo50/e/world/weather_pages/chronicle_e.html), Ogunpa floods of 1980 killed over one hundred (100) people and fifty six lives were lost in Kano 1988 flood episode [1]. When river Oder flooded part of Czech Republic and Poland, more than one hundred people died [2]. A crucial part of the concept of flood hazard is the interface between floods and people. A flood is not hazardous unless humans are sufficiently affected – World Commission on Dams (2000). A disaster is not a physical happening; it is a social event. It is in one sense the manifestation of the vulnerabilities of a social system and prime attention should be given to doing something about such vulnerabilities. Thinking disasters as social phenomena allow them to be seen as something which can be reacted to as part of ongoing policies and programmes of national and social development which could reduce societal vulnerabilities in the first place. Therefore, activities carried out for developmental purposes can be seen as an integral part of disaster prevention and mitigation.
Extensive damages are often done to agricultural products and lands by floods. In Niger Delta region of Nigeria, well over 650,000 hectares of good agricultural land are flooded annually for not less than two months [3]. The Oder floods of 1997 damaged some 70,000 hectares of arable land and the entire Ziltendorf valley in Germany was inundated the lowlands and the fertile flood plains along their courses (www.dartmouth.edu/~floods/Archives/MasterSpreadsheet.xls). When flood occurs the inhabitants of such areas are forced to abandon their farmlands. Flooding occurs when an area of land, usually low-lying, is submerged by water. The worst floods usually occur when a river overflows its bank. Floods happen when soil and vegetation cannot absorb all the water. The water then runs off the land in quantities that cannot be carried in stream channels or kept in natural ponds or manmade reservoirs.
The devastating effect of flood is a major concern to farmers, thus forming headlines in Nigerian dailies. Flood has a wide range of influences on the interaction between man and his environment. Flooding hazard is a universal problem, which has become a matter of great concern to many professionals such as the planners, climatologists, hydrologists, environmentalists and economists. Thus they (planners, climatologists, hydrologists, environmentalists and economist) emphasized the limitation of man in attempting to control the sheer force of nature, as they occur either in developed or developing societies and they are always associated with the loss of lives and property, hardship, diseases and in most time famine. Although, different measures have been taken towards curbing the problem of flood by experts, the phenomena remains one of the least understood by hydrologist, fluvial geomophologists, engineers and planners [4].
Over the years, some farmers in Oleh Community have been experiencing seasonal flooding problems which have resulted in low crop yield and income. It is evident from literatures that flooding has brought economic set back in the area leading to destruction of farmlands. Some major farmlands that are affected by flood are ‘Erorin’, ‘Odah’, ‘Ada’, ‘Iwhreotah’ to mention a few. Research has shown that there has been concentration of studies on urban flood [2,5-9] while rural flood hazards which negatively affect agricultural crops in the country are neglected. In fact, all these scholars did extensive studies on urban flood event of Ibadan, Benin city, Ilorin and Abraka respectively. The reason for this concentration according to Oriola [2] and Efe [8] is because of the magnitude of havoc and the lives that are involved in the cities. Even the print and electronic media, daily reports on flood event is also highly concentrated on urban flood and even if they do not give detail information on the size of farmland, number of crops and cost of crops affected are hardly documented. Thus, there is dearth of information in this aspect of flood studies that call for redress.
Global warming and intensification of rains in the recent years has made flooding a problem to farmers in the area. In the past, farmlands being flooded were not much, unlike today that most farmlands are being flooded like the ‘Erorin’, ‘Iwhreotah’, ‘Odah’ and others. In the 1980s, for example, many farmers in Oleh used to harvest about 1200 kg (forty (40) bags) of cassava annually and about twenty (20) basketslocally called ‘abo’ - of yams from their farms each harvest season. Each ‘abo’ can contain up to 15 to 20 tubers of yams each yam weighing about 4 kg. However, these days they hardly harvest five (5) bags of cassava and three (3) baskets of yam from their farm as a result of flooding. This is because farmers are faced with flood problems and their crops do not mature for harvest before they are forced to harvest them prematurely, and as such, the expected crop yield is not met. Flooding has caused a great set back to mankind. Flooding in some agricultural farmland in Oleh has caused a lot of problems and difficulties to inhabitants especially the farmers. The expansion and intensification of agriculture into marginal lands and wetlands have continued to rely on the agency of small scale peasant farmers who use traditional farming practices and technology that are known to malfunction under conditions of high population pressure on the land resource and escalating markets demands [10].
Basically, in every episodic rainfall in the south-south region of Nigeria, large proportions of farmlands are often submerged up to 0.5 m and 1 m depth. For instance, during such flood hazard periods, most rubber and plantain plantations submerged while cassava, maize, melon, vegetable farms are totally destroyed by flood. Thus, most farmers in the area resort to prayer for God’s intervention during the wet season but to no avail. There has been outcry to the local, state and federal governments’ emergency relief department and the Ministry of Agriculture and Environment for assistance and control of the flood events in the area, but government responses over the years has not yielded any positive result. Thus the devastating effects of flooding on crop yield are being exacerbated seasonally as a result of climate change and fears of food insecurity even at the subsistence level abounds.
Aims and Objectives of the Research
The aim of this study is to examine the effects of natural hazard (flooding) on crop yield in Oleh. The specific objectives are to:
• Discuss the causes of flooding in Oleh community
• Assess the impact of flooding on crop yield
• Suggest measures and recommendations necessary to mitigate flooding in the area.
The Study Area
Location
Oleh is situated at the centre of Isoko land in Isoko South Local Government Area of Delta State. Irri community bounds the town on the east; on the west, it has boundary with Akiewhe; on the north, it is bounded by Ozoro and on the south by Emede and Olomoro communities. It lies within latitude 5°15′00″ to 5°30′00″ north of the equator and longitude 6°07′30″ to 6°22′30″ east of the Greenwich meridian (Figure 1). The town and its environs occupy a total land area of about 1,089 square kilometers.
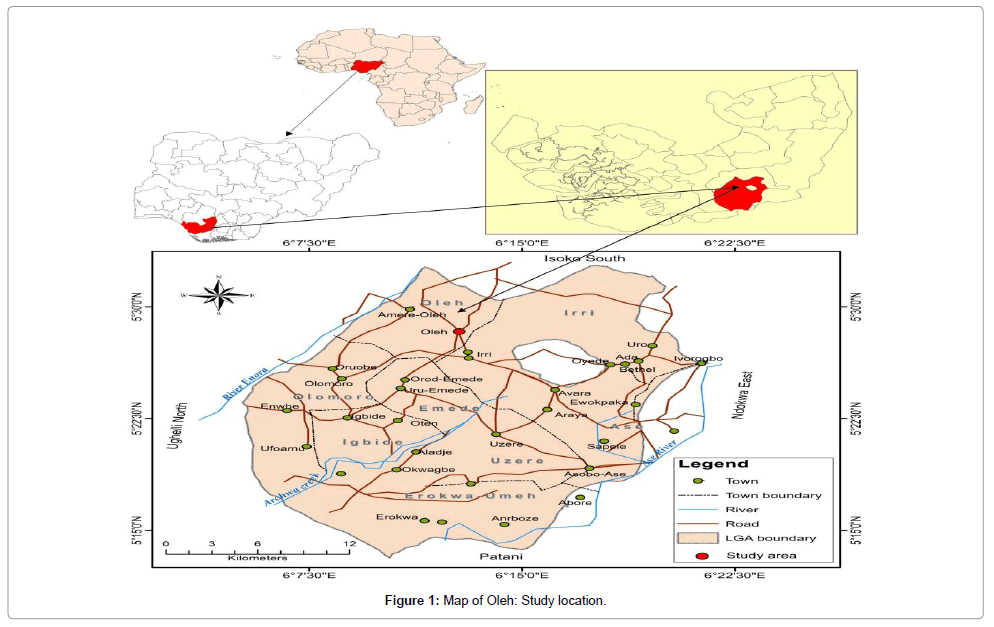
Figure 1: Map of Oleh: Study location.
Oleh lies within the tropics, which is characterized by tropical climate. It is hot and humid with distinct wet and dry seasons. The wet season starts in April and ends October, with brief spell of dry sunny weather of about two weeks in August, which is referred to as August break. The rainy season begins with strong winds emanating from the south-west monsoon winds, thunder storm and lightening. It is also characterized by occasional flooding in some parts of Oleh. The dry season begins from November and ends in March. During this period, the area is influenced by dry dusty and hazy north-east trade winds thereby bringing harmattan to the area. Mean temperature ranges from 28°C to 33°C. The mean annual rainfall ranges from 2000 mm to 3000 mm.
Agriculture is the mainstay of the economy of the Oleh people. Virtually every family is involved in the cultivation of food crops. They practice intensive, subsistence and commercial farming. Of the quantities produced, very little is consumed while the rest goes to the market. Their method of production is usually characterized by the use of simple implements - cutlasses, hoes, diggers and so on. The main crops produced are cassava, yam, sweet potato, groundnut, pepper, garden egg, okro, vegetable etc on the fringes, plantain and cassava are the only crops planted.
They normally practice bush fallow or shifting cultivation. During flood season, farmers are forced to harvest every crop whether mature or not. This occurs within the months of July through September. The major occupation of the inhabitants of Oleh is farming. Oleh supplies about thirty-five percent of cassava production in the local government area and the palm nut collectors collect palm nut between December and February and cracked them in large bags for sales. They also extract palm oil from the palm kernel for consumption and sale.
Methodology
We used field survey of some flooded farmlands under different crops within Oleh. The survey was carried out in areas of flooded farmlands and farmlands that were not flooded. To have proper coverage, the study area was stratified into three zones namely; Iwhreotah, Erorin and Odah (Figure 2).
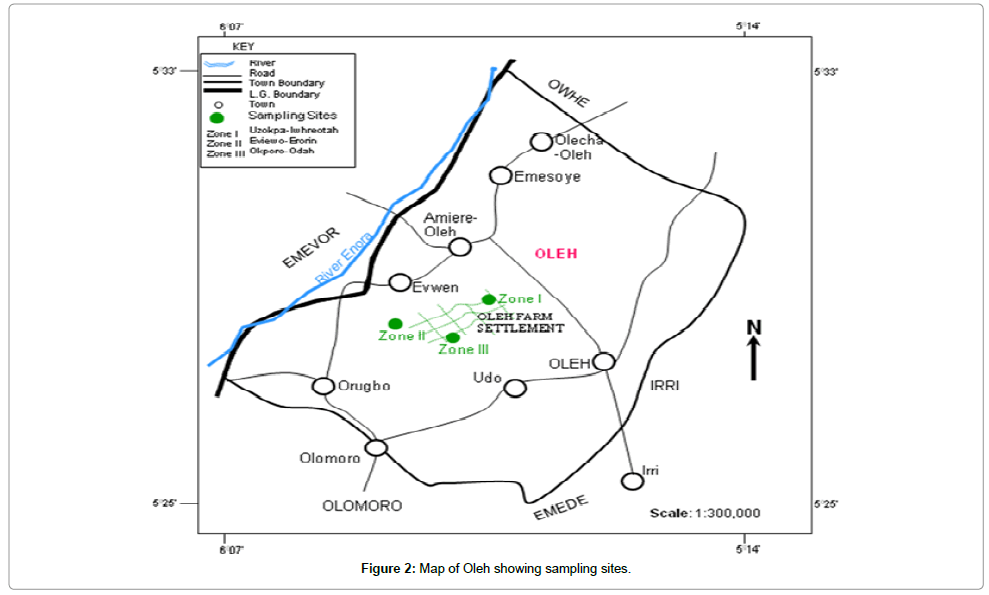
Figure 2: Map of Oleh showing sampling sites.
We carried out a preliminary investigation of the three zones where farmlands were flooded under different crops in the area. Through the reconnaissance survey, we determined and choose appropriate sampling method for the study. To ensure proper representation of the population under investigation, the purposive sampling method was employed to select the three flooded farmlands within each zone under the different crops; cassava, maize, yam, melon and plantain based on the existing quarters. These crops were chosen because they are grown locally by the farmers in Oleh community. The flood data was collected in length and measured in meters, flooded portion in kilometers; percentage of length, depth in centimeters; periodicity and category of the flood in the farmlands were selected for samples collection. However, 65 samples were drawn from the study area for inclusion in the study. A total of 50 samples were drawn from 10 flooded farmlands (5 in each zone) under different crops and a total of 15 samples from were drawn from 3 flood-free farmlands. The different farmlands used were equal in size, being one acre each.
We utilized personal observation and direct field measurements between the months of July and September. Flood information was gathered from each of the zones mentioned above.
After heavy rainfall, when the farmlands were flooded, we engaged in personal observation and taking photographs of the affected areas. Measurement of the flood depth, the length, width and the category of flood were recorded for each day. This was done to ascertain the depth of floods and area covered by the flood in the different zones.
Measurements of crops yield in all the sampled farmlands flooded and farm lands that were not flooded was done using kilogram scale. Cassava was weighed with a scale in the flooded farm lands after the harvest. Melon was harvested and package in a sack, sun dry and weighed. Tubers of yam were weighed on the scale in the farmlands. Also, maize was harvested and weighed with the cob. This was so because maize was harvested prematurely as a result of flooding so it could not be left dry on the farm. Plantain was equally weighed in the flooded farm lands. The difference in crop yields of flooded and not flooded farmlands expressed in percentage, gave the percentage loss of crop yields. The researchers also conducted oral interview with farmers of flooded farmlands to gather relevant information that was useful to this research.
Data were analyzed using regression analysis in the SPSS version 16.0 software for windows. However, results were presented in tables, figures and percentages.
Results and Discussion
Flood characteristics of farmlands in Oleh
Tables 1-6 show the distribution of farmlands and the proportion of the land affected by flood including the cultivated crops. A total of thirty (30) farmlands from the three zones (Odah, Iwhreotah and Erorin) were surveyed in 2011 and 2012 respectively. Crops such as cassava, melon, yam, maize, plantain were cultivated in these farmlands with each farm having a unique crop. Farm A is planted with cassava; Farm B, melon; Farm C, yam; Farm D, maize; Farm E, plantain. This zonation is represented in the three zones surveyed. The length of farmland varies from one farm to the other and from one zone to another; so also is the flooded portion, depth of the water, period of flooding, crop cultivated and total yield.
The farmlands of Oleh have been subjected to seasonal flood events during and after every rain throughout the period of study 2011 and 2012. The sampled farms in the three quarters studied and the crops planted therein were submerged under water soon after every heavy rain. The flooded portion of farmlands at Odah quarter varies from 0.28 square kilometers to 0.77 square kilometers with a mean of 0.608 square kilometers in 2011. In Iwhreotah quarter, the flooded portion varies from 0.24 square kilometers to 0.57 square kilometers with a mean of 0.441 square kilometers. While at Erorin, the flooded portion is from 0.25 square kilometers to 0.70 square kilometers with a mean of 0.547 square kilometers in 2011. In 2012, the flooded portion of the farmland varies from 0.31 square kilometers to 0.75 square kilometers a mean of 0.485 square kilometers. At Iwhreotah quarter, the flooded portion varies from 0.24 square kilometers to 0.66 square kilometers with a mean of 0.425 square kilometers. While at Erorin, the flooded portion varies between 0.28 square kilometers to 0.73 square kilometers; with a mean of 0.598 square kilometers. Thus in all flooded areas; the mean percentage of the flooded area varies from 80.9 percent at Odah, 65.7 percent at Iwhreotah, 75.2 percent at Erorin in 2011. While in 2012, at Odah, 79.3 percent represent the mean of the flooded portion, 72.1 percent at Iwhreotah and 71.3 percent at Erorin. This implies that a large proportion of the farmlands are flooded. The length of the storm water varies from four days to three months on the land. Based on the level of the flood water, in 2011, Odah quarter with a mean yield of 67.3 kilograms suffered a mean loss of 32.2 kilograms. At Iwhreotah, mean yields of 84 kilograms with a loss of 38.8 kilogram of all cultivated crops were recorded. Also in 2011 at Erorin quarter, the mean estimated yield was 85.9 kilograms with a loss of 42.7 kilograms due to storm water flooding. In 2012, at Odah quarter, an estimated yield of 85.7 kg was recorded with a mean loss of 45.3 kilograms. At Iwhreotah in 2012, 82.8 kilograms (mean) of all cultivated crops were recorded with a mean loss of 44.9 kilograms. Also, at Erorin, in 2012, the mean estimated yield was 87.9 kilograms while a mean value of 46.1 kilogram was recorded as loss due to the prevalence of flood water on crops cultivated (Tables 1-5). 6.2. Impact of flooding on cultivated crops.
Cassava: In 2011and 2012, cassava cultivated in the farms at Odah, Iwhreotah and Erorin quarters covered a total land area of 5.39 square kilometers with a mean value of 0.898 square kilometers. A total area of 2.75 square kilometers was flooded with a mean value of 0.458 square kilometers representing 78.5 percent. The depth of the flood water was 34.33 centimeters (mean). The storm water remained on farmland for a period of 5 days to 2 weeks resulting in the loss of 828 kilograms from an estimated yield of 1530 kilograms with a mean value of 138 kg and 255kg respectively (Table 1 and Figure 3).
| Zone | Sample point | Length Km | Flooded portion Km | Percentage of total length | Depth in cm | Periodicity | Category | Crop cultivated | Crop yield Kg | Crop loss Kg | Percentage loss |
|---|---|---|---|---|---|---|---|---|---|---|---|
| Odah | 2011 A |
1.48 | 0.76 | 80 | 28 | 5 days to 2 weeks | Seasonal | Cassava | 200 | 80 | 40 |
| Odah | 2012 A | 1.02 | 0.46 | 85 | 49 | 5 days to 2 weeks | “ | Cassava | 250 | 138 | 55.2 |
| Iwhre-otah | 2011 A |
0.49 | 0.24 | 68 | 24 | 5 days to 2 weeks | “ | Cassava | 250 | 100 | 40 |
| “ | 2012 A |
0.60 | 0.47 | 86 | 56 | 5 days to 2 weeks | “ | Cassava | 250 | 180 | 72 |
| Erorin | 2011 A |
0.90 | 0.25 | 80 | 27 | 7 days to 2 weeks | “ | Cassava | 300 | 160 | 53.3 |
| “ | 2012 A |
0.90 | 0.57 | 72 | 22 | 1 week to 2 months | “ | Cassava | 280 | 170 | 60.7 |
| - | Total | 5.39 | 2.75 | 471 | 206 | - | - | - | 1530 | 828 | 321.2 |
| - |  |
0.898 | 0.458 | 78.5 | 34.33 | - | - | - | 255 | 138 | 53.5 |
Table 1: Mean distribution of the flooded farmlands by Cassava (2011 and 2012).
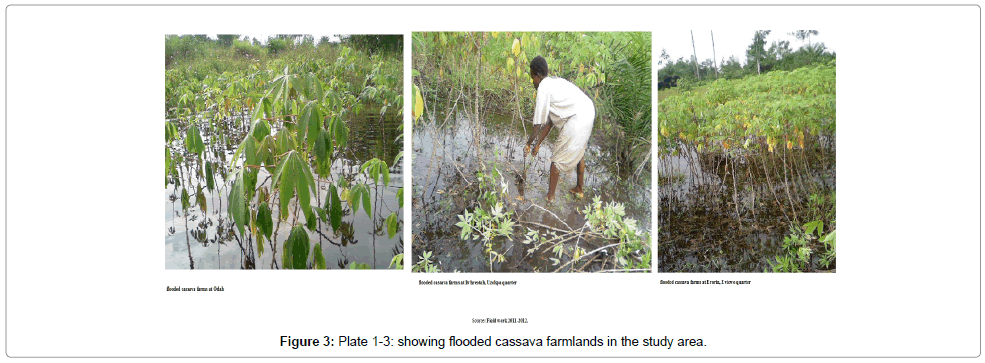
Figure 3: Plate 1-3: showing flooded cassava farmlands in the study area.
Melon: Melon was cultivated in 5.75 square kilometers of farmlands at Odah, Iwhreotah and Erorin quarters, with a mean of 0.958 square kilometers. Flood water covered an area of 3.43 kilometers with an average of 0.571 square kilometers, representing 69.3 percent of the cultivated farmlands. The depth of the flood water was 32.6 centimeters for a period of 4 days to 2 months. The total yield of melon for the year 2011 and 2012 was 396 kilograms, with a mean value of 66 kilograms. The loss as a result of the flood water was 206 kilogram with a mean value of 34.3 kilograms. The percentage loss was 52.6 percent of the total yield of melon (Table 2).
| Zone | Sample point | length Km | Flooded portion Km | Percent age of total length | Depth in cm | Periodicity | Category | Crop cultivated | Crop yield Kg | Crop yield loss Kg | Percentage loss |
|---|---|---|---|---|---|---|---|---|---|---|---|
| Odah | 2011 B |
0.80 | 0.28 | 75 | 33 | 4 days to 2 months | Seasonal | Melon | 50 | 30 | 60 |
| “ | 2012 B | 1.05 | 0.48 | 75 | 43 | 6 days to 3 months | “ | Melon | 80 | 40 | 50 |
| Iwhre-otah | 2011 B |
0.75 | 0.66 | 68 | 10 | 4 days to 2 months | “ | Melon | 60 | 35 | 58.3 |
| “ | 2012 B |
0.75 | 0.66 | 68 | 48 | 4 days to 2 months | “ | Melon | 68 | 38 | 55.8 |
| Erorin | 2011 B |
1.20 | 0.69 | 65 | 24 | 4 days to 2 months | “ | Melon | 70 | 25 | 35.7 |
| “ | 2012 B |
1.20 | 0.66 | 65 | 38 | 4 days to 2 months | “ | Melon | 68 | 38 | 55.8 |
| - | Total | 5.75 | 3.43 | 416 | 196 | - | - | - | 396 | 206 | 315.6 |
| - | |
0.958 | 0.571 | 69.3 | 32.6 | - | - | - | 66 | 34.3 | 52.6 |
Table 2: Mean distribution of the flooded farmlands by Melon (2011 and 2012).
Yam: In Odah, Iwhreotah and Erorin farmlands, yam is cultivated in about 4.66 square kilometers of land with an average of 0.776 square kilometers for the year 2011 and 2012. 3.4 square kilometers with a mean of 0.566 square kilometers was flooded representing 75.3 percent of the cultivated land. The depth of the flood water was 31 centimeters which remained on the farmlands for a period of 4 days to 2 months. The estimated yield of yam in the sampled area was 995 kilograms with a mean value of 166 square kilograms. An estimated loss of 466 kilograms was recorded due to storm water. The average loss was 78 kilograms. The estimated loss represents 46.9 percent of the total yam loss due to flooding (Table 3).
| Zone | Sample point | length Km | Flooded portion Km | Percentage of total length | Depth in cm | Periodicity | Category | Crop cultivated | Crop yield Kg | Crop yield loss Kg | Percent age loss |
|---|---|---|---|---|---|---|---|---|---|---|---|
| Odah | 2011 C |
0.75 | 0.66 | 78 | 15 | 5 days to 2 weeks | Seasonal | Yam | 150 | 75 | 50 |
| “ | 2012 C | 0.74 | 0.63 | 85 | 52 | 4 days to 2 months | “ | Yam | 180 | 76 | 42.2 |
| Iwhre-otah | 2011 C |
0.57 | 0.32 | 39 | 20 | 5 days to 2 weeks | “ | Yam | 180 | 80 | 44.4 |
| “ | 2012 C |
0.64 | 0.53 | 78 | 39 | 5 days to 2 weeks | “ | Yam | 165 | 85 | 51.5 |
| Erorin | 2011 C |
0.98 | 0.63 | 86 | 30 | 5 days to 2 weeks | “ | Yam | 150 | 66 | 44 |
| “ | 2012 C |
0.98 | 0.63 | 86 | 30 | 7 days to 4 weeks | “ | Yam | 170 | 84 | 49.4 |
| - | Total | 4.66 | 3.4 | 452 | 186 | - | - | - | 995 | 466 | 281.5 |
| - | |
0.776 | 0.566 | 75.3 | 31 | - | - | - | 165.8 | 77.66 | 46.9 |
Table 3: Mean distribution of the flooded farmlands by Yam (2011 and 2012).
Maize: Maize, a staple crop in Oleh is cultivated in about 4.56 square kilometers of farmlands at Odah, Iwhreotah and Erorin quarters. A total of 3.15 square kilometers with a mean of 0.525 square kilometers is flooded during heavy rains. This represents 91 percent of the total maize farmlands. The flood water remains on the land surface for a period of 1 week to 3 months with a depth of 27 centimeters. The estimated yield of maize for 2011 and 2012 was 444 kilograms with a mean of 74 kilograms. 235 kilogram is lost due to seasonal flooding that occurred in 2011 and 2012. The percentage loss was 54 percent. This implies that 54 percent of the total maize cultivated in the three quarters for year 2011and 2012 was lost to seasonal flooding (Table 4).
| Zone | Sample point farm | length Km | Flooded portion Km | Percent age of total length | Depth in cm | Periodicity | Category | Crop cultivated | Crop yield Kg | Crop yield loss Kg | Percent age loss |
|---|---|---|---|---|---|---|---|---|---|---|---|
| Odah | 2011 D |
1.00 | 0.65 | 92 | 13 | 1 week to 2 months | Seasonal | Maize | 60 | 35 | 58 |
| “ | 2012 D | 0.84 | 0.35 | 86 | 67 | 3 weeks to 3 months | “ | Maize | 69 | 42 | 60.86 |
| Iwhre-otah | 2011 D |
0.67 | 0.46 | 87 | 23 | 2 weeks to 2 months | “ | Maize | 75 | 35 | 46.66 |
| “ | 2012 D |
0.67 | 0.46 | 87 | 23 | 1 week to 2 months | “ | Maize | 70 | 45 | 64.28 |
| Erorin | 2011 D |
0.69 | 0.58 | 96 | 17 | 1 week to 2 months | “ | Maize | 80 | 38 | 47.5 |
| “ | 2012 D |
0.69 | 0.65 | 98 | 19 | 1 week to 2 months | “ | Maize | 90 | 40 | 44.4 |
| - | Total | 4.56 | 3.15 | 546 | 162 | - | - | - | 444 | 235 | 322 |
| - | |
0.76 | 0.525 | 91 | 27 | - | - | - | 74 | 39 | 54 |
Table 4: Mean distribution of the flooded farmlands by Maize (2011 and 2012).
Plantain: At Odah, Iwhreotah and Erorin quarters, a total of 4.11 square kilometers of farmlands were cultivated with plantain. Of this length, a total of 2.58 square kilometers suffered from annual flooding. This represents a total of 79.5 percent of the cultivated land. The period of the flood was from 2 weeks to 3 months covering a depth of 30.16 centimeters. The plantain yield for the two years was 420 kilograms. 233 kilograms representing 54.7 percent was lost due to the seasonal flooding (Table 5).
| Zone | Sample point farm | length Km | Flooded portion Km | Percentage of total length | Depth in cm | Periodicity | Category | Crop cultivated | Crop yield Kg | Crop yield loss Kg | Percent age loss |
|---|---|---|---|---|---|---|---|---|---|---|---|
| Odah | 2011 E |
0.57 | 0.32 | 72 | 34 | 2 weeks to 3 months | Seasonal | Plantain | 60 | 36 | 60 |
| “ | 2012 E | 1.50 | 0.47 | 86 | 21 | 2 weeks to 2 months | “ | Plantain | 50 | 32 | 64 |
| Iwhre-otah | 2011 E |
0.29 | 0.57 | 94 | 15 | 2 weeks to 3 months | “ | Plantain | 90 | 42 | 46.6 |
| “ | 2012 E |
0.44 | 0.24 | 65 | 45 | 2 weeks to 3 months | “ | Plantain | 80 | 34 | 42.5 |
| Erorin | 2011 E |
0.74 | 0.66 | 88 | 32 | 2 weeks to 3 months | “ | Plantain | 80 | 43 | 53.75 |
| “ | 2012 E |
0.57 | 0.32 | 72 | 34 | 2 weeks to 3 months | “ | Plantain | 60 | 36 | 60 |
| - | Total | 4.11 | 2.58 | 477 | 181 | - | - | - | 420 | 223 | 328 |
| - | |
0.685 | 0.43 | 79.5 | 30.16 | - | - | - | 70 | 37.16 | 54.7 |
The implication of this is that more than half of the yield from plantain is lost to flooding. Flooding is therefore a menace to cultivated crops in the area.
Table 5: Mean distribution of the flooded farm lands by Plantain (2011 and 2012).
The multiple regression analysis was used to test the hypothesis, “which states that crops yield is not significantly dependent on flooding” (Table 6).
| Model | R | R Square | Adjusted R Square | Std. Error of the Estimate |
|---|---|---|---|---|
| 1 | 0.888(a) | 0.789 | 0.551 | 15.37178 |
Table 6: Model Summary of regression analysis between flood and crop yield in Oleh.
From Table 6, 0.89 correlation value was observed, indicating that crop yield is strongly dependent on inundation level. This shows that the yield of crops in Oleh is 79% depended on flood. However the individual standardized beta coefficient of the various yield of crops with inundation rate, indicate inverse relationship (Table 6). This shows that as inundation increases, the yield of crop decreases (Table 7). Thus since the F value (3.321) is greater than the table value (3.23) (Table 5), thus, the stated hypothesis is rejected, alternatively the yield of crops is significantly depended on the rate of flood in Oleh (Table 8).
| Models | Unstandardized Coefficients | Standardized Coefficients | T | Sig. | |
|---|---|---|---|---|---|
| B | Std. Error | Beta | B | Std. Error | |
| (Constant) | 188.596 | 101.459 | 1.859 | 0.100 | |
| Cassava | 0.095 | 0.160 | -0.643 | 0.590 | 0.572 |
| Melon | -2.432 | 1.370 | -1.007 | -1.775 | 0.114 |
| Maize | -0.083 | 0.048 | -0.878 | -1.724 | 0.123 |
| Yam | -0.024 | 0.138 | -0.665 | -0.176 | 0.865 |
| Plantain | -0.224 | 0.128 | -0.650 | -0.176 | 0.865 |
Table 7: Standardized correlation coefficients.
| Model | Sum of Squares | df | Mean Square | F | Table F value | Remark |
|---|---|---|---|---|---|---|
| Regression | 7062.397 | 9 | 784.711 | 3.321 | 3.23 | |
| Residual | 1890.332 | 8 | 236.292 | Significant effect Exist | ||
| Total | 8952.729 | 17 |
Dependent Variable: Flood.
Table 8: ANOVA.
Conclusion/Recommendation
The study revealed that all the food crops cultivated by the inhabitants of Odah, Iwhreotah and Erorin quarters are affected by flooding. The results of the analyzed data showed satisfactory impact of flooding on crop yield in the area. Efforts should be made, such as the avoidance of flood plain and the introduction of water-resistant species to withstand the effects of flooding in the area. We recommend that fast growing and quick yielding species of plants be introduced in the area. Thus, annual crops which have low maturing period be introduced to farmers. These crops will take a short time to grow and mature faster within a short period of time. Based on the high rate of flooding in the farmlands, flood resistant crops are introduced in the area. These crops would be able to withstand excess amount of water available to them. The ridge and furrow method of farming be introduced. The ridge will be used to plant the crops, while the furrow acts as a check to the excess water found on the farmland. There should be channelization of excess water found on the farmlands to the available streams and rivers in the area. This will help solve or minimize the effects of flooding on the land surface in the area.
References
- Adigun FO, Abolade O, Yusuf AA (2013) Incidence of Flood and its impacts: Empirical evidence from Ajeromi-Ifelodun, Lagos State, Nigeria. Int J Inn Res Studies 2: 239-254.
- Oriola EO (2000) Flooding and Flooding Management in HI Jimoh and IP Ifabiyi. Contemporary Issues in Environment Studies, Ilorin, Haytee Press and Publishing Co Limited, Nigeria.
- Magbagbeola I (2002) Environmental Underdevelopment of the Niger Delta: An Eclectic view. The Petroleum Industry, Economy and the Niger-Delta Environment 32-40.
- Faniran A, Jeje LK (1983) Humid Tropical Geomorphology: A Study of the Geomorphological Processes and Landforms in Warm Humid Climates, London, Longman Group Limited, London, England.
- Akintola FO (1966) Flood problems in Ibadan, Western Nigeria. The Niger Geogr J 9: 17-25.
- Odemerho FO (1988) Urban Flood Problems. Environmental Issues and Management in Nigeria Development, Evans Brothers, Ibadan, UK.
- Omiunu FG (1988) Flooding and Traffic Management in Benin City Region. Environmental Issues and Management in Nigeria Development, Evans Brothers, Ibadan, UK.
- Efe SI (2007) Urban Flooding in Abraka, Delta State, Nigeria. J Environ Conserv Res 1: 96-103.
- Ojeh VN, Ugboma P (2012) Flood hazards in Urban Niger Delta: A Case Study of Abraka Town. Int J Environ Engg Res 1: 23-29.
- Odemerho FO (1992) Land degradation impacts on tropical agricultural basins and their management: the Nigerian examples. Geoforum 23: 499-506.
Citation: Ojeh VN, Victor-Orivoh AF (2014) Natural Hazard and Crop Yield in Oleh, South-South Nigeria: Flooding in Perspective. J Earth Sci Clim Change 5: 181. DOI: 10.4172/2157-7617.1000181
Copyright: ©2014 Ojeh VN, et al. This is an open-access article distributed under the terms of the Creative Commons Attribution License, which permits unrestricted use, distribution, and reproduction in any medium, provided the original author and source are credited.
Select your language of interest to view the total content in your interested language
Share This Article
Recommended Journals
Open Access Journals
Article Tools
Article Usage
- Total views: 17845
- [From(publication date): 2-2014 - Aug 19, 2025]
- Breakdown by view type
- HTML page views: 13098
- PDF downloads: 4747