Research Article Open Access
Objective Assessment of Joint Stiffness: A Clinically Oriented Hardware and Software Device with an Application to the Shoulder Joint
| Kevin McQuade*, Robert Price, Nelson Liu and Marcia A Ciol | |
| Department of Rehabilitation Medicine, University of Washington, Seattle, WA, USA | |
| Corresponding Author : | Kevin McQuade Department of Rehabilitation Medicine University of Washington, Seattle, WA, USA E-mail: kmcquade@u.washington.edu |
| Received July 16, 2012; Accepted August 27, 2012; Published August 30, 2012 | |
| Citation: McQuade K, Price K, Liu N, Ciol MA (2012) Objective Assessment of Joint Stiffness: A Clinically Oriented Hardware and Software Device with an Application to the Shoulder Joint. J Nov Physiother 2:122. doi: 10.4172/2165- 7025.1000122 | |
| Copyright: © 2012 McQuade K, et al. This is an open-access article distributed under the terms of the Creative Commons Attribution License, which permits unrestricted use, distribution, and reproduction in any medium, provided the original author and source are credited. | |
Visit for more related articles at Journal of Novel Physiotherapies
Abstract
Examination of articular joints is largely based on subjective assessment of the “end-feel” of the joint in response to manually applied forces at different joint orientations. This technical report aims to describe the development of an objective method to examine joints in general, with specific application to the shoulder, and suitable for clinical use. We adapted existing hardware and developed laptop-based software to objectively record the force/displacement behavior of the glenohumeral joint during three common manual joint examination tests with the arm in six positions. An electromagnetic tracking system recorded three-dimensional positions of sensors attached to a clinician examiner and a patient. A hand-held force transducer recorded manually applied translational forces. The force and joint displacement were time-synchronized and the joint stiffness was calculated as a quantitative representation of the joint “end-feel.” A methodology and specific system checks were developed to enhance clinical testing reproducibility and precision. The device and testing protocol were tested on 31 subjects (15 with healthy shoulders, and 16 with a variety of shoulder impairments). Results describe the stiffness responses, and demonstrate the feasibility of using the device and methods in clinical settings.
| Keywords |
| Joint biomechanics; Mobilization; Clinical laxity testing; Shoulder joint; Joint stability; Manual examination; Stiffness |
| Introduction |
| Manual examination and treatments of synovial joints involve the application of direct external force to opposing sections of articulating joints. The goal is to assess the joint’s compliance or laxity, and the level of resistance to the imposed force. The clinical terminology applied to this subjective assessment is typically referred to as an “endfeel” assessment [1]. Various adjectives have been used to describe the subjective “end-feel” including but not limited to: “springy”, “leathery”, “hard”, “soft” and “bony”. |
| The displacements resulting from the applied forces depend on the tissue properties, state of muscular activation of muscles crossing the joint, and the magnitude and rate of change of the applied force. Stiffness is defined by the relationship between the applied force and the resulting displacement, combining information about both force and displacement into one measure. Consider a spring exhibiting a linear force-displacement response. The stiffness of a spring (k) is defined by Hooke’s law, DF=-k(DX), where the displacement of a spring (DX) is proportional to the change in applied force applied (DF) and is governed by the spring’s inherent stiffness (k). Rewritten, the stiffness k=-DF/DX reflects the slope of the force-displacement relationship. In this respect, stiffness is a perfect descriptor of the mechanical behavior during clinical joint testing. The various clinical descriptors of “endfeel” are thus quantified by stiffness or its mathematical inversecompliance. |
| To date, examination of mechanical behavior of joints is largely a subjective process. A decade ago, Maitland and Kawchuck [2] suggested necessary elements toward quantification of “end-feel.” The authors suggested that the 2nd derivative of the force-displacement curve was the most likely biomechanical property to correlate with diagnostic criteria. This quantity characterizes the change in stiffness (Dk), which increases at “end-feel.” Until recently, however, the techniques for obtaining this information were not clinically available or feasible. The development of quantitative examination and treatment tools for use in manual therapy is just emerging, with no devices in common practice. Even simple muscle strength testing using hand-held dynamometers, which can significantly increase objective muscle strength assessments compared to the more subjective poor-fair-good scale [3], is not in common practice [4-8]. The only joint force/displacement measuring device readily used in clinical settings is limited to use on the knee for a single directional displacement (KT-2000, MedMetric Corp, San Diego, CA). A glenohumeral joint laxity and stiffness device is commercially available (LigMaster, Sports Tech, Charlottesville, VA), but this is also restricted to a single plane test and is a computerized apparatus that does not allow clinician input. |
| Attempts at objective assessment of joint laxity and stiffness have received considerable attention and have included simulated spinal models to assess anterior/posterior manual mobilization variability [9], devices to measure ankle joint laxity [10], and ankle stiffness [11] and cadaver studies at the shoulder joint [12]. Because of the degree of mobility and instability related problems with the shoulder joint, there have been several attempts to devise measurements of shoulder stability. McQuade et al. [13] measured stiffness in subjects with normal shoulders using magnetic tracking sensors, and a force transducer with subjects’ arms placed in a surgical positioner (McConnell Orthopedic Mfg. Greenville, TX). They calculated stiffness response to anterior and posterior stability tests with the arm in multiple positions to report normal stiffness profiles as a function of shoulder position. Borsa et al. [14] used a similar technique using magnetic sensors, and a force transducer on normal subjects sitting in a specially constructed chair with the subject’s arm fixed in neutral rotation with slight abduction. Crawford and Sauers [15] studied glenohumeral joint laxity and stiffness in the throwing position in 22 asymptomatic high school baseball pitchers using a commercially available computerized stress device (LigMaster, Sports Tech, Charlottesville,VA). The arm was placed in a three-point loading jig featuring a manual turn screw pressure applicator that gradually applies pressure to the joint. It works primarily by creating a bending moment at the joint due to the reaction forces at the proximal and distal fixed points resulting in a gaping of the joint. The force and the displacement are input into a computer program. In their review of techniques for laxity testing at the shoulder, Bahk et al. [16] concluded that instrumented devices for measuring shoulder translation require more research before their precise role in the evaluation of patients can be defined. |
| The majority of the early work has been done on healthy young subjects and has assessed only passive contributions to joint stiffness. Some studies have however looked at the muscular activation influence on joint stiffness. Huxel et al. [17] measured stiffness as defined by resistance (torque) to imposed arm internal rotation at different levels of internal rotation and different levels of isometric muscular activation. They concluded that moderate levels of muscle activation significantly increase rotational stiffness. They did not measure the direct translational stiffness assessed during clinical examination however. McQuade and Murthi [18] assessed the role of the muscle activation in modulating translational glenohumeral stiffness. They measured glenohumeral translational stiffness during a clinically applied anterior stability test with the arm in 90 degrees of abduction in combination with internal, external, or neutral humeral rotation. Subjects isometrically contracted toward internal rotation with two different load levels. Only a mild load (approximately 25% of the mean maximum voluntary isometric strength) was required to significantly increase the stiffness in the normal shoulder. McQuade and Murthi were the first of the instrumented studies to attempt to allow the clinician to perform the tests as they do clinically. All other studies required special equipment and the tests were applied in a controlled but less clinically practical way. If instrumented tests are to be accepted by clinicians, they must be performed in a clinically friendly way, that is, a way that does not require the clinician to radically alter his/her technique. Software must be helpful, easy and intuitive to use, and yield direct real-time feedback. While there are inherent limitations and issues with the approach allowing the clinician to do the tests with less experimental control, we believe that it is a reasonable goal to develop devices or protocols that allow clinicians to perform manual tests as close as possible to how they are trained to perform them. The purpose of this developmental and exploratory project was two-fold: |
| 1) To develop a clinically friendly method to quantify joint stiffness with special application to the shoulder, but with generic potential for use with any peripheral joint and |
| 2) To pilot the approach with a small group of patients with diverse shoulder impairments to establish method feasibility and to compare the stiffness responses to a group of individuals with normal healthy shoulders. Our specific aim was to progress the development of a clinically friendly objective joint assessment system. |
| Methods |
| Hardware development |
| A commercially available compact and portable two-sensor magnetic tracking system (Patriot, Polhemus, Colchester VT) was used to track humeral translations. The sensors are capable of tracking threedimensional positions of two sensors relative to a base transmitter that is within a distance of up to 1.5 m from the sensors. Sensor accuracy is 1.5 mm and the sample rate is 60 Hz. The laptop computer interface was established by using a low cost National Instruments (Austin TX) multifunction USB data acquisition unit with eight analog input channels. |
| For force measurement, we tested several prototypes beginning with a pneumatic pressure bladder that was form fit to the palm of the hand and linked to an electronic pressure monitor. Although the design avoided transmission of unwanted shear loads by the examiner, in test trials there was continued difficulty with leakage and calibration instability. The approach finally adopted was a capacitive load cell with a 22.68 kg (50 lb) capacity (iLoad Mini MFM-050-100S, Loadstar, Fremont, CA). For details specifications of the load cell the reader is referred to: http://www.loadstarsensors.com/lc004-miniature-loadcell- iload-mini.html. The compressive load cell was 6.35 mm thick with a diameter of 31.75 mm. |
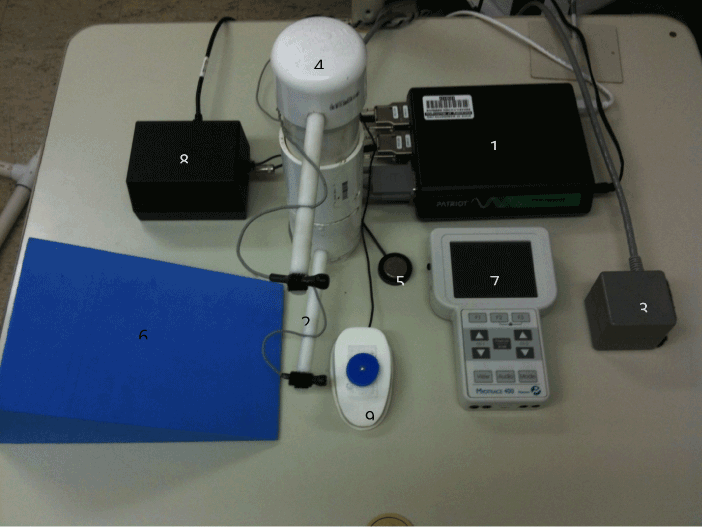
| Hand interface: In order to enable the clinician to apply forces close to standard clinical techniques we designed several thermoplastic prototype hand interfaces to house both the force transducer and one tracking sensor comfortably in the palm of the clinician’s hand. Besides the palm, the interface could also be moved toward the fingertips depending on the test technique used. Our final interface consisted of a carbon fiber hand-held unit with the embedded force transducer and an attachment point for a small magnetic tracking sensor. The complete system (Figure 1) could be transported in a small backpack which included: The Patriot tracker with sensors and transmitter, a spring calibration plunger, a foot switch controller, a hard foam wedge for scapular support and positioning, a two-channel surface EMG unit for muscular activation level feedback, the USB analog to digital converter, and a laptop computer. |
| Software development |
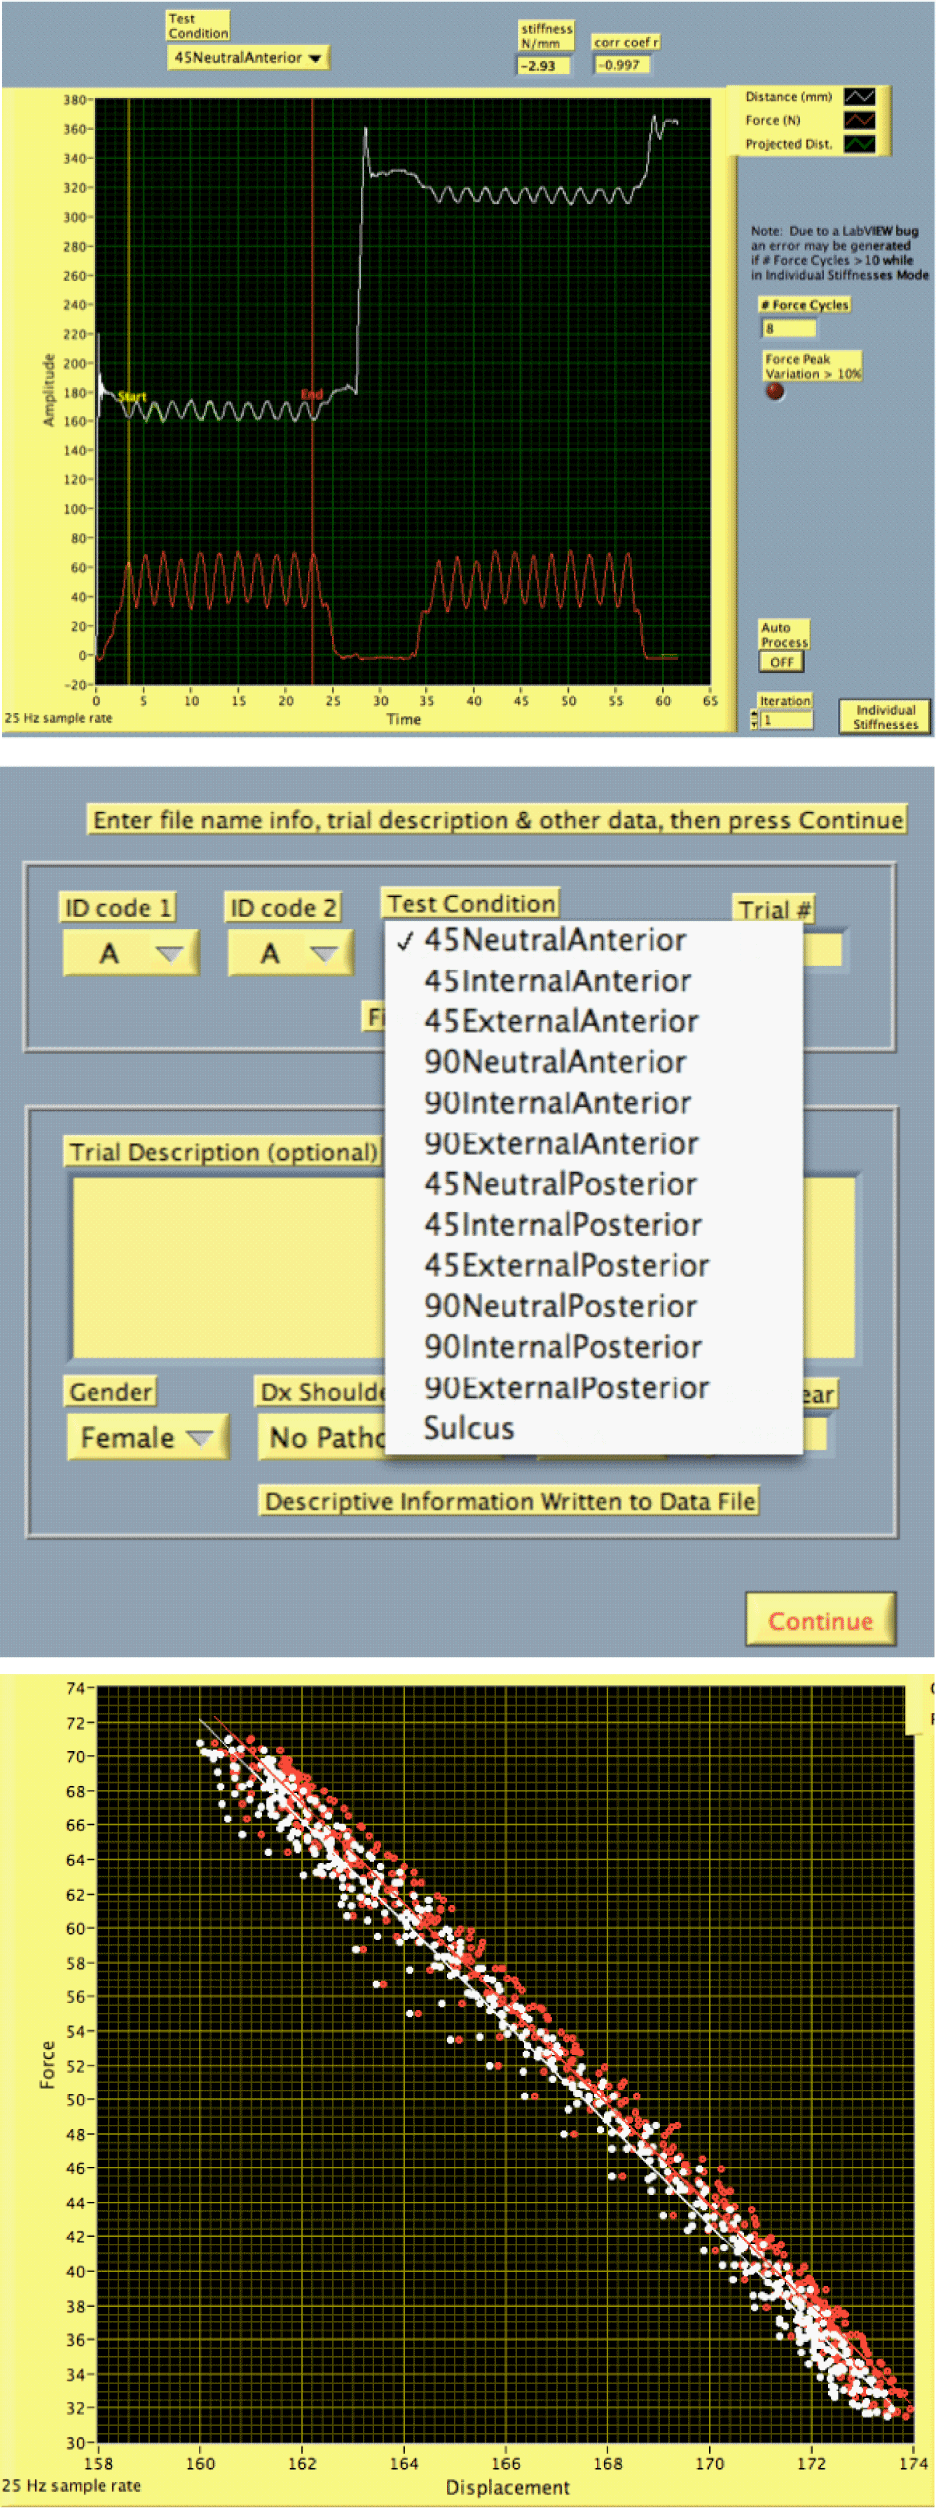
| National Instruments LabVIEW development platform was used to design a graphical software interface to run on an Apple MacBook Pro laptop running Microsoft Windows XP, either natively or in emulation under Parallels Desktop® (http://www.parallels.com). The software requirements included: controls to support consistent data collection, clinician feedback on test performance, calibration routines, clinical test choice via pull-down menus, and data processing and export capabilities. The software had to be point and click with no complex user requirements. The final software features included an audible metronome to ensure consistent rate of applied loads, threshold settings for force to ensure reproducible force magnitude application with multiple trials, and options for viewing individual load displacement curves or averaging multiple sets when performing several mobilization compressions. |
| Figures 2a-2c show screen shots of the basic software interface (2a) basic graphical user interface showing raw data visualized in real time, (2b) using pull-down menus for test selection, (2c) raw force displacement relationships for several repetitions of one test combined. |
| Stiffness calculation |
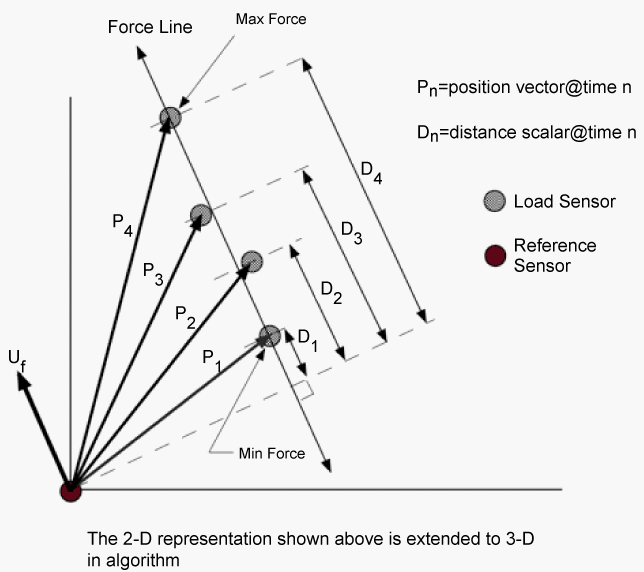
| Overall stiffness is computed as the average slope of the force versus displacement relationship. The displacement is computed between two sensors along the line of action of the force (Figure 3). The displacement magnitude (a scalar) derives from the difference between position vectors along the applied force line. Two points within the selected data range determine the line of action of the force: the position vector at the time of maximum force application, and the position vector at the time of maximum force application. The difference between these two position vectors represents the line of action of the force. When the line of action of the force is co-linear with the position vector, the stiffness is simply the change in force divided by the change in distance. In general, these are not co-linear and a correction must be applied. It is not always possible to place the reference position sensor in such a way that the load position sensor (on the hand-held interface) moves directly toward or away from the reference sensor (on the shoulder) during load application. The projection of the position vector onto the line of action of the force provides the necessary correction to obtain the appropriate displacement. The corrected distance is computed as the dot (scalar) product of the position vector and the unit vector of the line of action of the force (which provides the force direction). The higher the degree of co-linearity between the position vector and line of action of the force, the less correction is required to obtain the appropriate displacement. |
| Full curve stiffness versus terminal or end-range stiffness |
| Stiffness from the beginning of joint motion will involve significant artifact from the compression of soft-tissue (i.e., taking up of “slack”). We considered two methods to address this problem. One method is to compress tissue against a rigid support to prevent any joint displacement and determine only the soft tissue compression. This requires additional set-up time and procedures and is still dependent on the magnitude of the force. The second method is simply to calculate the end-range stiffness using a conservative limit of the last 25% of the load of the load-displacement curve. A similar method was used in a previous study [18] in which initial soft tissue displacement contributed up to about 40-50% of the total displacement; this supports our 25% terminal force range as a reasonable representation of the “end-feel” of the joint stiffness. |
| Calibration |
| a simple load calibration can be performed at the beginning of the test where the clinician performs a series of compressions against a spring of known stiffness, which is housed inside a sliding tube (Figures 1,4) to which sensors are attached to track displacement. The known spring stiffness is compared to stiffness calculated by the software and the load cell calibration is adjusted as needed. To further validate the spring stiffness we compressed the spring unit centered on a Kistler forceplate (Kistler Instrument Corp, Amherst, NY ,USA) to confirm the spring linearity and coherence with the load cell values which showed excellent correlation (Pearson r=0.99). |
| Criterion validation of displacement sensors |
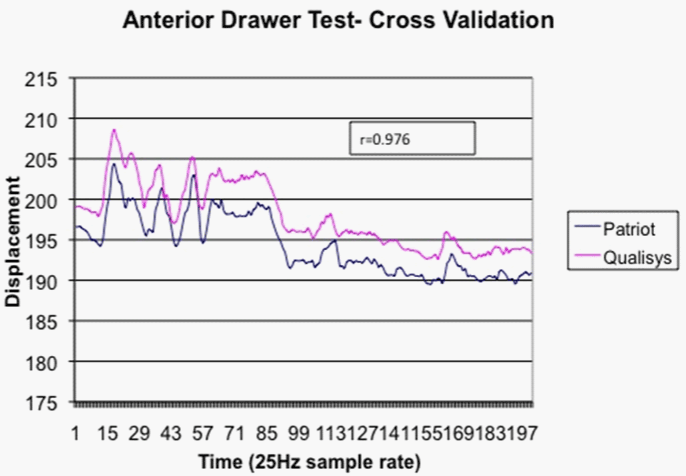
| The magnetic tracking position data were compared to data captured simultaneously using a six-camera motion capture system (Qualisys North America, Inc. Deerfield, IL). Several reflective markers were placed on the scapula, humerus and adjacent to the magnetic tracking sensors of an asymptomatic subject. Anterior and posterior drawer testing was performed with the arm abducted to 90 degrees. The relative Cartesian coordinate positions from the motion capture markers were compared to the positions measured by the magnetic trackers. The Pearson correlation between the camera marker based displacement and the magnetic trackers was 0.976, indicating strong criterion-based measurement validity. A positioning offset exists since the reflective markers are physically offset from the magnetic sensors (Figure 4). |
| Clinical pilot testing |
| The study procedures and informed consent form were reviewed and approved by an institutional review board for the protection of human subjects. Thirty-one subjects were recruited to test our methods using three common shoulder stability examination tests: (1) Anterior draw test, (2) Posterior draw test, and (3) Sulcus test. Two groups of individuals were recruited; a group of patients (n=16) with a wide range of shoulder impairments resulting in decreased range of motion (ROM) at the shoulder, and a group of comparable participants (n=15) with no history of shoulder problems (control group). Inclusion criteria for the patients included: age 18-65 years, currently or recently seen for physical therapy evaluation and treatment of unilateral restricted range of motion of the shoulder (defined as a decrease of at least 20 degrees in any plane of motion). Patients were excluded if they had an unstable shoulder, were in an acute post-surgical immobilized phase, or had a shoulder problem of non-orthopaedic nature or related to a systemic disease. The intent was to recruit a sample with a wide range of shoulder ROM limiting conditions. Healthy volunteer inclusion criteria included: age 18-65 years, no self-reported history of shoulder impairments, and normal ROM, strength, and function of the shoulder. Individuals were recruited by direct flyer advertisement, emails to local clinics, and direct word of mouth. |
| Testing protocol and procedures |
| Before testing, subjects completed informed consent documents and were screened by a physical therapist to evaluate functional ROM, strength, and pain levels. All subjects completed the University of Washington Simple Shoulder Test (SST) questionnaire consisting of 12 items of functional ability [19]. A total of 13 tests were performed using two arm abduction angles (45 & 90 degrees), three humeral rotation positions (neutral, internal, and external), two directions of applied force (anterior and posterior), and one clinical test that applies an axially directed distal force (Sulcus test) which essentially causes an inferior translation (inferior drawer test). All test configurations were randomized to avoid any order effect. The maximum pain free humeral rotations tolerated by each subject were used. The total time requirement was approximately one hour, which included: explanation of the study, informed consent signing, screening exam, and completing the functional survey, and stiffness testing. The actual stiffness testing took about 20 minutes per shoulder. |
| A minimum of 5 repetitions of each test movement (anterior or posterior translation) was performed in each position by a single examiner. The examiner was an Orthopedic Certified Specialist (OCS) physical therapist with 5 years of clinical experience. Two software biofeedback features were implemented to improve the examiner’s testing consistency. First, the examiner performed clinical endfeel testing using audible metronome feedback (rate of 1.5 Hz) to standardize the rate of force application, thus minimizing viscoelastic time-dependent effects. Second, if there was more than a 10% variation in the peak force applied in the series of five repetitions, the examiner was prompted with a second audio signal to repeat the test to assure reliable force application. In addition, a second experimenter could observe the real-time force and displacement responses to check for any unusual data responses such as slips or other artifacts. |
| A general procedure for a one position test is outlined in the box below using a force/counter-force approach, with one hand of the clinician used for stabilization, and the other acting as the instrumented movement hand to apply focal glide movements in specific movement planes, with the limb at specific joint angles. |
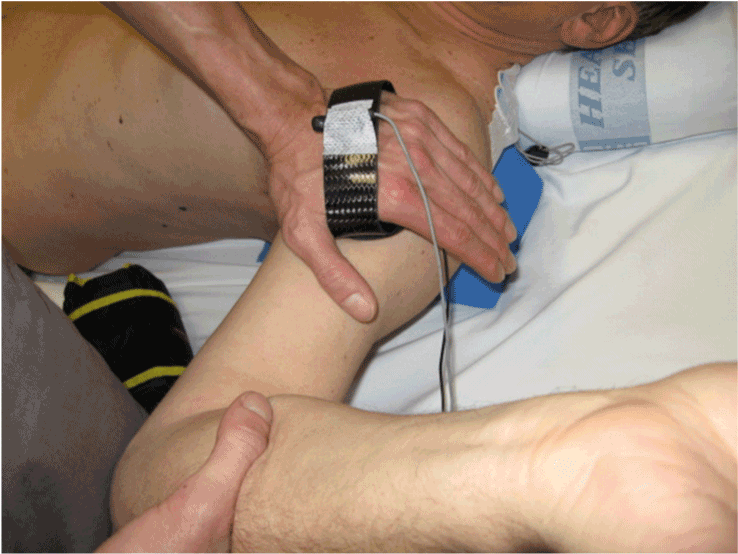
| Example procedures: Posterior translation of the glenohumeral joint with the upper arm in abduction, and external rotation. (90EP) (Figure 5) |
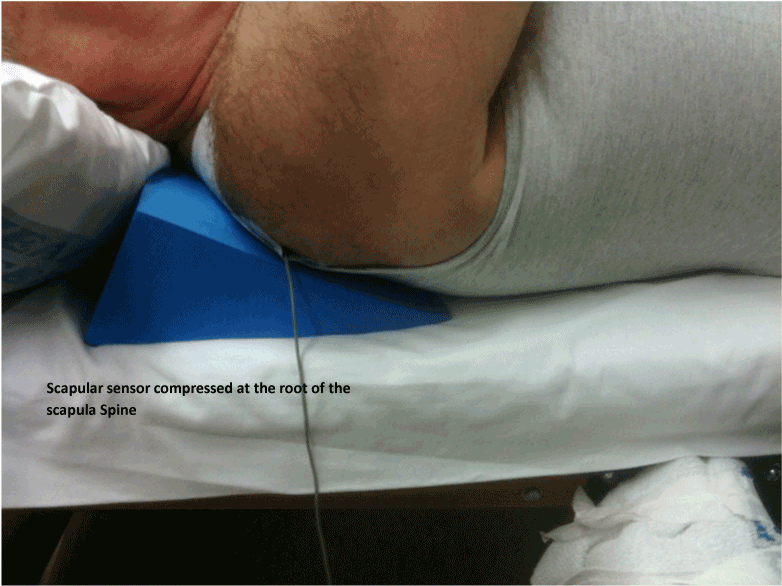
| 1. One sensor is attached to the hand-held clinical force transducer device and one sensor is attached to the scapula at the triangular apex of the root of the spine of the scapula and the medial boarder (Figure 6 and Figure 5 inset). (Palpation of this area reveals a natural fossa where the sensor can be securely attached with adhesive tape). |
| 2. One surface mounted EMG electrode is attached to the upper trapezius of the test side to be used as relaxation biofeedback. |
| 3. The subject is positioned supine on an exam table with the test arm located toward the edge of the table. |
| 4. Hard foam wedges are placed behind the subject’s scapula to create a firm stabilization for the scapula. |
| 5. The clinician holds the mini force transducer in his force application hand, which also contains a motion sensor. (Figure 7) The instrumented hand is placed as close as possible to the glenohumeral joint. The opposite hand applies a stabilizing force to the scapula depending on the specific direction of the applied force. |
| 6. Joint tissue is pre-conditioned (to improve consistency of the tissue response to mechanical loading [20]). |
| 7. The differential position (i.e. displacement) between the two sensors during application of the technique is recorded in the direction of the applied force as described above. |
| 8. Clinician performs a minimum of 5 repetitions of specific test. |
| 9. After one shoulder test sequence is completed, the contra-lateral joint is tested for comparison using the same sequence. |
| Data analysis and processing |
| Force and displacement data were collected at 25 Hz (to provide near real-time data feedback to the examiner) and low pass filtered at 5 Hz using an 8th order Butterworth filter. The end range stiffness was calculated using the last quartile of the entire load displacement response (end-range) as described above. The range of the data used to calculate the stiffness for each trial had to meet two additional criteria for acceptance. First, there had to be a minimum of three repetitions with force variations no greater than 10%; second, a correlation coefficient exceeding 0.87 for the linear slope estimate was required to accept the trial. These criteria facilitated confidence in the examiner’s test technique. |
| The mean end-range stiffness for each test position was exported as a tab delimited file and imported into SPSS for Mac, version 18, which was utilized for all the statistical analysis. Descriptive statistics were calculated for all variables boxplots were created to display the data. Since this study is a preliminary assessment of the feasibility and capability of the newly developed objective shoulder assessment system, confirmatory hypothesis tests are not appropriate for our aims. |
| Results |
| Among patients, there were 4 males and 12 females, while among controls there were 7 males and 8 females. The mean age of the patients was 56yrs (SD=6.5, median=50, range=45-65) and 49yrs (SD=11.4, median=50, range=26-62) for the controls. Table 1 shows the number and types of diagnoses for the patients. |
| Because this study was developmental and exploratory in aim, we included subjects with a wide variety of shoulder impairments. These impairments included rotator cuff tears, tendonitis, adhesive capsulitis, and generalized shoulder stiffness. While this added to the overall sample variability, it provided insights on the use and limitations of our testing protocol with different patients. All patients completed a self-report survey (Simple Shoulder Test (SST)) on shoulder pain and function. The mean score was 6 (out of 12) indicating the average patient considered their pain and functional ability to be about 50% of full-unrestricted function. |
| End range stiffness |
| Table 2 presents the mean, median, standard deviation and range of stiffness calculated for each test position. For the controls, the condition with the highest stiffness was the posterior draw test with the arm in 90 degrees of abduction and neutral rotation followed by an internally rotated position with the arm in 45 degrees of abduction. For the patients the highest stiffness occurred also during posterior draw testing with the arm in 90 degrees of abduction externally rotated. In all cases, posterior draw testing, which presumably stresses the posterior capsule of the joint, was stiffer than forces theoretically directed to the anterior capsule. Overall the most compliant test position for both the patients and the controls was the position of 45 degrees abduction with the arm in internal rotation. |
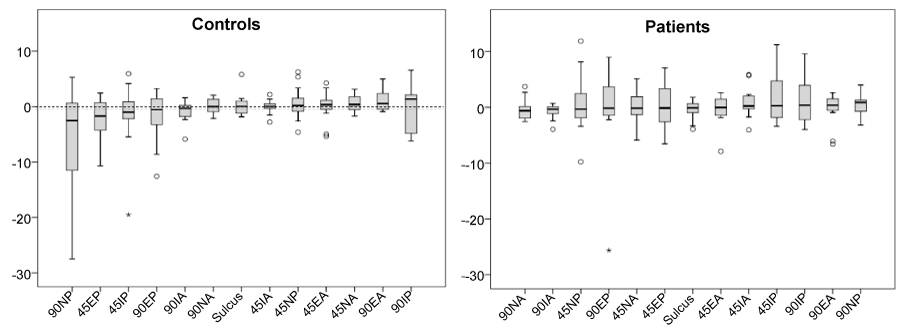
| A general sense of the symmetry is illustrated in the boxplot (Figure 8), which shows the distribution of the difference in stiffness between the involved and uninvolved shoulders of the patients and between the left and right arms for the controls. Zero indicates no difference between sides. Certain tests appeared to elicit greater differences between the sides. For the patients the majority of the test positions showed increased stiffness on the involved side. For controls the interpretations is less meaningful because there is no a-priori assumptions or knowledge about left or right dominance. |
| Discussion |
| Subject testing |
| We tested our device on subjects with and without shoulder impairments with the shoulder placed in seven different test orientations. Overall, these preliminary data suggest that even in persons with no history of shoulder problems the stiffness symmetry (difference between left and right shoulders) appears to be quite variable. The symmetry also depends on the specific test orientation and direction of applied loads. For controls the 90NP position (90 Deg. abduction, Neutral rotation, and Posterior force) elicited the greatest difference between shoulders, while in the patients the 45IP position (45 Deg. abduction, internally rotated, posterior force) elicited the greatest difference. |
| Our results suggest that it is feasible to quantify shoulder stiffness from clinically applied passive shoulder tests using a hand held force transducer and magnetic tracking sensors. Our method allows the clinician to perform the tests in a manner similar to the way they are trained. However, to ensure consistent measures, clinicians will need to be trained to observe some key factors. First they need to apply force with a consistent rate due to the viscoelastic velocity-dependent properties of biological tissue. We used an audible metronome to control this velocity. Second they need to apply the force as perpendicular to the humerus as possible to avoid any additional compressive loading across the joint. The protocol has an additional didactic application. Because it provides the clinician with direct real-time feedback, it could be used for teaching techniques of manual examination and mobilization. Our system is generic in that it can be used with any joint assessment or muscle function test. For example, we have used our device in our Doctoral of Physical Therapy (DPT) program for anterior cruciate ligament stiffness examination as part of teaching labs. |
| Software usability |
| The International society for standardization (ISO) (http://www. iso.org/iso/home.html) defines usability as “The extent to which a product can be used by specified users to achieve specified goals with effectiveness, efficiency, and satisfaction in a specified context of use”. While it is difficult to quantify all of the parameters of usability, we believe our hardware and software approach was quite usable for clinical as well as for teaching applications. At this stage, the device development is not without challenges however. Principally, the process currently requires two operators, one to record and operate the computer and one to perform the testing; this is not always possible in clinical settings. Further refinements may allow single-person operation using foot switches, wireless transducers and improved automation of the software. Other usability refinement may include a tablet computer (e. g., iPad) interface. |
| Conclusions |
| We have developed and tested a system and protocol to quantify displacement and stiffness responses to manual applications of force at the shoulder joint using techniques that clinicians commonly perform. With minor modifications this approach can be used for other joints and for objective biofeedback-based teaching. We are currently developing testing protocols that will be used to assess patients with genetic hypermobility syndrome. Future modifications include incorporating angular displacement and torque measures, wirelessbased technology, and iPad-based computing platforms. |
| Further studies will need to be performed to determine the best positions, orientations, and test directions that will be clinically relevant when using the device. It is possible that a composite overall stiffness score could be developed and used for comparing people with different conditions or to assess clinical interventions. |
| Acknowledgements |
| This project was funded by a grant through the National Center for Complimentary and Alternative Medicine, National Institutes of Health, Bethesda, MD, USA R21 AT004161. |
References
- Hertling D, Kessler R (1996) Management of Common Musculoskeletal Disorders: Physical Therapy Principles and Methods. (3rd edn), Lippincott, Philadelphia
- Maitland, M. and G. Kawchuk (1997) Towards the quantification of end-feel for the assessment of passive joint motion. Phys Ther Rev 2: 217-226.
- Williams M (1956) Manual muscle testing, development and current use. Phys Ther Rev 36: 797-805.
- MacDermid JC, Michlovitz SL (2006) Examination of the elbow: linking diagnosis, prognosis, and outcomes as a framework for maximizing therapy interventions. J Hand Ther 19: 82-97.
- Descarreaux M, Dugas C, Lalanne K, Vincelette M, Normand MC (2006) Learning spinal manipulation: the importance of augmented feedback relating to various kinetic parameters. Spine J 6: 138-145.
- van den Beld WA, van der Sanden GA, Sengers RC, Verbeek AL, Gabre√?¬ęls FJ (2006) Validity and reproducibility of hand-held dynamometry in children aged 4-11 years. J Rehabil Med 38: 57-64.
- Ladeira CE, Hess LW, Galin BM, Fradera S, Harkness MA (2005) Validation of an abdominal muscle strength test with dynamometry. J Strength Cond Res 19: 925-930.
- Bohannon RW (2005) Manual muscle testing: does it meet the standards of an adequate screening test? Clin Rehabil 19: 662-667.
- Simmonds MJ, Kumar S, Lechelt E (1995) Use of a spinal model to quantify the forces and motion that occur during therapists' tests of spinal motion. Phys Ther 75: 212-222.
- Kerkhoffs GM, Blankevoort L, van Dijk CN (2005) A measurement device for anterior laxity of the ankle joint complex. Clin Biomech (Bristol, Avon) 20: 218-222.
- Kobayashi T, Leung AK, Akazawa Y, Tanaka M, Hutchins SW (2010) Quantitative measurement of spastic ankle joint stiffness using a manual device: a preliminary study. J Biomech 43: 1831-1834.
- Hsu AT, Ho L, Chang JH, Chang GL, Hedman T (2002) Characterization of tissue resistance during a dorsally directed translational mobilization of the glenohumeral joint. Arch Phys Med Rehabil 83: 360-366.
- McQuade KJ, Shelley I, Cvitkovic J (1999) Patterns of stiffness during clinical examination of the glenohumeral joint. Clin Biomech (Bristol, Avon) 14: 620-627.
- Borsa PA, Sauers EL, Herling DE, Manzour WF (2001) In vivo quantification of capsular end-point in the nonimpaired glenohumeral joint using an instrumented measurement system. J Orthop Sports Phys Ther 31: 419-426.
- Crawford SD, Sauers EL (2006) Glenohumeral Joint Laxity and Stiffness in the Functional Throwing Position of High School Baseball Pitchers. J Athl Train 41: 52-59.
- Bahk M, Keyurapan E, Tasaki A, Sauers EL, McFarland EG (2007) Laxity testing of the shoulder: a review. Am J Sports Med 35: 131-144.
- Huxel KC, Swanik CB, Swanik KA, Bartolozzi AR, Hillstrom HJ, et al. (2008) Stiffness regulation and muscle-recruitment strategies of the shoulder in response to external rotation perturbations. J Bone Joint Surg Am 90: 154-162.
- McQuade KJ, Murthi AM (2004) Anterior glenohumeral force/translation behavior with and without rotator cuff contraction during clinical stability testing. Clin Biomech (Bristol, Avon) 19: 10-15.
- Godfrey J, Hamman R, Lowenstein S, Briggs K, Kocher M (2007) Reliability, validity, and responsiveness of the simple shoulder test: psychometric properties by age and injury type. J Shoulder Elbow Surg 16: 260-267.
- Schatzmann L, Brunner P, St√?¬§ubli HU (1998) Effect of cyclic preconditioning on tensile properties of human quadriceps tendons and patellar ligaments. Knee Surg Sports Traumatol Arthrosc 6: 56-61.
Tables and Figures at a glance
| Table 1 | Table 2 |
Figures at a glance
 |
 |
 |
 |
| Figure 1 | Figure 2 | Figure 3 | Figure 4 |
 |
 |
 |
 |
| Figure 5 | Figure 6 | Figure 7 | Figure 8 |
Relevant Topics
- Electrical stimulation
- High Intensity Exercise
- Muscle Movements
- Musculoskeletal Physical Therapy
- Musculoskeletal Physiotherapy
- Neurophysiotherapy
- Neuroplasticity
- Neuropsychiatric drugs
- Physical Activity
- Physical Fitness
- Physical Medicine
- Physical Therapy
- Precision Rehabilitation
- Scapular Mobilization
- Sleep Disorders
- Sports and Physical Activity
- Sports Physical Therapy
Recommended Journals
Article Tools
Article Usage
- Total views: 6902
- [From(publication date):
November-2012 - Aug 29, 2025] - Breakdown by view type
- HTML page views : 2223
- PDF downloads : 4679
