Research Article Open Access
Occupational Health Promotion Using Online Visual Representation on Internet for Consultation
Tsair-Wei Chien1 and Weir-Sen Lin2*1Administration Department, Chi Mei Medical Center, Taiwan
2Department of Hospital and Health Care Administration, Chia-Nan University of Pharmacy and Science, Tainan, Taiwan
- *Corresponding Author:
- Weir-Sen Lin
Department of Hospital and Health Care Administration
Chia-Nan University of Pharmacy and Science
Tainan, Taiwan
E-mail: weirsen@mail.chna.edu.tw
Received date: July 29, 2013; Accepted date: August 19, 2013; Published date: August 22, 2013
Citation: Chien TW, Lin WS (2013) Occupational Health Promotion Using Online Visual Representation on Internet for Consultation. Occup Med Health Aff 1:130. doi: 10.4172/2329-6879.1000130
Copyright: © 2013 Chien TW, et al. This is an open-access article distributed under the terms of the Creative Commons Attribution License, which permits unrestricted use, distribution, and reproduction in any medium, provided the original author and source are credited.
Visit for more related articles at Occupational Medicine & Health Affairs
Abstract
Objective: To show an on-line visual representation to a mental health related Doctor for consultation and to compute the prevalence rate of work strain for a workplace. Methods: Exploration factor analysis and parallel analysis were used to validate the items retained in the Chinese-version of the Job-Content Questionnaire (C-JCQ). The setting was a 900-bed hospital in southern Taiwan. A total of 1,800 full-time workers in this hospital were asked to participate in a job perception survey in May 2009. One way analysis of variance (ANOVA) was applied to analyze the differences in work strain among work sections. A visual representation of the C-JCQ findings was then prepared to provide practitioners with a tool for use in clinical settings. Results: The prevalence rate of hospital workers’ strain in the study workplace was 13.26%. There were significant differences among work sections on most C-JCQ subscales. Conclusions: Periodical surveys of the quality of work life with the C-JCQ are urgently needed. A visual representation of C-JCQ findings could be made available to highlight the need for mental health consultation in clinical settings.
Keywords
Visual representation; Mental health; ANOVA
Introduction
The evolution of the quality of work life (QWL) began in the late 1960s, emphasizing the human dimensions of work by focusing on the quality of the relationship between the workers and working environment [1]. With the increasing concern about job stress on workers, many researchers [2-4] have addressed psychosocial job stress and its adverse effects on health. The topic of occupational stress currently thus receives considerable research attention and is an important issue of occupational health from a QWL perspective.
Many studies that adopt different scales report the prevalence of work-related stress among workers in various workplaces [5-9]. However, it is difficult to compare these rates of job strain prevalence each other because using different job stress scales and definitions. Among many job stress scales, the Job Content Questionnaire (shorten for JCQ) developed by Karasek [10,11] is ultimately famous in the world. The JCQ is one of the leading theoretical work-related stress models, which is applicable to all jobs and all workers for predicting job related stress and coronary heart disease [9,10,12] and for studying work motivation, job satisfaction, absenteeism, and labour turnover [10,13,14] besides adopted by many epidemiological studies to measure general work content [5]. There are so many language translation versions of JCQ shown at http://www.jcqcenter.org/Translations.html, including the Chinese C-JCQ [15] that was used in this study.
In the demand-control model, workplace stress is a function of job demand and decision latitude. Job demands represent the psychological stressors in the work environment, and decision latitude refers to employees’ control over their tasks and how those tasks are wholly executed by their own willingness. Four types of jobs are classified: (a) passive (low latitude and low demand), (b) active (high latitude and high demand), (c) high strain (low latitude and high demand), and (d) low strain (high latitude and low demand) [9,10]. High strain jobs are the most likely to cause adverse psychological reactions and directly associated with the computation of the prevalence rate of work strain in a workplace [9,10,12].
Primary care providers have high expectations for how online programs or instructions should deliver services to patients and fit into the clinical workflow [15]. It is interesting to depict a diagram incorporated with the above mentioned four quadrants to provide clinical practitioners for employee’s job stress consultation.
Objectives
This study aimed (1) to present an on-line visual representation to a mental health related Doctor for consultation, (2) to show the prevalence rate of work strain in a workplace, and (3) to analyze the difference of employee’s job stress among work sections using C-JCQ assessment.
Materials and Methods
Study sample
The setting was a 900-bed hospital in southern Taiwan. A total of 1,823 full-time workers in the studied hospital participated in a job perception survey with the 3-point 22-item C-JCQ in May of 2009. Several demographic features including age, work tenure, job type, marital status, employment status, and education level were required to respond. There are 4 items with a reverse scoring response according to respondent’s perception from 0 (strongly disagree) to 3 (strongly agree).
Without further follow-up prompts to respondents, a total of 1,257 employees completed the C-JCQ (return rate=68.95%). One hundred fifteen participants were excluded because they did not provide information on age, gender, had not worked for more than three months, were part time workers, or did not answer all of the C-JCQ 22 items (i.e., missed any one of the 22 items). As a result, the responses of 1,124 workers (62.64% of 1,823) were analyzed (Table 1). This study was approved by Taiwan Chi-Mei Hospital Review Board.
| Male | Female | Total | Statistical | |||
| Variable | Mean | SD | Mean | SD | ||
| Age (years) | 33.23 | 5.79 | 29.1 | 4.32 | t=9.65*** | |
| Work tenure (years) | 5 | 4 | 3.9 | 3.3 | t=3.45** | |
| N | % | N | % | |||
| Proportion for gender | 120 | 10.68 | 1004 | 89.32 | 1124 | χ2=909.62*** |
| Age (Average years) | χ2=52.98*** | |||||
| 1.21~30 | 33 | 5.5 | 567 | 94.5 | 600 | |
| 2.31~45 | 80 | 15.69 | 430 | 84.31 | 510 | |
| 3.46~60 | 7 | 50 | 7 | 50 | 14 | |
| Work tenure | χ2=12.07** | |||||
| 1. Within 1 year | 6 | 10.71 | 50 | 89.29 | 56 | |
| 2.1-39 | 33 | 7.48 | 408 | 92.52 | 441 | |
| 3.3.1-10 | 65 | 11.95 | 479 | 88.05 | 544 | |
| 4.>10 | 16 | 19.28 | 67 | 80.72 | 83 | |
| Job type | χ2=26511*** | |||||
| 1.Administration staff | 65 | 26 | 185 | 74 | 250 | |
| 2.Technician | 24 | 19.67 | 98 | 80.33 | 122 | |
| 3.Nurse | 10 | 1.38 | 715 | 98.62 | 725 | |
| 4.Physician | 21 | 77.78 | 6 | 22.22 | 27 | |
| Marital status | χ2=22.79*** | |||||
| 1.Single | 60 | 7.91 | 699 | 92.09 | 759 | |
| 2.Married | 60 | 17.29 | 287 | 82.71 | 347 | |
| 3.Widowed/Separated/ Divorced | 0 | 8 | 100 | 8 | ||
| Employment status | χ2=1.11 | |||||
| 1. Managers/administrators | 19 | 13.77 | 119 | 86.23 | 138 | |
| 2. Low-skilled staff | 98 | 10.37 | 848 | 89.63 | 946 | |
| Education level | χ2=36.83*** | |||||
| 1. Senior high school | 4 | 18.18 | 18 | 81.82 | 22 | |
| 2. College | 22 | 6.43 | 320 | 93.57 | 342 | |
| 3.University | 76 | 10.76 | 630 | 89.24 | 706 | |
| 4.Graduate school | 18 | 33.33 | 36 | 66.67 | 54 | |
| *p<0.05; **p<0.01; ***p<0.001 | ||||||
Table 1: Demographic characteristics and work conditions of the study population (n = 1,124).
22-item C-JCQ scale
The C-JCQ was used with permission from the author [16]. It consists of 22 three-point Likert items (0 = strongly disagree, 1 = disagree, 2 =agree, 3 = strongly agree) on five subscales: skill job discretion (six items), decision authority (three items), psychological job demand (five items), supervisor support (four items), and coworker support (four items) [16]. The latter two subscales are referred to workplace support (WPS). Firstly, we converted the reverse scoring responses into monotonically increasing sequence. Secondly, the summation score (X) ratio (p) to the totally maximum score for each subscale was created by the formula of p = X/(3 × L), where L stands for item length of the subscale. Lastly, to represent job strain exposure in a graphical plot (i.e., the above mentioned four quadrants), we transformed the summation score ratio (p) to a coordinate position with the formula of p* = (p - 0.5) × 8, where 0.5 (=1.5/3) is yielded by computing the ratio of scoring median in the range between 0 and 3 (=1.5) to the upper scale score (=3). The value of p* is in a range between -4 and 4 on the respective horizontal (Y) or vertical (X) axles. For instance, the subscale of 5-item psychological job demand can produce a coordinate score of -1.36 (i.e., p*= (0.33-0.5) × 8 = -1.36) when p=5/(3 × 5)=0.33 in case the summation score equals to 5.
Data analysis
Scale dimension and reliability: When a set of items is designed to measure the same construct (e.g., quality of work life), item scores are often summed to represent the level of the construct. This summation method assumes that all items contribute equally to the construct and that all items are substantially related to the common construct. Otherwise, the summation score is meaningless and the assumptions are problematic [17].
The exploratory factor analysis is often used to examine whether items measure a common construct in social science. In tradition, we adopt Kaiser [18] eigenvalue greater than one or Cattell [19] scree plot to determine the number of factors (domains or dimensions). From empirical research results, parallel analysis (PA) [20] is one of the most accurate ways to determine the number of factors [21,22]. KMO (Kaiser-Meyer-Olkin) and Bartlett Sphericity test are used to examine whether the scale is appropriate for conducting the exploratory factor analysis. The reliability of a scale (i.e., Cronbach’s α) is then to report whether it is greater than 0.7.
Calculating the prevalence rate of work strain in a workplace: The ratio of the explosion number in quadrant IV (high strain, low latitude and high demand) to the surveyed sample size in the diagram of four quadrants constructed by Karasek et al. [10,11] demandcontrol model is applied to calculate the prevalence rate of work strain in a workplace [9]. It is worth noting that the high-rank employees in quadrant I (active, high latitude and high demand) are excluded from the computation of the work strain prevalence rate.
Analyzing the difference of employee’s job stress among work sections: One way analysis of variance (ANOVA) was applied to analyze the differences in work strain among work sections. We considered differences to be significant at the p <.05 level.
Programming an on-line visual representation to Doctors for consultation: ASP (Application Service Provider) language was used to programming an on-line visual representation of C-JCQ diagnosis designed to provide practitioners for use in clinical settings. The scatter plot that constructs the diagram of four quadrants according Karasek et al. [10,11] demand-control model is shown to readers. In which, an asterisk representing the job stress coordinate position of a specific examinee is labeled on the diagram. A # signal to stand for WPS [supervisor support in the vertical (X) axle and coworker support in the horizontal (Y) axle] in the plot. The number of examinees is shown for each spot (e.g., 1 for 1, A for 10, and F for 15, etc.). The diagram is expected to provide mental health-related Doctors with on-focus information for worker consultation in job stress.
Statistical analysis: We used SPSS version 15 (IBM Corporation, Somers, NY, USA) for analysis and plotting. MS-Excel-VBA (visual basic for application) module was programmed to plot the PA [20] approach for determining the number of factors.
Results
Demographics
Full data sets were available for 1,124 employees in four job types of Doctor, nurse, technician, and administrator. Among them, nonmanagerial workers account for 84.07%. Nurses account for 64.50 %. A 2-sample t test in gender was performed to determine that there was a significant difference between groups with respect to the mean of age and work tenure. Chi-square tests showed that significant differences were found in association between groups of gender and variables instead of employment status in Table 1.
The exploratory factor analysis
There are 5 factors extracted from the 22-item C-JCQ by the PA approach shown in Figure 1. KMO (=0.876) and Bartlett Sphericity test (p==0.000) verified that the C-JCQ is appropriate for conducting the exploratory factor analysis. The explained variance accounts for 58% in these 5 factors. The least reliability (0.57) is decision authority (DA). The highest (0.88) is supervisor support (SS). The reliability less than the criterion of 0.70 in DA is ascribed to the reason of short item length with 3 items. However, all of item factor loading in DA are above 0.70, indicating that DA is acceptable for measurement.
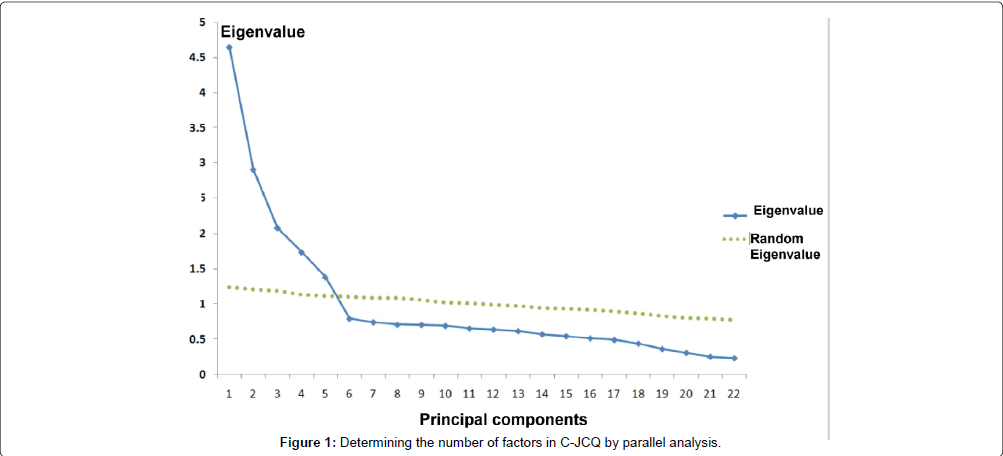
Figure 1: Determining the number of factors in C-JCQ by parallel analysis.
Calculating the prevalence rate of work strain in a workplace
According Karasek et al. [9,10] classification that combines skill job discretion (SD) and decision authority (DA) together and forms a Decision Latitude (DL), Through which, DL with psychological job demand (PD) that can be plotted in a diagram of the four quadrants [9,10]. Accordingly, we performed the exploratory factor analysis once again using these 14 items with eigenvalues of 3.12 (= 1.74+1.38) and 2.90 in Table 2 in 9-item DL and 5-item PD, respectively, to examine whether SD and DA can be combined as an acceptable DL domain. After conducting the factor analysis, we found that the factor loadings of DL and PD are in a range of 0.35-0.65 and 0.72-0.78, respectively, indicating that SD and DA can be combined as DL domain shown in Figure 2.
| Items (3-point subscale) | Factor loading | Cronbach's | |||||
| (From strongly disagree to strongly agree) | 1 | 2 | 3 | 4 | 5 | Alpha | |
| DL | SD: Skill job discretion | ||||||
| 1. My job requires that I learn new things | 0.64 | 0.73 | |||||
| 2.* My job involves a lot of repetitive work | 0.6 | ||||||
| 3. My job requires me to be creative | 0.62 | ||||||
| 5. My job requires a high level of skill | 0.68 | ||||||
| 7. I get to do a variety of different things in my job | 0.63 | ||||||
| 9. I have an opportunity to develop my own | 0.67 | ||||||
| DA: Decision authority | |||||||
| 4. My job allows me to make a lot of decisions | 0.7 | 0.57 | |||||
| 6. * On my job, I have very little freedom to … | 0.71 | ||||||
| 8. My job allows me to make a lot of decisions. | 0.76 | ||||||
| PD | PD: Psychological job demand | ||||||
| 10.* My job requires working very quickly | 0.72 | 0.81 | |||||
| 11.* My job requires working very hard | 0.73 | ||||||
| 12. I am not asked to do an excessive amount of work | 0.76 | ||||||
| 13. I have enough time to get the job done | 0.75 | ||||||
| 14. I am free of conflicting demands that others make | 0.78 | ||||||
| WS1 | SS: Supervisor support | ||||||
| 15. My boss is concerned about the welfare of us | 0.81 | 0.88 | |||||
| 16. My boss pays attention to what I am saying | 0.82 | ||||||
| 17. My supervisor is helpful in getting the job done | 0.88 | ||||||
| 18. My boss gets people to work together well | 0.79 | ||||||
| CS: Coworker support | |||||||
| 19. People I work with take a personal interest in me | 0.63 | 0.84 | |||||
| 20. People I work with take a personal interest in me | 0.86 | ||||||
| 21. People I work with are friendly | 0.88 | ||||||
| 22. When needed, my colleagues will help me | 0.81 | ||||||
| Pre-rotated eigenvalue | 4.65 | 2.9 | 2.08 | 1.74 | 1.38 | ||
| Cumulative variance (%) | 21.1 | 34 | 43.8 | 51.7 | 58 | ||
| Post- rotated eigenvalue | 2.92 | 2.9 | 2.74 | 2.6 | 1.63 | ||
| Cumulative variance (%) | 13.3 | 26 | 38.8 | 50.6 | 58 | ||
Table 2: Domain checking for Decision Latitude L(C-JCQ) by EFA.
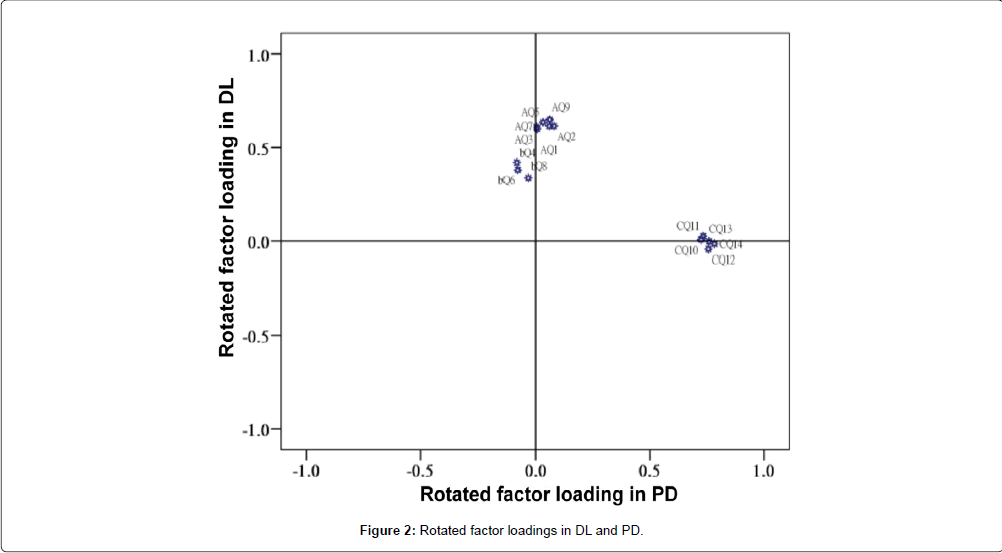
Figure 2: Rotated factor loadings in DL and PD.
The examinee summation score ratio (p) to a coordinate position with the formula of p* = (p - 0.5) × 8 can be transformed and scattered in a plot (Figure 3). The prevalence rate of work strain in a workplace is 13.26% (=149/1,124).
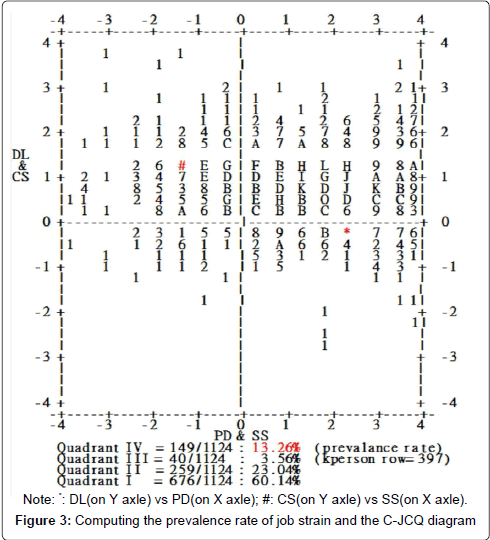
Figure 3: Computing the prevalence rate of job strain and the C-JCQ diagram
Analyzing the difference of employee’s job stress among work sections
It can be seen in Table 3 that there are significant differences in SD, PD, and CS among job types. Post hoc Scheffé test shows that administrators earn higher satisfaction in CS but lower in SD and PD than other job types. In contrast, nurses gain higher satisfaction in SD and PD and lower in CS than others.
| Subscale | n | Mean | Difference | F-ratio |
| (p<0.05) | Prob. | |||
| SD: | 11.098 | |||
| (1) Adm. staff | 250 | 6.60 | (2)(3) | p< 0.001 |
| (2) Technician | 122 | 7.16 | (1) | |
| (3) Nurse | 725 | 7.21 | (1) | |
| (4) Physician | 27 | 7.38 | ||
| DA: | 0.0602 | |||
| (1) Adm. staff | 250 | 5.92 | p = 0.981 | |
| (2) Technician | 122 | 5.96 | ||
| (3) Nurse | 725 | 5.97 | ||
| (4) Physician | 27 | 6.02 | ||
| PD: | 11.318 | |||
| (1) Adm. staff | 250 | 6.60 | (3) | p< 0.001 |
| (2) Technician | 122 | 6.79 | (3) | |
| (3) Nurse | 725 | 7.62 | (1)(2) | |
| (4)Physician | 27 | 6.82 | ||
| SS: | 0.818 | |||
| (1)Adm. staff | 250 | 7.34 | p = 0.484 | |
| (2)Technician | 122 | 7.17 | ||
| (3) Nurse | 725 | 7.38 | ||
| (4)Physician | 27 | 7.69 | ||
| CS: | 2.862 | |||
| (1)Adm. staff | 250 | 8.01 | (3) | p = 0.036 |
| (2)Technician | 122 | 7.82 | ||
| (3) Nurse | 725 | 7.70 | (1) | |
| (4)Physician | 27 | 7.91 | ||
Table 3: ANOVA in the comparison of groups on subscales.
Programming an on-line visual representation to Doctors for consultation
An on-line visual representation was plotted in Figure 3 with two axles of PD and DL (at http://www.healthup.org.tw/scater/output_scater.asp) to show the examinee job stress with asterisk signal. In addition, SS and CS to coordinate WPS were jointly positioned with the # signal. We can see that the examinee job content is located in quadrant IV on the right-side bottom (high strain, low latitude and high demand). However, the WPS is at the upper-left-side quadrant II that indicates supervisor support is substantially insufficient. The diagram can provide mental health-related Doctors focusing on a small area for worker consultation in job stress.
Discussion
We found that (1) the prevalence rate of hospital workers’ strain in the study workplace was 13.26%; (2) there were significant differences among work sections on most C-JCQ subscales. Administrators earn higher satisfaction in CS but lower in SD and PD than other job types. In contrast, nurses gain higher satisfaction in SD and PD and lower in CS than others; (3) a visual representation of C-JCQ findings could be made available to highlight the need for mental health consultation in clinical settings.
There are 5 factors that can be extracted in the 22-item C-JCQ questionnaire. However, the SD and DA can be combined as a DL domain shown in Figure 2, indicating that SD and DA have a higher correlation in contrast to PD. Accordingly; DL can be incorporated with PD plotted in a diagram of the four quadrants shown in Figure 3. It is congruent with the two subscale analysis of Karasek et al. [9,10] to highlight the coordination of the job stress and stain for a workplace, and meant that the visual representation of C-JCQ findings could be made available for mental health consultation in clinical settings.
For instance illustrated for an examinee in Figure 3, the * signal was located at quadrant IV in the area of high strain (low latitude and high demand) accounting for 13.26% to the study sample size, which means that the examinee suffers from somewhat high strain but not substantial due to closing to the central. We further refer to the # signal located at quadrant II with a low supervisor support and high coworker support. The mental health consultant should focus more suggestions and efforts to the examinee on upgrading supervisor support in the workplace.
Limitations and directions
Chi-square tests showed that significant differences were found in association between groups of gender and variables instead of employment status in Table 1. It can be seen in Table 3 that there are significant differences in SD, PD, and CS among job types. Administrators earn higher satisfaction in CS but lower in SD and PD than other job types. In contrast, nurses gain higher satisfaction in SD and PD and lower in CS than others. Nevertheless, those findings cannot be generalized to other kinds of workplaces in Taiwan or around the world because it is difficult to compare these rates of job strain prevalence each other because using different job stress scales and definitions [5-9]. The C-JCQ diagram can be applied to other workplaces and availably made in comparison with the job strain prevalence rate (e.g., 13.26% in this study) to each other (e.g., 21% in Malaysian office workers [9]) when the JCQ is adopted in any other languages (referred to websites at http://www.jcqcenter.org/Translations.html).
Implication and further studies
The reliabilities of Cronbach’s α are 0.73, 0.57, 0.81, 0.88 and 0.84, respectively for each subscales in Table 3, somewhat different from the previous study (α = 0.71, 0.69, 0.55, 0.86 and 0.86) [16] using the C-JCQ in Taiwan. The least reliability of subscales in this study is the DA (0.57), different from that the PD (0.55) in the study of Cheng et al. [16]. The reasons can be ascribed to (1) different workplaces(hospital versus telecommunication company) with different sample variances leading to different Cronbach’s α; (2) less item length(e.g., the DA with 3 items); and (3) different semantic meaning and understanding of words to specific items in the translated C-JCQ. When referring to the factor loadings of items beyond 0.70 in the DA subscale in Table 2, we make sure that each item earns a high correlation with the construct of latent train entity. The reliability can be increased to 0.70 when the item length reaches to 4 (similar to the subscales of SS and CS) according to the Spearman-Brown prediction formula, new item length= original 3 items × 1.228=0.7 × (1-0.57)/(0.57 × (1-0.57)).
Another issue is regarding to the summation scores for each subscale that all items should be assumed measuring a common construct and all endorsed responses are interval instead of ordinal scores. Even if 5 factors were extracted from the C-JCQ in Table 2 and Figure 1 and the SD and DA can be combined together to form a common entity (DL) shown in Figure 2, the C-JCQ is constructed with 3-point ordinal scores. Stevens [23] addressed that “In fact, psychologists often use scales that are ordinal. Strictly speaking, each statistics related to the mean or standard deviation of data cannot be assumed to be interval because the requirement for a scale using ordinal scores is not sufficient in measurement”. Unfortunately, the alert claimed by Stevens seems not to be noted. In practice, many researches still commonly consider the ordinal as the interval in response scores for a scale to perform the computation of the mean and standard deviation of data [17].
As item response theory (IRT) is increasingly popular in the fields of social science and psychometrics, especially applying Rasch [24,25] model’s transformed interval scores to a target of the post hoc statistical analyses and tests that might be making different inferences to the results yielded by the summation scores [26] in Table 3. However, the prevalence rate of job strain must be same to each other because specific objectivity [17,24] is one of Rasch model’s features that lead Rasch scores to match up the summation scores in order and to distribute the counts in quadrants equivalently. Furthermore, any subscale score of an examinee transformed by the formula of p* = (p - 0.5) × 8 is independent to others, indicating that any new examinee is easily enrolled into the C-JCQ diagram (Figure 3) in comparison for clinical consultation.
Conclusions
Periodical surveys of labor quality of work life with C-JCQ are urgently in need. The graphical representation system to report the individual work stain in workplace can be applied to clinical settings in use and to the prevalence rate of work strain in computation.
References
- Davenport J (1983) Whatever happened to QWL? Office Administration and Automation 44: 26-28.
- Karasek R, Theorell T (1992) The psychosocial work environment. In Healthy work-stress, productivity, and the reconstruction of working life. (1stedn) Basic Books New York.
- Kawakami N, Haratani T (1999) Epidemiology of job stress and health in Japan: review of current evidence and future direction. Ind Health 37: 174-186.
- Schnall PL, Landsbergis PA, Baker D (1994) Job strain and cardiovascular disease. Annu Rev Public Health 15: 381-411.
- Chien TW, Wang WC, Chang CC (2012) Health outcomes for quality of work life as evaluated by Rasch methods: An example using the Chinese version of the Job Content Questionnaire. HealthMED 6: 2271-2283.
- Girish N, Ramachandra K, Arun G M, Asha K (2012) Prevalence of musculoskeletal disorders among cashew factory workers. Arch Environ Occup Health 67: 37-42.
- Rixgens P, Badura B (2012) [Reporting of work-related mental health]. Bundesgesundheitsblatt Gesundheitsforschung Gesundheitsschutz 55: 197-204.
- Widanarko B, Legg S, Stevenson M, Devereux J, Eng A, et al. (2012) Prevalence and work-related risk factors for reduced activities and absenteeism due to low back symptoms. Appl Ergon 43: 727-737.
- Maizura H, Retneswari M, Moe H, Hoe VC, Bulgiba A (2010) Job strain among Malaysian office workers of a multinational company. Occup Med (Lond) 60: 219-224.
- Karasek R, Brisson C, Kawakami N, Houtman I, Bongers P, et al. (1998) The Job Content Questionnaire (JCQ): an instrument for internationally comparative assessments of psychosocial job characteristics. J Occup Health Psychol 3: 322-355.
- Karasek RA, Theorell T, Schwartz JE, Schnall PL, Pieper CF, et al. (1988) Job characteristics in relation to the prevalence of myocardial infarction in the US Health Examination Survey (HES) and the Health and Nutrition Examination Survey (HANES). Am J Public Health 78: 910-918.
- Cheng Y, Kawachi I, Coakley EH, Schwartz J, Colditz G (2000) Association between psychosocial work characteristics and health functioning in American women: prospective study. BMJ 320: 1432-1436.
- Hawkins B (2008) Promoting worker and business health. Ky Nurse 56: 21.
- Hurrell JJ Jr, Nelson DL, Simmons BL (1998) Measuring job stressors and strains: where we have been, where we are, and where we need to go. J Occup Health Psychol 3: 368-389.
- Hwang KO, Stuckey HL, Chen MC, Kraschnewski JL, Forjuoh SN, et al. (2012) Primary care providers' perspectives on online weight-loss programs: a big wish list. J Med Internet Res 14: e16.
- Cheng Y, Luh WM, Guo YL (2003) Reliability and validity of the Chinese version of the Job Content Questionnaire in Taiwanese workers. Int J Behav Med 10: 15-30.
- Wang WC (2010) Recent developments in Rasch measurement. Hong Kong: The Hong Kong Institute of Education.
- Kaiser HF (1960) The application of electronic computers to factor analysis. Educational and Psychological Measurement 20: 141-151.
- Cattell RB (1966) The scree test for the number of factors. Multivariate Behavioral Research 1: 629-637.
- Horn JL (1965) A rationale and test for the number of factors in factor analysis. Psychometrika 30: 179-185.
- Fabrigar LR, Wegener DT, MacCallum RC, Strahan EJ (1999) Evaluating the use ofexploratory factor analysis in psychological research. Psychological Methods 4: 272-299.
- Silverstein AB (1987) Note on the parallel analysis criterion for determining the number of common factors or principal components. Psychol Rep 61: 351-354.
- Stevens SS (1946) On the Theory of Scales of Measurement. Science 103: 677-680.
- Rasch G (1993) Probabilistic Models for Some Intelligence and Attainment Tests. Mesa Press CA.
- Chien TW, Wang WC, Huang SY, Lai WP, Chow JC (2011) A web-based computerized adaptive testing (CAT) to assess patient perception in hospitalization. J Med Internet Res 13: e61.
- Lord FM (1974) Estimation of latent ability and item parameters when there are omitted responses. Psychometrika 39: 247-264.
Relevant Topics
- Child Health Education
- Construction Safety
- Dental Health Education
- Holistic Health Education
- Industrial Hygiene
- Nursing Health Education
- Occupational and Environmental Medicine
- Occupational Dermatitis
- Occupational Disorders
- Occupational Exposures
- Occupational Medicine
- Occupational Physical Therapy
- Occupational Rehabilitation
- Occupational Standards
- Occupational Therapist Practice
- Occupational Therapy
- Occupational Therapy Devices & Market Analysis
- Occupational Toxicology
- Oral Health Education
- Paediatric Occupational Therapy
- Perinatal Mental Health
- Pleural Mesothelioma
- Recreation Therapy
- Sensory Integration Therapy
- Workplace Safety & Stress
- Workplace Safety Culture
Recommended Journals
Article Tools
Article Usage
- Total views: 14511
- [From(publication date):
August-2013 - Aug 25, 2025] - Breakdown by view type
- HTML page views : 9857
- PDF downloads : 4654