Particulate Matter and Carbon Monoxide Emission Factors from Incense Burning
Received: 25-Oct-2017 / Accepted Date: 04-Dec-2017 / Published Date: 11-Nov-2017 DOI: 10.4172/2573-458X.1000140
Abstract
Indoor air quality is a growing concern in the world. People spend a considerable amount of time in indoor environments such as homes, workplaces, shopping malls, stores and places of worships such as churches, temples and mosques. Most often incense burning takes place in places of worship which are enclosed spaces full of worshippers. Incense burning releases pollutants such as particulate matter (PM), carbon monoxide (CO) and volatile organic compounds. Exposure to these kinds of pollutants can result in adverse health effects. The purpose of this research is to determine the particulate matter and carbon monoxide emission factors (EFs) from incense stick burning. A test chamber with a rectangular exhaust duct, a fan to exhaust air with pollutants in it and pollutant sensors were used to achieve the project goals. Several experiments were performed with different cases/ scenarios to accurately estimate the EFs and several test runs were conducted for each case to test the repeatability of the results. EFs for CO (mass), PM2.5 (mass), PM2.5 (number), PM10 (mass), PM10 (number) were developed in this research which should help in (a) assessing exposures, (b) designing ventilation systems and (c) assessing potential health risks.
Keywords: Carbon monoxide emission; Pollutant; Pollution
Introduction
Indoor air quality (IAQ) has become a major concern in the presentday society and has triggered the interests of many researchers around the globe. The World Health Organization (WHO) states that there were 3.3 million deaths in 2012 attributed to indoor air pollution in the South-East Asia and Western Pacific Regions [1]. In the modern world, most people spend 90% of their time living indoors [2]. Indoor sources like cooking, charcoal burning, incense, smoking, household cleaners and candle burning contribute to significant amounts of indoor air pollution [3,4]. The U.S. EPA (United States Environmental Protection Agency) states that many pollutants in an indoor environment can be 2-5 times and occasionally more than 100 times higher than ambient levels [2], so people upon exposure to this kind of pollution are prone to various health risks.
Indoor air pollution has been a major problem in many developing countries. The use of coal and wood as a source of energy for cooking, heating lead to increased smoke, fine particulate dust and other pollutant emissions due to the incomplete combustion [5,6]. About 3 billion people, mostly from developing nations, use biomass as a source of energy to cook food and heat their homes [7]. The use of biomass generates pollutants that can accumulate to hazard levels in a short time interval, which can lead to adverse health effects. A WHO report states that there were 4.3 million deaths attributed to the household air pollution from cooking with solid fuels in 2012 [7]. Women and children are most exposed to the indoor air pollution as they spend most of their time at homes. Children breathe more air per kilogram of body weight than adults do [2]. An average adult breathes 20 m3 of air daily, if the average adult body weight is 70 kg, then an adult breathes 0.29 m3 of air/kg body weight [8]. Similarly, an average child breathes 5 m3 of air daily, if the average body weight of child between 0-1.5 years is 10 kg and 1.5-5 years is 14 kg [9], then a child between 0-1.5 years and 1.5-5 years breathes 0.5 and 0.36 m3 of air/kg body weight respectively. Thus, children are more prone to indoor air pollution.
Incense burning is a common tradition followed in many Asian countries [10]; this activity is mainly used for religious and aesthetic purposes. Incense sticks are also used in homes to mask bad odors, repel mosquitoes, flies and insects. Indoor air pollution resulting from burning incense is a major public health concern. Excessive usage of these incense sticks releases toxic pollutants that can accumulate quickly to hazardous levels in indoor environments, particularly in a poorly ventilated area [11]. The rise of pollutant levels in the indoor environment have adverse effects on human health.
The amount and kind of pollutants released from the incense depend on the composition of the material used in making the incense sticks. Generally, incense burning generates the respirable particulate dust, carbon dioxide, carbon monoxide, volatile organic compounds (VOCs) and carcinogens such as PAHs, carbonyls and benzene [3,12].
Incense sticks are widely used in temples in many Asian countries. The incense sticks market in India is worth 225 million USD per year and it is growing 10% annually. In China, 76.9% of incense is burnt at homes every day and around 90% of the population has been using incense sticks for over 20 years [13].
The smoke produced from incense burning pollutes air both in and around the temples. Thus people are more exposed to the harmful pollutants for several hours a day. A report by the Environmental Protection Agency in Taiwan in 2003 stated that a total of 28.7 metric tons of incense was burned in 92 temples in Kao-Hsiong city which emits significant quantities of air pollutants [14]. The increasing levels of smoke generated is jeopardizing the health and lives of people (Figure 1).

Figure 1: Incense burning at a temple in China.
The purpose of this research is to develop a lab-scale model to estimate the PM2.5 (number and mass), PM10 (number and mass) and CO emission factors (EFs) from incense burning. EFs indicate how polluting a specific activity is. It is an amount of air pollutant emitted per unit amount of work done, or product consumed, or product produced, or something similar. Thus, units of EFs, in this case, can be “g/g,” but for convenience, they can be expressed as “g/Kg,” or “mg/g” and so on. The EFs generated in this research will be helpful to many researchers, scientists to develop emission control strategies, health risk assessments.
Emission factor and its importance
The amount/quantity of a pollutant released to the atmosphere from a specific process or activity is known as Emission Factor (EF). It is expressed as the amount of pollutant emitted per unit amount of work done [15].
(Or)
The emission factor is an indicator of how polluting a specific activity is. It is an amount of air pollutant emitted per unit amount of work done. Some of the examples include:
kg of SO2/mile-travelled
μg of CO/g of incense stick burnt;
μg of PM10 (or) PM2.5/g of cigarette burnt
kg of CO/ton of iron ore processed
kg of PM/ton of steel
kg of SO2/MWH of electricity produced
Emission factors are the fundamental input parameters in developing national, state and local emissions inventories for air quality management decisions and in developing emission control strategies [15]. EFs are used in developing greenhouse gas (GHG) emission inventories for ports, steel industry, electric generation utilities and so on and they will help in creating awareness among people and helps in developing emission control strategies to minimize emissions. EFs are used to estimate emissions from different sources, as well as in air permitting applications, environmental impact assessments and public health risk assessments.
Emission factors are developed by researchers, scientists, air quality experts, governmental organizations, industry associations and others to help industries in managing air quality related issues and in developing emission control strategies. Emission factors for different industries are documented in AP-42. There are EFs for various processes/industries such as:
• Coal Powered Power Plants
• Petroleum Refining
• Iron and Steel Manufacturing
• Cement Manufacturing
The U.S. EPA has been publishing emission factors for different pollutants from various activities. These documents are compiled and publicly available through Air Pollutant emission factors (AP- 42) documents. EFs for various industries like petroleum refinery, pharmaceutical, iron and steel, paper and pulp, lumber, water transportation and so on, can be accessed through AP-42 documents [15]. EF’s can also be found in many scientific articles, publications of trade organizations such as National Shipbuilding Research Program (NSRP) and others. Industries can use these published emissions factors for emission inventories, air permit applications, environmental impact assessment and health risk assessments.
While there are several researchers made an effort to generate EFs applicable to the incense stick burning. It should be noted that EPA has not compiled these EFs into its AP-42 documents, this might be probably because incense stick burning is not an industrial process and is a voluntary activity.
Particulate matter and carbon monoxide health effects
Globally, 3% of cardiopulmonary and 5% of lung cancer deaths is attributable to PM. The health effects of inhalable PM due to shortterm exposure include respiratory and cardiovascular morbidity, such as aggravation of asthma, respiratory symptoms and an increase in hospital admissions; long-term exposure risks include mortality from cardiovascular and respiratory diseases and lung cancer [16].
Short-term exposure to PM10 has significant effects on respiratory health, but for mortality, PM2.5 is a larger risk factor than PM10 for prolonged exposures. Studies have shown that with a 10 μg/m3 increase in indoor PM10 concentration, the cardiovascular mortality increased by 0.36% and respiratory mortality by 0.42%. Likewise, with a 10 μg/ m3 increase in indoor PM2.5 concentration, the cardiovascular mortality increased by 0.63% and respiratory mortality by 0.75% [13].
The incense burning also produces carbon monoxide (CO), a colorless, odorless, tasteless and poisonous gas. The inhalation of CO leads to the displacement of oxygen in the blood and deprives the heart, brain and other vital organs of oxygen. CO readily combines with hemoglobin much more than oxygen with a factor of 200-300 to form carboxyhemoglobin, this reduces the blood’s capacity to transport oxygen. CO, when inhaled in low concentrations, leads to headaches, dizziness, weakness and nausea, while high concentrations can be detrimental [17].
Materials and Methods
Incense stick
Incense sticks are made of an aromatic material that produces fragrant smoke when burned. Incense is available in various forms like sticks, joss sticks, cones, coils, powders, rope, rocks/charcoal and smudge bundles as shown in Figure 2 [18]. Typically, the composition of incense stick consists of 21% (by weight) of herbal and wood powder, 35% of fragrance material, 11% of adhesive powder and 33% of bamboo stick [17].

Figure 2: Various forms of incense. A: incense rope, B: cones, C: sticks, D: rocks/charcoal, E: powder, F: coil, G: joss, Sticks and H: smudge bundle.
In many developing countries, incense is burned in homes and public places such as stores, shopping malls and temples. They have been widely used in many Asian countries like India, China, Japan for various purposes.
Incense stick burning comes under combustion process. Combustion is the reaction between a fuel and oxidant, the fuel is carbonaceous such as gasoline, wood, or coal and the oxidant is the oxygen present in the air. Typically, incense stick when burnt release particulate matter, carbon monoxide (CO), carbon dioxide (CO2) and other pollutants such as sulfur compounds (if sulfur is present), oxides of nitrogen (NOx), organic compounds/hydrocarbons (as the most combustible material is made of organic material) [19].
Indian musk incense sticks were used for all the experiments in this research. These are hand rolled, manufactured in Mumbai, India. Incense sticks were placed in a cup holder inside the test chamber to perform experiments. The composition of the incense stick is not given by the manufacturer.
Experimental setup
The test chamber required for this research is designed as per the EPA Method 1 guidelines (the sampling was taken at “8* equivalent diameter” distance to avoid any turbulence effect). The setup with all the dimensions is shown in Figure 3. It is made of acrylic glass to see the smoke from the incense burning visually. The box was fabricated in such a way that all the openings were sealed to make it an airtight box. It has openings on one side to allow ambient air to enter the chamber, It has a lid on the top that can be opened to set up the incense stick, a cup holder and a water bath. A fan was installed to draw the air through the exhaust duct and the fan was fixed to a plate that can slide down as shown in Figure 4. Sensors were placed inside the chamber to record the pollutant readings. An incense stick in a cup holder was placed in a water bath. A water bath was used to prevent any resuspension of the burnt ash falling on the floor as the purpose was to measure the airborne particulates.

Figure 3: Isometric view of the test chamber. (a) Incense stick, (b) Cup holder, (c) Water bath, (d) Fan, (e) CO sensor, (f) Dylos PM sensor.

Figure 4: Isometric view showing the initial setup.
The experiments were performed in the test chamber. Before sampling, the whole box was cleared with ambient air, so the initial concentration is approximately zero and the fans were turned on. Then, The particulate matter and carbon monoxide sensors were initiated to log the readings. Several experiments were conducted with a time gap of 30 min between each experiment. This was to ensure the pollutant concentrations inside the chamber to tally the initial ambient levels.
Sampling
The incense burning generates smaller particles that can enter deeper parts of the human respiratory system that leads to adverse health effects. Particles with an aerodynamic diameter <2.5 μm (PM2.5) and 10 μm (PM10) were assessed in this research.
The Dylos DC 1700 particulate matter analyzer was used in this research for sampling PM2.5 and PM10. It is a real-time analyzer that can be used for both ambient and indoor environments. It works on the principle of the laser-based particle counter. The GasBadge Pro manufactured by Industrial Scientific was used to monitor carbon monoxide (CO), It is a real-time, portable CO analyzer that can detect values between 0 to 1500 ppm with 1 ppm resolution.
Experimental design
Experiments were conducted in four different cases (scenarios) to estimate the emission factors accurately as shown in Table 1. Several test runs were performed for each case to test the repeatability of the results; all the experiments for each case were then averaged and reported. Different cases were designed to see the consistency in the results. All the experiments were conducted at the University of New Orleans (UNO) lab.
| Case | Description |
|---|---|
| Case1 | One incense stick with one fan |
| Case2 | Two incense sticks with one fan |
| Case3 | One incense stick with two fans |
| Case4 | Two incense sticks with two fans |
Table 1: Experimental design.
Modeling of emission factors
A simple mass balance equation is applied to explore the behavior of indoor air pollutants as a function of infiltration of outdoor air, indoor sources and sinks and leakage to the outdoor air. Assuming the contents in the indoor environment are uniformly/well mixed, the following materials balance equation presented below is applicable [8]:

Variables involved in the above equation are: V (m3) is the volume of box, C (g/m3) is the concentration of pollutant, t (s) is the time, Q (m3/s) is the rate of airflow into and out of box, Ca (g/m3) is the concentration of pollutant in outside air, E (g/s) is the emission rate of pollutant into box from indoor source, k (s-1) is the pollutant decay rate coefficient.
By assuming the contents in the box are uniformly/well mixed, no decay of pollutant (k=0), the ambient concentration is zero (Ca =0), at the steady state condition, the mass balance equation is reduced to

PM in the environment is typically removed through one or more of removal mechanisms such as precipitation, absorption and adsorption. In this experiment, PM removal is considered negligible. A study indicates that the CO decay rate constant is 0.0 s-1 [20], so the CO pollutant decay rate is considered negligible.
Variation in the pollutant concentration observed inside the test chamber during the experiment can be explained as follows - As the incense stick starts to burn inside the experimental chamber, the pollutant concentration steadily increases reaching a steady-state condition. Once the incense stick stops burning, the steady-state condition breaks and then the pollutant concentration steadily drops based on the ventilation rate of the fan used.
A test chamber with an exhaust duct was designed to perform the experiments for this research as shown in Figure 3. Field data in combination with the known indoor air quality model equation was used in this research to determine the particulate matter and carbon monoxide emission factors from incense burning.
Estimating the flow rate in the exhaust duct of the test chamber: EPA Method 1 provides guidelines for selection of sampling locations and traverse points for measuring velocity in ducts [21]. Thus, this method was employed in estimating the average velocity in the exhaust duct. Figure 5 below shows the cross-section of the exhaust duct and the 9-traverse points sampled to record exhaust gas velocity using TSI velocity transducer. Using the velocity values obtained from 9 locations, average gas velocity was computed. The flow rate was then computed using the cross-sectional area of the exhaust duct and the average velocity.

Figure 5: A 3*3 matrix layout for velocity measurements.
Emission factor estimation: Emission factor (EF) in this experiment is calculated using the formula given below
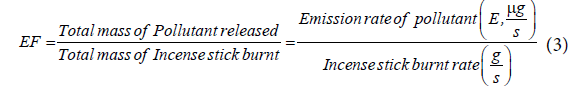
The emission rate of pollutant (E) is computed using Eq (1) with the known pollutant concentration readings and the average flow rate in the exhaust duct.
Incense stick burnt rate is calculated using the formula below:

Results and Discussion
Dylos particle analyzer and industrial scientific carbon monoxide sensors were used to record the values of PM10/PM2.5 and CO for computing EFs from incense burning. All the experiments in this research were conducted at the University of New Orleans in March, June and July 2017. The data from the sensors were downloaded and then analyzed to compute the results.
The following variables were computed and reported for four different cases for CO, PM2.5 (mass), PM2.5 (number), PM10 (mass), PM10 (number):
• Emission rate (E) - μg of pollutant released/s or # particles released/s
• Emission factor (EF) -
» mg of pollutant released/g of incense burnt or
» μg of pollutant released/g of incense burnt or
» # particles released/g of incense burnt
The velocity measurements in the exhaust duct are measured using a velocity meter and the average flow rate values are computed and presented in Table 2.
| Criteria | Area, m2 | Velocity, m/s | Air flow, m3/s | Air Flow, l/min |
|---|---|---|---|---|
| Single fan | 0.034 | 0.102 | 3.4 x 10^-3 | 2.0 x 10^2 |
| Two fans | 0.034 | 0.118 | 4.0 x 10^-3 | 2.4 x 10^2 |
Table 2: Flow rate inside the rectangular exhaust duct.
The carbon monoxide and particulate matter emission factors from incense burning for four different cases are presented in figures below. Several test runs were performed for each case and the average, standard deviation (S.D.) for the results were computed and reported below (Figures 6-10).

Figure 6: Average and standard deviation of the CO results for four cases.

Figure 7: Average and standard deviation of the PM2.5 (mass) results for four cases.

Figure 8: Average and standard deviation of the PM2.5 (number) results for four cases.

Figure 9: Average and standard deviation of the PM10 (mass) results for four cases.

Figure 10: Average and standard deviation of the PM10 (number) results for four cases.
Note: The average results for each case are presented above each bar in the figures below and the standard deviation (σ) of the results for each case is presented in the middle of the bar in each figure.
From the above tables, it can be observed that the CO emission factors for four cases have smaller standard deviation. For PM2.5 (mass and number), PM10 (mass and number), the EFs developed with single incense stick also had a lower standard deviation, but the EFs with two incense sticks had larger variation or standard deviations. The Larger variation observed in case of two incense sticks was probably due to the Dylos Sensor’s inconsistent reliability at higher concentrations. The amount of smoke generated from two incense sticks was so high, thus, the sensor was not able to measure those higher concentrations with close repeatability. Thus, the PM10 (mass and number) and PM2.5 (mass and number) EFs developed using two incense sticks had larger variations.
We used standard deviation in our research to check the repeatability of the results. A larger standard deviation indicates that the data points are spread far from the mean and a smaller standard deviation indicates that they are clustered closely around the mean. We tried several experimental combinations (box size, number of incense sticks, number of exhaust fans, exhaust flow rates, sensor types) and corresponding standard deviations were determined. As the goal was to minimize the standard deviations so that other researchers can reproduce our values, a best possible combination of experimental conditions were chosen to carry out the research.
Conclusion
The EFs developed in this research can be useful in public health risk assessments. EFs are useful to estimate the total emissions if the annual consumption of incense sticks is known, this will help in developing emission control strategies to minimize emissions. This research can help other researchers and creates awareness among people about the potential indoor sources that can be a threat to the human health. This research methodology can be further refined to develop EFs for various incense sticks with different compositions to evaluate the emission characteristics. Also, this methodology can be used to other indoor sources and helps in quantifying the emissions.
The pollutant concentrations measured in the test chamber during the experiments are higher than the Permissible Exposure Limits (PELs) suggested by Occupational Safety and Health Administration (OSHA) and the National Ambient Air Quality Standards (NAAQS) by EPA. However, it is important to note that these exposure conditions may or may not exist in homes, temples and other indoor environments depending on many variables such as; the number of incense sticks burnt simultaneously, room size and ventilation conditions. The actual exposure conditions (or pollutant concentrations in indoor environments) can be computed using the EFs developed in this research, along with the room and ventilation conditions.
The CO, PM2.5 (mass), PM2.5 (number), PM10 (mass), PM10 (number) EFs (section 1) developed in this research are between 110-120 mg/g of incense, 2.5-3 mg/g of incense, 800-1100 #particle/μg of incense, 32-33 mg/g of incense, 1200-1400 #particle/μg of incense respectively.
Experiments were performed using a single kind of incense stick because of time constraint. Different kinds of incense sticks should be evaluated using this research. EFs for various incense sticks with different compositions must be evaluated and find the relationship between the composition of the material and pollutants emitted. The same methodology can be implemented for determining the EFs for various gaseous pollutants, VOCs and other pollutants. Various indoor sources (candle burning, tobacco products) can be tested and the emission rates, EFs can be compared and the potential indoor source can be determined.
As the sensors (Dylos and Industrial Scientific CO sensor) were not based on Environmental Protection Agency (EPA) recommended methods, the results obtained may not be as accurate as the standard methods (E.g., gravimetric analysis for particulate matter), so usage of standard methods to estimate the EFs is recommended.
Use of EFs developed in this research can be used for assessing public health risks and the methodology can be used to assess EFs for other pollutants. EFs developed in this research and future research can be used to compute cancer and non-cancer health risks. Likewise, this research can be used to compute cancer and noncancer risk probabilities for other indoor sources and different pollutants.
References
- US EPA (2017) developer central; Smart city air challenge resource pages:Air Pollution.
- Lofroth G, Stensman C, Brandhorst-Satzkorn M (1991) Indoor sources of mutagenic aerosol particulate matter: smoking, cooking and incense burning. Mutat Res 261: 21-22
- Glytsos T, Ondrcek JL, Dzumbov L, Kopanakis I, Lazaridis M (2010) Characterization of particulate matter concentrations during controlled indoor activities. Atmospheric Environ 44: 1539-1549.
- Bruce N,Perez-Padilla R,Albalak R (2000)Indoor air pollution in developing countries: A major environmental and public health challenge.Bull World Health Organ78:1078-1092
- Fullerton DG,Bruce N,Gordon SB (2008) Indoor air pollution from biomass fuel smoke is a major health concern in the developing world. Trans R Soc Trop Med Hyg102:843-851.
- World Health Organization (2016) Household air pollution and health. Fact Sheet N: 292.
- Davis ML, David C (1998) Introduction to environmental engineering. McGraw Hill, USA.
- Copeland TL, Holbrow AM, Otani JM, Connor KT, Paustenbach DJ (1994) Use of probabilistic methods to understand the conservativism in California’s Approach to assessing health risks posed by air contaminants. J Air Waste Manag Assoc 44: 1399-1413.
- Friborg JT, Yuan JM, Wang RW, Koh WP, Lee HP, et al. (2008) Incense use and respiratory tract carcinomas.Cancer113: 1676-1684
- Tirler W, Settimo G (2015) Incense, sparklers and cigarettes are significant contributors to indoor benzene and particle levels. Ann Ιst Super Sanita 51: 28-33.
- Lin JM, Tang CS (1994) Characterization and aliphatic aldehyde content of particulates in Chinese incense smoke.Bull Environ Contam Toxicol53: 895-901
- Apte K, Salvi S (2016) Household air pollution and its effects on health. Version 1. F1000 Res 5: 2593.
- Bureau KHCEP (2003) Reduction of pollutants in temples. In total inventory control of air pollutants and the guidance program for reduction Kao-Hsiong, Taiwan.
- Lin TC,Krishnaswamy G,Chi DS (2008) Incense smoke: Clinical, structural and molecular effects on airway disease.Clin Mol Allergy6: 3-3.
- Jetter JJ, Guo Z, McBrian JA, Flynn MR (2002) Characterization of emissions from burning incense. Sci Total Environ 295: 51-67.
- Davis ML, Cornwell D (1998) Introduction to environmental engineering. McGraw Hill, USA.
- Traynor GW, Allen JR, Apte MG, Dillworth JF, Girman JR, et al. (1982) Indoor air pollution from Portable kerosene-fired space heaters, wood-burning stoves and wood-burning furnaces. Lawrence Berkeley Laboratory.
Citation: Jilla A, Kura B (2017) Particulate Matter and Carbon Monoxide Emission Factors from Incense Burning. Environ Pollut Climate Change 1:140. DOI: 10.4172/2573-458X.1000140
Copyright: © 2017 Jilla A, et al. This is an open-access article distributed under the terms of the Creative Commons Attribution License, which permits unrestricted use, distribution, and reproduction in any medium, provided the original author and source are credited.
Select your language of interest to view the total content in your interested language
Share This Article
Recommended Journals
Open Access Journals
Article Tools
Article Usage
- Total views: 19277
- [From(publication date): 0-2017 - Oct 13, 2025]
- Breakdown by view type
- HTML page views: 18079
- PDF downloads: 1198