Power System Security Optimization of The Nigerian 330kv Transmission Network
Received: 24-Jun-2021 / Accepted Date: 09-Jul-2021 / Published Date: 16-Jul-2021 DOI: 10.4172/2576-1463.1000240
Abstract
The necessity of power system security optimization of the Nigerian 330kV transmission is ever increasing. To this end, the optimal placement and control of FACTS devices are proposed for power system security optimization. The optimal placement of the UPFC in the power system is to ensure stability and voltage level improvement. The objective function for the formulation of the optimization problem is to find the opti¬mal placement of the UPFC that ensures voltage stability, minimization of Voltage Collapse Point Indicator (VCPI) and active power loss. The MATLAB/ SIMULINK model of the case study of Nigerian 330KV, 48-bus power system was created. In the simulations carried out, the system was subjected to transmission line and power plant outage contingencies. Findings showed that the instability due to the power plant outage contingency was more severe than that due to the transmission line outage contingency. Without the placement of the UPFC, in the case of transmission line outage contingency, the voltage level of the critical bus (bus with lowest damping ratio) fell from 0.813 p. u to (and oscillated around) 0.3934 p. u. Whereas in the case of power plant outage contingency without UPFC, the critical bus voltage fell from 0.813 p. u to (and oscillated around) 0.2785 p. u. The system was found to be unstable as all the real parts of the system eigenvalues (in the case of the power plant outage contingency) and most of the eigenvalues (in the case of the transmission line outage contingency) lies on the right-hand side of the S plane. However, with placement and control of the UPFC the voltage transient oscillations (in the cases of the transmission line and power plant outages) were effectively damped out and the voltage level of the critical bus was restored to within the 5% voltage drop requirement. Hence the optimal compensation by the placement of the UPFC enabled the power system to recover from the contingencies and continued to provide quality power supply thus ensuring power system security.
Introduction
Every day in the world, demands of electric power are increasing and these demands of power by the consumer are more than the power flowing through the transmission line. Works done by the earlier researchers in the area of power system security assessment have some deficiencies when applied to specific power system. Conventional approaches proposed by many researchers proved to be time consuming, tedious and give voluminous results. In other words, to maintain security against voltage collapse, it is necessary to estimate the effect of contingencies on the voltage stability margin so that corrective measure can be taken to increase the margin to avoid blackout (line outages). One of the major problems in Nigeria Power Sector is that of transmission, how adequate power can be effectively transmitted to all part of the country without much loss and how it can be effectively distributed to the end-users. The system is typically weak and very insensitive to major disturbances because the technologies used generally deliver very poor voltage profiles and instability, some sections of the grid are equally outdated with inadequate redundancies as opposed to the required network arrangement, deployed transformers are overloaded in most service areas, lacks modern technologies for monitoring and communication.
The aim of this research paper is to enhance the Power System Security of the Nigerian 330kV, 48-bus Transmission network using Unified Power Flow Controller (UPFC) and the specific objectives of the study are to create the control algorithm for the control of reactive power injection and absorption by the UPFC in order to optimally compensate and restore power system normal operations in the case of contingencies and to create the MATLAB/SIMULINK model of the case study of Nigeria of 330KV power system and to carry out contingency simulation studies with UPFC placement in order to evaluate system voltage levels and stability.
Power System Security Concepts
An overriding factor in the operation of a power system is the desire to maintain system security, which involves practices designed to keep the system operating when the components fail since power system apparatus is designed to be operated within certain limits. Most of this piece of equipment is protected by automatic devices that can cause the equipment to be switched out of the system. If these limits are violated or if any event occur on a system that leaves its operating point with its limits violated, the event may be followed by a series of further actions that can switch other equipment out of service. If this process of cascading failures continues, the entire system or large parts of it may completely collapse. This is usually referred to as a system blackout [1]. For this purpose, many powerful modeling, optimization, simulation programs and various control and protection schemes have been developed.
The power flow and contingency assessment of the existing 330 kV Nigeria power grid was carried out by reference [2] using Newton- Raphson method in Mat lab program with a view of ascertaining its capability to cope with the anticipated increase in generation to and above 10,000 MW come 2014. The simulation results of the 330kV grid indicate its reliability at a maximum allowable generation capacity of 5,522 MW without intolerable voltage and thermal violations. The violation limits employed are ± 5% of base voltage 330 kV (0.95 – 1.05) p. u. and 760 MVA for thermal limits. The results also revealed the critical nature and importance of some buses like Ikeja-West, Shiroro, Oshogbo, Benin and their corresponding lines to the performance of the existing national 330kV power grid.
Ibe et al [3] proposed voltage stability improvement of power transmission system in the Nigeria 330 kV, 28-Bus network using TCSC. Power flow solution was developed in MATLAB program using Newton Raphson iterative method and simulated on existing 28- bus 330 kV transmission network. The results were achieved without and with TCSC where voltage drops were noticed, at buses Ayede (0.9892), Jos (0.9800), Kaduna (0.9810), Kainji (0.9968) and Kano (0.9992). TCSC was incorporated and the new voltage magnitudes of these affected buses improved as 1.1883, 1.0319, 1.0327, 1.1682 and 1.2267 respectively. The results showed a considerable improvement in the voltage magnitude with the incorporation of TCSC and consequently a significant reduction in the system losses.
Adejumobi et al [4] evaluated power system contingency of the Nigerian 330kV, 28-Bus network using the power performance index. The direct current (DC) load flow equations were employed to evaluate the network sensitivity factors and line outage distribution factors. Hence, the orders of active power line outage violations in a given sample network were prioritized using the performance index (PI). The contingency analysis was implemented on the MATLAB R 2008a software environment by randomly introducing disturbances on generator buses 2, 21 and 28; and on line 12-14 because of their loads. The network sensitivity factors were determined and used to evaluate violations on the system transmission lines. An outage on generator bus 2 of the network resulted in power flow on line 12-14 increasing from 268.4 MW to 316.9 MW. The new power flow on the line 12- 14 exceeded the power flow limit of 279.6 MW specified by 37.3MW showing violation of 11.8%. This was repeated for other introduced disturbances and the performance index determined to prioritize contingencies.
Anierobi et al. [5] proposed an optimal Power Flow with Security Constraint for the 330 kV, 41-bus Nigeria Power Network using Power World Simulator software. A prototype of the network was developed in the software and a single line contingency were considered. The results obtained showed that while the network was stable at pre-contingency state, a lot of violations occurred at the event of some single line contingencies. To maintain security in the face of these credible contingencies, the network generators output was re-dispatched and this resulted in the increase and disparity in the bus marginal prices.
Zhu and Huang [6], proposed a TCSC model for transient stability analysis. Abur and Lu [7], in 2002 portrayed an approach for determining the most suitable location for installing TCSC in order to reduce the line overloads under a single contingency. In 2004, Visakha et al. [8], presented a Unified Power Flow Controller (UPFC) suitable location under normal and network contingencies. The ranking was calculated using composite criteria based Fuzzy logic for reducing masking effect. The selection of UPFC suitable locations used the criteria on the basis of improved system security.
Kannan et al. [9], overcome the negative aspect of converging to local minima problem found with many global optimization techniques with the help of stretching the PSO during the implementation of generator expansion planning. Padiyar and Krishna improved control strategy in order to achieve maximal improvement in transient stability and damp the rotor oscillations using unified power flow controller.
This method involved both minimization and maximization of power flow in a line. Menniti et al. [10], applied GA for solving static security and dynamic stability problems. The genetic mutation operator was used to control the operating point of a UPFC determined by solving a secure optimal power flow to improve the UPFC damping properties. This algorithm could also be used for solving non-convex problems.
Chang and Su [11], presented the method for determining the voltage security operation limits based on VSAT software for large system by considering bus voltage limits, branch / corridor transfer power limits and P load limit of the whole system. In addition to voltage security constraint, line thermal limits and generator capacity limits etc., should also be considered. The security criteria may be N-1 or possible N-2 contingencies. Milano et al. [12], presented a novel technique for representing system security in the operation of decentralized electricity market with special emphasis on voltage stability. The optimal power flow was solved by using interior point method with a multi objective function for maximizing both social benefit and the distance to maximum loading conditions.
Dimitrios and Nikolaos [13], introduced a machine learning toolkit for power system security analysis. The performance indices and the fine tuning of the parameters of these machine learning tools were considered for the screening and ranking of the contingencies. Faustino Agreira et al. [14], analysed the impact of different security performance indices on a contingency screening and ranking algorithm. In this work three modules of filtering techniques were used to reduce the complexity levels.
Jian et al. [15], proposed a new methodology of power system dynamic security assessment by applying N-1 and N-2 contingencies for transformer, generator and bus or line. Based on the concept of stability margin, the severity of the contingencies was ranked. An adaptive bounding method for solving voltage security problems was developed by Liu et al. [16]. The idea of electrical distance was introduced for choosing the corresponding voltage control area locally around the contingency event rather than the system global problem, which means the reactive reserves in a specific area were considered to be the critical factor in determining the voltage stability.
A new algorithm for automatic contingency analysis and ranking caused by line outage in a power transmission system was presented by Musirin and Rahman [17]. All steps in the algorithms including the load flow analysis; removal and reinsertion of line and overall ranking process were accommodated in one complete programme making it a complete and effective solution for contingency analysis and ranking.
Power System Optimization
Optimization is a broad set of interrelated decisions on obtaining, operating and maintaining physical and human resources for electricity generation, transmission, and distribution that minimize the total cost of providing electric power to all classes of consumers, subject to engineering, market, and regulatory constraints [18]. In electricity supply systems, there exist a wide range of problems involving optimization process. It may include self-standing generation, transmission, distribution systems or any combination of them. The target is to minimize the costs for construction and operation of the system, the economic efficiency and profit thus become the objective function and the other requirements are represented by the constrained [19].
Flexible AC Transmission System (FACTS)
Recent development in power electronics introduces the use of flexible AC transmission system (FACTS) controllers in power systems. The FACTS controllers are capable of controlling the network condition in a very fast manner and this feature of FACTS can be utilized to improve the voltage stability, and steady state and transient stabilities of a complex power.
The use of FACTS devices at present is bringing the users of high voltage transmission systems fresh opportunities as well as challenges.
These devices are able to modify voltage, phase angle, impedance and the power flows at particular points in power systems. FACTS devices control the power flows in the network and reduce the flows in heavily loaded lines. It results in an increase of loadability, low system losses, improved stability, security of network and reduced cost of production. FACTS devices play an important role in power system security enhancement. Due to high capital investment, it is necessary to locate FACTS devices optimally in a power system. However, it appears to be one of the most important alternatives to overcome both the inflexibility condition of most of the power systems and the continuously growing demand for power, as construction of new high voltage transmission lines are in most of the cases either a non-viable solution or become viable after a certain period of time [20].
Methodology
Power System Security Optimization considered in this study is as it concerns the ability of the system to ensure voltage quality and stability of the system in the event of contingencies. The Unified Power Flow Controller (UPFC) is the FACTS device used in this work for the proposed optimization of the Nigeria 330 kV power system. The strategy adopted in this study is the placement and control of the UPFC device to optimally provide dynamic compensation in the event of contingency to mitigate against voltage instability and thus ensure the security of the system to continue to provide electrical energy to consumers. The digital model of the Nigerian 330 kV power system was be created in MATLAB/SIMULINK software for the evaluation of the performance of the UPFC. Simulation study was carried out to evaluate the ability of the UPFC to ensure the voltage quality and stability of the power system in the event of contingencies. Power plant and transmission line outages are the contingencies to be simulated and used to determine the performance of the FACTS device in ensuring the recovery and restoration of electricity service in the event of contingencies.
Modeling of the UPFC with power flow analysis
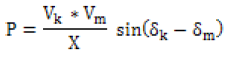
The complex systems like power systems are analyzed by using one of the mathematical method analyses which is newton-Raphson method to give good convergence. The transmission line in power system can be denoted by a two-bus system “k” and “m” in ordinary form. The active power transmitted between bus nodes k and m is given by:
 (1)
(1)
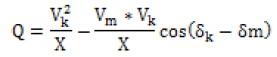
Where Vk and Vm are the voltages at the respective nodes, (δk − δm) the angle between the voltages and, the line impedance. The power flow can be controlled by altering the voltages at a node, the impedance between the nodes and the angle between the end voltages. The reactive power is given by:
 (2)
(2)
The shunt series compensators like UPFC controls both wattful power flow, wattless power flow and improves the voltage profile at its terminals. This type of compensator majorly consists of two Voltage source converters which are sharing a common capacitor. The equivalent circuit is shown in the Figure 1.

Figure 1: Equivalent circuit diagram of UPFC.
Placement of FACTs device using optimization techniques
The criteria for the optimal placement of the FACTS device in the power system to ensure stability is minimization of Voltage Collapse Point Indicator (VCPI) and active power loss. VCPI is also taken as the Voltage stability proximity indicator. Power injection model is used for UPFC compensation modeling here. Power injection model (Figure 2) is used in this work, in which UPFC is represented as two voltage sources in steady state between buses i and j.

Figure 2: UPFC power injection model.
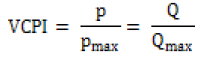
Voltage stability is a major concern in power system security. Voltage stability is an issue especially during load variations. An accurate and reliable index is needed in the analysis for the optimal deployment of FACTS devices to ensure system security. In the modeling of the UPFC placement carried out here, the index proposed by Moghavvemi and Faruque [21] was used. This is the VCPI index. The VCPI index is used as a metric to calculate the voltage collapse scenario of the power system. The VCPI is based on the maximum power that is transferred between two nodes in a power system network. As long as the indices remain less than one, then the system is considered to be stable and it is expressed as in Equation (3) [21,22]
 (3)
(3)
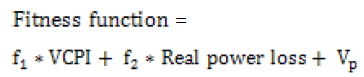
where P, Q are the real and reactive power transferred and Pmax and Qmax are the maximum values of real and reactive power that can be transferred over a line. The strategy in this work is to place the UPFC device in the power system such as to reduce the value of VCPI and enhance the stability of the power system. Based on the VCPI metrics, the fitness function for the optimal location of the UPFC on the power system is expressed as in equation (4):
 (4)
(4)
where f1 and f2 are constants and Vp is the voltage penalty that is laid on the equation for crossing voltage limits.
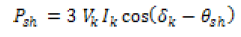
Constraints
Constraints including real and reactive power balance for the UPFC installation are given in Equations (5)-(6).
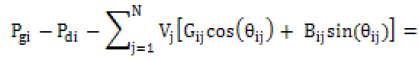 (5)
(5)
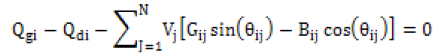 (6)
(6)
 (7)
(7)
 (8)
(8)
where Pgi, Qgi, Pdi and Qdi are the real and reactive power generated and real and reactive power demand, Pfactsi and Qfactsi are the real and reactive powers injected/absorbed by FACTS, V is the voltage, G, B, Y are the conductance, susceptance and admittance of the lines.
The UPFC controller model and implementation
The UPFC is made up of two voltage source converters (VSC) with semiconductor devices having turns off capability, sharing a common dc capacitor and connected to a power system through coupling transformers. The model of the UPFC is specified using a power balance equation that couples the shunt and series ac/dc converters through its common dc link, as well as through their physical system connections. For the analysis carried out in this section, the basic equivalent circuit diagram of the UPFC as depicted in Figure 1 is expanded into the functional model as given in Figure 3.

Figure 3: The UPFC functional model.
The main objective of the series converter is to produce an ac voltage of controllable magnitude and phase angle, and inject this voltage at fundamental frequency into the transmission line, exchanging real and reactive power at its ac terminals through the series connected transformer. The shunt converter provides the required real power at the dc terminals; thus, real power flows between the controller shunt and series ac terminals through the common dc link. The VSCs can be accurately represented as voltage sources operating at fundamental frequency for transient and steady state stability studies, consequently, the UPFC may be modeled as illustrated in Figure 4 [23].

Figure 4: Modeled UPFC controller.

Figure 4(1): MATLAB SIMULINK model of the 330 KV power system with UPFC FACTS device placed between bus 21 and
24 based on location identified by genetic algorithm.
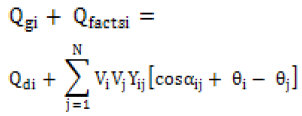
Based on the power balance technique proposed in [24] for a STATCOM mode,
 (9)
(9)
Thus, the three-phase instantaneous power flowing into the shunt converter from the ac bus, neglecting transformer losses and assuming fundamental frequency and balanced conditions, can be represented by
 (10)
(10)
Where Vk ∠ δk is the rms phasor of the sinusoidal sending-end voltage Vk (i. e. at bus k) and Ish ∠ θsh is the rms phasor of the shunt converter’s sinusoidal current.
Switching states for the rectifying state of the Thyristors
Here, the 120o conduction mode was used to explain the switching state of the thyristor in the rectifying mode. That is at a single phase, only two switches are in the ON state.
Considering the plot of the six thyristor switches as shown in Figure 5. Figure 5 shows the rectifying state of thyristors S 1, S 2, S 3, S 4, S 5 and S 6, while table 2 shows the switching sequence. Here, only two switches are in the ON state at the same time. At a firing angle of 0°, only switch S 1 and S 6 are in the ON state while switches S 2, S 3, S 4 and S 5 are switched OFF. Also, at a firing angle of 60o, switches S 2 and S 3 are switched ON while switches S 1, S 4, S 5 and S 6 are switched OFF. This switching ON and OFF process continues until such a time that the real power becomes equal to reactive power.

Figure 5: Waveform at 120° conduction for the Thyristors.
Switching states for the inverting state of the Thyristors
Figure 6 shows the inverting waveform at 180° conduction mode. In this mode, there are at every moment three switches closed and three open. The principle is depicted in Figure 6, while the switching logics are shown in Table 3. The name 180° inverter indicates that the switches are in one period closed for 180° and logically open for the remaining 180°.
However, to achieve three-phase voltages, each pole voltage is displaced from each other by 120 electrical degrees. In such switching, three of six switches are always turned on, and their switching sequence goes on in the order of switch numbers as shown in Figure 3.7 such as …S 12S 21S 13, S 21S 13S 14, S 13S 14S 15, S 14S 15S 16, S 15S 16S 21, S 16S 12S 21 and back to S 12S 21S 13. In this case, there are six different sections in one fundamental period of the output voltage. The inverter operated by this switching scheme is called square wave inverter, in which the amplitude of output voltages remains constant while only their frequency can be controlled.
The functions of the gating signals are represented in the binary system with 0 and 1 values as shown in Table 3. When the gating signal is 0, it means that the switch is not conducting and when it is 1, the switch is conducting. In one phase-leg the bottom switch has a switching function which is the reciprocal of the top switch function. Therefore, if the switching states of the top switches are known, the output voltages of the inverter can be found.

Figure 6: Wave form at 180° conduction.
Placement of the UPFC FACT device
In the simulation carried out, the FACTS placement genetic algorithm was coded in MATLAB m-file program. When loaded into memory, it communicates with the load flow program via the MATLAB program workspace, from where it reads the values of load flow variable. The genetic algorithm program outputs the bus locations for the optimal placement of the UPFC device. Running the genetic algorithm program, a number of iterations would give the location for placement of corresponding number of FACTS devices. However, one iteration for placement of one UPFC device was executed in the simulation carried out. From simulation output, the UPFC was placed between bus 21(at LOKOJA) and bus 24(at MAKURDI). This is shown in the digital model of the Nigerian 330 KV network given in Figure 7.

Figure 7: Voltage profile of the base case (i.e. system without the installation UPFC) of Nigerian 330 KV power system.
Base case voltage profile of case study power grid
To obtain the base case voltage profile of the case study power system, load flow solution is carried out. The MATLAB Mfile program is used to carry out load flow solution of the Nigerian 48 bus Pflow 330KV interconnected power system. The Pflow load flow software implements the Newton-Raphson load flow algorithm. The raw program output from the load flow solution using Pflow is given below:
The base case voltage profile of the case study system is shown in Figure 8. From figure 8, 27 buses are below the 5% voltage drop limit. This shows substantial weaknesses in the power system under investigation. However, this does not give much information regarding the distribution of instabilities in the system. Hence eigenvalue, the damping ratio and bus participation factors are computed to give vital information regarding the security of the power system.

Figure 8: Comparison of Voltage trajectory at bus 7 during transmission line outage contingency with and without UPFC FACTS device installed.
Power system without simulation of contingency and without UPFC installed
The system eigenvalues are computed in the simulation to provide information on the voltage stability of the test power system. The Anoldi eigenvalue analysis program is used to compute the eigenvalues of the bus voltages, from which their participation factors and damping ratios are computed.
The eigenvalue analysis program is applied to the case study power system. The MATLAB m file code of the eigenvalue program interfaces with the MATLAB/SIMULINK model of the case study power system via the MATLAB program Workspace. The bus Eigenvalues, bus participation factor, and bus damping ratios computed for the case study power system base operational state (i. e. for the power system steady state without contingency or disturbances) is listed in Table 4.
The Eigenvalue (λ) gives information about the proximity of the system to instability. The participation factor measures the participation of a state variable in a certain mode oscillation. The bus participation factor shows the weak zones of the system [25]. The branches and the generation participation factors shows transmission lines with the most reactive consumption and the generation that mainly supply reactive power back to the system [26]. The damping ratios (ς) is an indication of ability of the system to return to stable state in the event of disturbance thus ensuring system security.
From Table 4.1, it can be noticed that the real part of the complex eigenvalue are not all negatives. This means that they are not all placed on the left side (i. e. the stable location) of s-plane. This means the system is not in stable conditions. Real part of the eigenvalue in the left half of the s-plane defines exponentially decaying component in the system response. The rate of the decay is determined by its location. Values far from the origin to the left-hand of the s-plane corresponds to components that decay rapidly, while values near the origin correspond to slowly decaying component. If there are real values of the complex eigen value located in the right-half of the s-plane, this means the system is unstable. Real values in the right half of the s-plane generates exponentially increasing component in the power system responses. The imaginary part of the complex eigen values generate an oscillatory component with a constant amplitude determined by the initial conditions.
From Table 4, it can be noticed that the damping ratios of all the buses (this corresponds to the modes) are not all above 5%. The minimum acceptable level of damping is not clearly known. A damping ratio less than 3% must be accepted with caution. Damping is considered adequate if all modes have a predicted damping ratio of at least 5% [26]. However, for quality assurance, utilities select higher values for use as damping threshold. Hence as in the reference [27] 20% is the damping threshold (ξ_T) selected for this work. The damping ratio in Table 4.1 are not all greater than the minimum of 0.05.
From the response of the case study power system as listed in Table 4, the critical bus (corresponding to the critical mode) is of special concern. It is clear from the 4th column that the damping ratio for bus 7(corresponding to mode #7 (λ 7)) is the smallest and therefore, the behaviour of this bus (mode) is important in the determining the security level of the case study power system. This bus(mode) is referred to as the critical mode. Its damping ratio is 0.2233.
The participation factor is shown in column 6 of Table 4. Bus 23(corresponding to Mode#23) has the highest bus participation factor (i. e. 12.4678). This means that it participates more than every other bus in the critical mode. Taken together bus 7 (mode #7 (λ 7)) and 23(mode #23 (λ 23)) are swing buses (modes) and among which bus 7(mode#7) is the critical bus. This is used in this work to measure the improvement to the security of the case study power system when the UPFC device is installed. In this work mode #7 is associated with bus 7 and mode 23 is associated with bus 23. In the analysis carried out in this chapter, the voltage trajectories at bus 7 and 23 were used in describing the responses to the power system to contingencies either with the UPFC or without the UPFC installed.
Transmission line outage contingency without the UPFC FACTS device installed Transmission line outages increases line impedance and weaken inter connection. Due to the increase in line reactance, extra reactive power is needed in other to maintain the voltage at the load buses. Here, the transmission outage simulation is performed by opening the line between bus 31 and bus 29 and reclosing it after five cycles. The circuit breaker in the SIMULINK library is configurable. The circuit breaker between bus 31 and 29 is configured to open in 1 second and reclose after five cycle.
The eigenvalue computation program is called during the simulation to compute the system eigen value, damping ratio and participation factor at the system buses. The power flow program is activated to carry out power flow solution of the current state of the power system. The result of the eigen value analysis is listed in Table 5.
Almost all the real part of the complex eigen value listed in Table 5 lie on the right half of the S plan. That are the real parts of the complex eigenvalue are almost all positive. This is an indication that the system is unstable. The damping ratios of the eigen value are very small. The negative value of most of the damping ratios is a further indication of the instability of the system. Bus 7 shows the most negative (smallest) damping ratio (being the weakest bus even at steady state) the damping ratio of most of the buses in the power system during the disturbance are below the 5% minimum and the 0.2 damping threshold. Table 6 gives the output of the Power flow solution carried out by the load flow software using the system disturbance data. The listing in Table 5 confirms the information from the eigen value analysis. The values in Table 6 show that there is serious voltage degradation at the buses of the power system. The voltages in most of the buses are degraded. The eigen value and the damping ratio indicate that the power system is unstably. This means that voltage at nodes of the power system is oscillating.
| S/n | Facts controllers | Technical contribution |
|---|---|---|
| 1 | Unified power flow controller (UPFC) |
|
| 3 | Static VAR compensator (SVC, TCR, TSC) |
|
| 4 | Thyristor controlled series compensator (TCSC/ TSSC) |
|
| 5 | Static synchronous series compensator (SSSC) |
|
Table 1: FACTS controllers and and their technical contribution.
| Firing Angle (o) | Switching States of the six thyristors for the rectifying stage | |||||
|---|---|---|---|---|---|---|
| S1 | S2 | S3 | S4 | S5 | S6 | |
| 0° | 1 | 0 | 0 | 0 | 0 | 1 |
| 60° | 1 | 1 | 0 | 0 | 0 | 0 |
| 120° | 0 | 1 | 1 | 0 | 0 | 0 |
| 180° | 0 | 0 | 1 | 0 | 0 | 0 |
| 240° | 0 | 0 | 0 | 1 | 1 | 0 |
| 300° | 0 | 0 | 0 | 1 | 1 | 1 |
| 360° | 1 | 0 | 0 | 0 | 0 | 0 |
| 420° | 1 | 1 | 0 | 0 | 0 | 0 |
| 480° | 0 | 1 | 1 | 0 | 0 | 0 |
| 540° | 0 | 0 | 1 | 1 | 0 | 0 |
| 600° | 0 | 0 | 0 | 1 | 1 | 0 |
| 660° | 0 | 0 | 0 | 0 | 1 | 1 |
| 720° | 1 | 0 | 0 | 0 | 0 | 1 |
Table 2: The switching ON and OFF of each thyristor for the rectifying stage.
| Firing Angle (o) | Switching States of the six thyristors for the inverting stage | |||||
|---|---|---|---|---|---|---|
| S12 | S21 | S13 | S14 | S15 | S16 | |
| 0° | 1 | 1 | 1 | 0 | 0 | 0 |
| 60° | 0 | 1 | 1 | 1 | 0 | 0 |
| 120° | 0 | 0 | 1 | 1 | 1 | 0 |
| 180° | 0 | 0 | 0 | 1 | 1 | 1 |
| 240° | 1 | 0 | 0 | 0 | 1 | 1 |
| 300° | 1 | 1 | 0 | 0 | 0 | 1 |
| 360° | 0 | 0 | 0 | 0 | 0 | 0 |
Table 3: The switching ON and OFF of each thyristor for the inverting stage.
| S/N | Bus # | Eigenvalue(λ) | Damping Ratio(ς) | Participation factor (%) |
|---|---|---|---|---|
| 1 | 1 | - 5.5957 ± j10.3330 | 0.4762 | 0.0102 |
| 2 | 2 | -2.325 ± j8.0321 | 0.2781 | 2.0018 |
| 3 | 3 | -5.6837 ± j10.3601 | 0.481 | 0.2146 |
| 4 | 4 | -2.4892 ± j10.8650 | 0.2233 | 10.1575 |
| 5 | 5 | -0.4087 ± j0.8293 | 0.4421 | 0.0625 |
| 6 | 6 | -0.8922 ± j3.013 | 0.2842 | 3.1174 |
| 7 | 7 | -5.3063 ± j10.3295 | 0.2233. | 0.0625 |
| 8 | 8 | -5.1617 ± j11.2755 | 0.4162 | 0.0378 |
| 9 | 9 | -0.4759 ± j0.5616 | 0.6465 | 0.0933 |
| 10 | 10 | -04164 ± j0.6618 | 0.5325 | 0.0536 |
| 11 | 11 | -2.0922 ± j7.914 | 0.2562 | 2.0341 |
| 12 | 12 | -1.1731 ± j4.1051 | 0.2751 | 4.321 |
| 13 | 13 | -0.8042 ± j2.9632 | 0.2623 | 0.7326 |
| 14 | 14 | -1.1843 ± j3.845 | 0.2942 | 3.0072 |
| 15 | 15 | -1.1012 ± j3.1752 | 0.3283 | 0.4136 |
| 16 | 16 | -0.9499 ± j3.5917 | 0.2552 | 2.0018 |
| 17 | 17 | -4.0428 ± j5.80451 | 0.5716 | 1.4172 |
| 18 | 18 | -5.5160 ± j5.22030 | 0.7108 | 8.3066 |
| 19 | 19 | -3.7688 ± j6.0058 | 0.5315 | 3.4172 |
| 20 | 20 | -3.2505 ± j82795 | 0.36543 | 0.9847 |
| 21 | 21 | -2.8394 ± j7.8648 | 0.3396 | 2.6731 |
| 22 | 22 | -2.6431 ± j8.0318 | 0.3126 | 0.9874 |
| 23 | 23 | -2.9202 ± j7.7275 | 0.3536 | 12.4678 |
| 24 | 24 | 0.0788 ± j3.4342 | -0.3421 | 0.0625 |
| 25 | 25 | 0.1865 ± j4.0072 | -0.0482 | 3.1174 |
| 26 | 26 | 0.2108 ± 3.3319 | -0.0569 | 0.0625 |
| 27 | 27 | 0.0984 ± j2.7934 | -0.1867 | 12.4678 |
| 28 | 28 | 0.3012 ± j4.4310 | -0.3065 | 0.0933 |
| 29 | 29 | 0.0567 ± j4.0173 | -0.0768 | 0.0536 |
| 30 | 30 | 0.1684 ± j3.1605 | -0.1347 | 0.0625 |
| 31 | 31 | 0.2123 ± j5.0876 | 0.3675 | 3.1174 |
| 32 | 32 | 0.0478 ± j3.0309 | -0.211 | 0.0625 |
| 33 | 33 | 0.5426 ± j7.3025 | 0.02137 | 12.4678 |
| 34 | 34 | 0.0647 ± j3.2253 | 0.0135 | 0.0933 |
| 35 | 35 | 0.0713 ± j3.3427 | -0.0424 | 0.0536 |
| 36 | 36 | -0.7248 ± j2.8783 | 0.1135 | 0.0625 |
| 37 | 37 | 0.0014 ± j2.5144 | -0.0057 | 3.1174 |
| 38 | 38 | 0.1912 ± j5.808 | -0.0332 | 0.0625 |
| 39 | 39 | -0.1953 ± j5.716 | -0.0348 | 12.4678 |
| 40 | 40 | 0.088 ± j4.002 | -0.022 | 0.0933 |
| 41 | 41 | 0.4302 ± j3.6798 | -0.3107 | 0.0536 |
| 42 | 42 | 0.0271 ± j2.0154 | -0.0313 | 0.0625 |
| 43 | 43 | -0.1212 ± j3.7982 | -0.0324 | 3.1174 |
| 44 | 44 | 0.0753 ± j3.3835 | -0.0256 | 0.0625 |
| 45 | 45 | 0.0853 ± j4.1012 | -0.0227 | 12.4678 |
| 46 | 46 | 0.0335 ± j6.852 | -0.0015 | 0.0933 |
| 47 | 47 | 0.0658 ± j3.7896 | -0.0016 | 0.0536 |
| 48 | 48 | 0.3012 ± j5.3186 | -0.4089 | 0.0453 |
Table 4: Eigenvalues, damping ratio and bus participation factor for the base case of the case study power system without contingency.
| S/N | Bus | Eigen value(λ) | Damping Ratio(ς) |
|---|---|---|---|
| 1 | 1 | 0.1123 ± j7.0876 | 1.0675 |
| 2 | 2 | 0.0448 ± j4.0309 | -0.011 |
| 3 | 3 | 0.5526 ± j7.3025 | 0.02437 |
| 4 | 4 | 0.0547 ± j3.2853 | 0.0135 |
| 5 | 5 | 0.0413 ± j3.3227 | -0.0124 |
| 6 | 6 | -0.5248 ± j3.8483 | 0.1035 |
| 7 | 7 | 0.0014 ± j2.5144 | -0.0057 |
| 8 | 8 | 0.1912 ± j5.808 | -0.0332 |
| 9 | 9 | 0.1953 ± j5.716 | -0.0348 |
| 10 | 10 | 0.088 ± j4.002 | -0.022 |
| 11 | 11 | 0.4302 ± j3.6798 | -0.3107 |
| 12 | 12 | 0.0281 ± j2.0154 | -0.0013 |
| 13 | 13 | -0.1212 ± j3.7982 | -0.0324 |
| 14 | 14 | 0.0953 ± j3.3835 | -0.0256 |
| 15 | 15 | 0.0883 ± j4.0012 | -0.0225 |
| 16 | 16 | 0.0335 ± j6.852 | -0.005 |
| 17 | 17 | 0.0658 ± j3.7896 | -0.0017 |
| 18 | 18 | 0.2012 ± j4.3186 | -0.4067 |
| 19 | 19 | 0.4029 ± j3.1139 | -0.0108 |
| 20 | 20 | 0.0079 ± j2.0146 | -0.2889 |
| 21 | 21 | -0.1176 ± j3.1134 | -0.4011 |
| 22 | 22 | 0.2021 ± j2.0343 | -0.0003 |
| 23 | 23 | 0.3964 ± j4.1342 | -0.2987 |
| 24 | 24 | 0.0788 ± j3.4342 | -0.3421 |
| 25 | 25 | 0.1865 ± j4.0072 | -0.0482 |
| 26 | 26 | 0.2108 ± 3.3319 | -0.0569 |
| 27 | 27 | 0.0984 ± j2.7934 | -0.1867 |
| 28 | 28 | 0.3012 ± j4.4310 | -0.3065 |
| 29 | 29 | 0.0567 ± j4.0173 | -0.0768 |
| 30 | 30 | 0.1684 ± j3.1605 | -0.1347 |
| 31 | 31 | 0.2123 ± j5.0876 | 0.3675 |
| 32 | 32 | 0.0478 ± j3.0309 | -0.211 |
| 33 | 33 | 0.5426 ± j7.3025 | 0.02137 |
| 34 | 34 | 0.0647 ± j3.2253 | 0.0135 |
| 35 | 35 | 0.0713 ± j3.3427 | -0.0424 |
| 36 | 36 | -0.7248 ± j2.8783 | 0.1135 |
| 37 | 37 | 0.0014 ± j2.5144 | -0.0057 |
| 38 | 38 | 0.1912 ± j5.808 | -0.0332 |
| 39 | 39 | -0.1953 ± j5.716 | -0.0348 |
| 40 | 40 | 0.088 ± j4.002 | -0.022 |
| 41 | 41 | 0.4302 ± j3.6798 | -0.3107 |
| 42 | 42 | 0.0271 ± j2.0154 | -0.0313 |
| 43 | 43 | -0.1212 ± j3.7982 | -0.0324 |
| 44 | 44 | 0.0753 ± j3.3835 | -0.0256 |
| 45 | 45 | 0.0853 ± j4.1012 | -0.0227 |
| 46 | 46 | 0.0335 ± j6.852 | -0.0015 |
| 47 | 47 | 0.0658 ± j3.7896 | -0.0016 |
| 48 | 48 | 0.3012 ± j5.3186 | -0.4089 |
Table 5: Eigenvalue and damping ratio of the case study power system buses during the outage of the transmission line without UPFC installed.
| Bus | Voltage Magnitude (p.u) | Voltage Angle (rad) | P (p.u) | Q (p.u) |
|---|---|---|---|---|
| Erunkan | 0.96385 | -0.08522 | 0 | 0 |
| AES | 1 | 0.01186 | 0.8 | 1.4596 |
| Afam | 1 | 0.28814 | 0.4 | 0.5759 |
| Aiyede | 0.94324 | -0.16608 | -0.9 | -0.3 |
| Ajaokuta | 0.94369 | -0.1356 | -1.2 | -0.6 |
| Akangba | 0.83385 | -0.28704 | -1.2 | -0.6 |
| Eyaen | 0.70414 | -0.30615 | -0.92965 | -0.61976 |
| Alaide | 0.79873 | -0.24259 | -1.9936 | -0.54825 |
| Alaoji | 1 | 0.19057 | 0.8 | 1.1472 |
| Benin | 0.93933 | -0.04068 | 0 | 0 |
| Benin North | 0.8147 | -0.15431 | 0 | 0 |
| Calabar | 1 | 0.33952 | 1.3 | 0.39252 |
| Damaturu | 0.90812 | -0.15563 | -2 | -0.67 |
| Delta PS | 1 | 0.00659 | 0.7 | 1.0556 |
| Egbema | 1 | 0.15276 | 0.8 | 0.22291 |
| Egbin | 1 | -0.03469 | 3 | 2.5285 |
| Ganmo | 1 | -0.14565 | 0 | 0.80911 |
| Gerugu | 1 | -0.08815 | 0.5 | 0.5232 |
| Gombe | 0.927 | -0.10581 | 0 | 0 |
| Ikeja West | 0.93026 | -0.13954 | -1.6 | -0.7 |
| Ikot-Abasi | 0.95609 | 0.20727 | 0 | 0 |
| Birni Kebbi | 0.84924 | -0.74031 | -3 | -0.45 |
| Ikote Ekpene | 0.95605 | 0.20727 | 0 | 0 |
| Jaligo | 0.96198 | -0.04476 | 0 | 0 |
| Jebba | 0.97663 | -0.13617 | 0 | 0 |
| Jebba GS | 1 | -0.05607 | 0.8 | 0.18448 |
| Jos | 0.91383 | -0.12054 | 0 | 0 |
| Kaduna | 0.96175 | -0.08415 | 0 | 0 |
| Kainji | 1 | -0.38491 | 0.8 | 2.4916 |
| Kano | 0.9618 | -0.08416 | 0 | 0 |
| Katampe | 0.99297 | -0.02964 | 0 | 0 |
| Kwagwalada | 0.98672 | -0.05967 | 0 | 0 |
| Lokoja | 0.97338 | -0.15167 | -1 | 0.3 |
| Maidugri | 0.90816 | -0.15563 | 0 | 0 |
| Makurdi | 0.85474 | -0.17746 | 0 | 0 |
| New Haven | 0.86669 | -0.07376 | -1.5 | -0.45 |
| New Haven South | 0.85869 | -0.02291 | 0 | 0 |
| Okpai | 1 | 0.05204 | 0 | 0.46886 |
| Omoku | 1 | 0.23333 | 0.8 | -0.04807 |
| Omotosho | 0.9337 | -0.08987 | 0 | 0 |
| Onitsha | 0.95308 | 0.05696 | 0 | 0 |
| Oshogbo | 0.9424 | -0.14688 | -1 | -0.58 |
| Owerri | 0.98287 | 0.13466 | 0 | 0 |
| Papalanto | 1 | -0.11659 | 0.8 | 1.198 |
| Port-Harcourt | 1 | 0.42901 | 1.4 | -0.04144 |
| Sakete | 0.93031 | -0.13955 | 0 | 0 |
| Sapele | 1 | 0.2362 | 5 | 1.2562 |
| Shiroro | 1 | 0 | 3.0826 | 0.65548 |
| Yola | 0.96193 | -0.04475 | 0 | 0 |
Table 6: Result of power flow solution of case study power system for the outage of transmission line without UPFC installed.
Contingencies with the UPFC FACTS device installed
The transmission line outage contingency is simulated with the UPFC installed at locations identified using the genetic algorithm. The disturbance data resulting from the simulation of the contingencies (extracted from the MATLAB Workspace) is used with the MATLAB load flow program module to carry out load flow solution.
For transmission line outage
Comparison of the trajectories of the voltages at bus 7 and 23 as a result of the transmission line outage contingency (with and without the UPFC FACTS device installed), are shown on Figures 9 and Figure 10 respectively.

Figure 9: Comparison of Voltage trajectory at bus 23 during transmission line outage contingency with and without UPFC FACTS device installed.

Figure 10: Comparison of Voltage trajectory at bus 7 during power plant outage contingency with and without UPFC FACTS device installed.
For power plant outage with UPFC FACTS device installed
The trajectories of the voltages at bus 7 and 23, as a result of the power plant outage contingency, are shown on Figure 11 and 4 respectively.

Figure 11: Comparison of Voltage trajectory at bus 23 during power plant outage contingency with and without UPFC FACTS device installed.
Conclusion
It can be observed that the UPFC helped damp out oscillations in the power system resulting from the simulated contingency. This can be noticed from how the oscillations at buses 7 and 23 resulting from power plant outage contingency are damped out. Referring to Figure, installation of the UPFC FACTS device damped out voltage oscillations at bus 23 in about 1.3458 seconds. Whereas without the UPFC device, the base power system could not effectively handle the contingency. With the base power system, the amplitude of the oscillation was reduced at around 9 seconds. Even with that the voltage level was seriously degraded. The voltage was degraded to around 0.289 p. u. This scenario shows serious negative impact on the ability of the power system to continue to provide electricity to customers at minimum accepted level of quality. This is an indication of the vulnerability of the system. Whereas in the case of the power system with the UPFC installed, the voltage dip resulting from the contingency was compensated for. This ensured the restoration of the voltage level following the contingency, thus ensuring security of the power system. Similarly looking at voltage trajectory at bus 7, voltage oscillations was damped out in about 1.4466second when the UPFC was installed in the power system. Whereas the base power system reacted to the contingency but could not effectively suppress the instability and restore the power system to normal operation for the duration of the simulation.
References
- Wood AJ, Wollenberg BF (1996) Power generation, operation, and control. John Wiley & Sons, 2nd Edn, New York, USA.
- Ifeanyi OP, John OK (2012) Power flow and contingency assessment of the existing 330 kV nigeria power grid to cope with the Proposed increase in power generation in 2014. Int J Eng Res Technol 1:1-10.
- Ibe OG, Akwukwaegbu IO, Mmadu UI, Nwaogwugwu, Nnanyereugo C (2015) Voltage stability improvement of power transmission system in nigeria using tcsc. US Open Electr Electron Eng J 1:1-15.
- Adejumobi IA, Ojetola OO, Adekoya OD (2017) Evaluation of power system contingency using performance index. J Eng Res Dev 1:105-114
- Anierobi CC, Ezechukwu OA, Ezennaya SO, Akpe VA, Aghara JVC (2015) Optimal power flow with security constraint for 330kv nigeria power network using power world simulator. Int J Eng Manag Res 5:497-503.
- Huang G, Zhu T (2001) TCSC as a transient voltage stabilizing controller. Power Engineering Society Winter Meeting 2: 628-633.
- Lu Y, Abur A (2002) Static security enhancement via optimal utilization of thyristor-controlled series capacitors. IEEE Trans Power Syst 17: 324-329.
- Visakha K, Thukaram D, Jenkins L (2005) Improvement of system security with unified-powerflow controller at suitable locations under network contingencies of interconnected systems. EE Proc Gener Transm Distrib 152: 682-690
- Kannan S, Slochanal SMR, Jawahar S (2004) Genetic algorithm approach to generation expansion planning under deregulated environment. J Energy Environ 3:1-13.
- Menniti D, Pinnarelli A, Scordino N, Sorrentino N (2007) UPFC sizing by means of an economically correct secure economic dispatch in a deregulated power market scenario. Int Trans Electr Energy Systn18: 65-78.
- Chang N C, Su J F, Du ZB (2005) Developing a voltage-stability-sonstrained security assessment system Part 1: determination of power system voltage security operation limits. Transm Distrib. Conf Expo 1-5
- Milano F, Canizares A, Invernizzi M (2003) Multiobjective optimization for pricing system security in electricity markets. IEEE Trans Power Syst 18: 596-604.
- Dimitrios  S, Nikolaos A (2002) A machine learning toolkit for power systems security analysis. Transm Distrib Energy Convers 1-6.
- Agreira CI, Erreira CM, Pinto JA , Maciel BF (2003) Contingency screening and ranking algorithm using two different sets of security performance indices. IEEE Bologna Power Tech Conference 4: 408-411.
- Jian Z, Yiwei Z, Feng CA (2002) A comprehensive and practical approach for power system security assessment. Int Conf Power Syst Technol 2336-2339.
- Liu H, Amit B, Venkatasubramanian VM (2000) Fast voltage security assessment method using adaptive bounding. IEEE Trans Power Syst 15: 1137-1141.
- Musirin I, Rahman TKA (2003) Hybrid neural network topology (HNNT) for line outage contingency ranking. Natl Power Eng Conf 25060292.
- Miller  J (2011) Power system optimization: Smart grid, demand dispatch and microgrids.
- Song Y H (1999) Modem Optimisation Techniques in Power Systems. Springer Science &Business Media 20.
- Gandhar A, Singh B, Khanna R (2004) Role of UPFC in power system. Impending power demand and innovative energy paths 9-17.
- Moghavvemi M, Faruque MO (1999) Estimation of voltage collapse from local measurement of line power flow and bus voltages. Int Conf Electr Power Eng.
- Moghovvemi M, Faruque O (1998) Real-time contingency evaluation and ranking technique. Gener Transm Distrib 145: 517-524.
- Canizares C A, Uzonic E, Reeve J (2006) Transient stability and power flow model of the unified power flow controller for various control strategies. Int J Energy Technol Policy 4.
- Uzonic E, Canizares CA, Reave J (1997) Fundamental frequency model of static synchronous compensator. 49-54.
- Montano AM, Ruiz EY, Morataya JC, Castillo JA (2006) Stability analysis for the electrical integration of ecuador, colombia and panama. IEEE PES Transm Distrib Conf Expo.
- Gao B, Morison GK, Kundur P (1992) Voltage stability evaluation using modal analysis. IEEE Trans Power Syst 7: 1529-1542.
- Rangasamy S, Manickam P (2014) Stability analysis of multimachine thermal power systems using the nature-inspired modified cuckoo search algorithm, Turk J Elec Eng & Comp Sci 22: 1099-1115.
Citation: Amadi KC (2021) Power System Security Optimization of the Nigerian 330kv Transmission Network. Innov Ener Res, 10: 240. DOI: 10.4172/2576-1463.1000240
Copyright: © 2021 Amadi KC. This is an open-access article distributed under the terms of the Creative Commons Attribution License, which permits unrestricted use, distribution, and reproduction in any medium, provided the original author and source are credited.
Select your language of interest to view the total content in your interested language
Share This Article
Recommended Journals
Open Access Journals
Article Tools
Article Usage
- Total views: 4018
- [From(publication date): 0-2021 - Dec 09, 2025]
- Breakdown by view type
- HTML page views: 3028
- PDF downloads: 990