Precipitation and Temperature Trend Analysis in Mekelle city, Northern Ethiopia, the Case of Illala Meteorological Station
Received: 02-Dec-2015 / Accepted Date: 21-Jan-2016 / Published Date: 24-Jan-2016 DOI: 10.4172/2157-7617.1000324
Abstract
Climate change has a significant impact on the environment as well as the social, economic. Tigray is one of the sensitive regions to climate variation particularly to precipitation and rainfall changes. In this study, we analysis trends in precipitation and temperature at annual, seasonal and monthly time scales for the periods of 1995-2014 for the Illala station which is located in Mekelle Agricultural research center, Tigray region. Instat+ software were used for analyzing the statistics as well as the excel spreadsheet and we were use the Non-parametric tests (such as Mann- Kendall and Sen’s Slope), linear regression, cumulative deviation curve techniques were used to determine climatic trends. The mean minimum temperature ranges between 10.2°C and 12.6°C, while, the mean maximum temperature varies between 22.3°C and 26.7°C From the analysis the monthly coefficient of variation (CV%) for both maximum and minimum temperature ranging from (6.9% in Oct) to (18.7% in Dec) for the average monthly rainfall ranging from 4.9% to 26% of coefficient of variation. from the analysis we were found that the monthly trend of precipitation which were May, June and July have an decreasing trend. While the both maximum and minimum temperature were found on the months of June, September and December the climate trend results showed that there is no negative or positive statistically significant trend in the study area, despite of slight precipitation decrease in the area. The period of 1995-2014. Which are not statistically significant annually and seasonally temperature data showed slight increase annually even though results are not statistically significant during the period of 1995-2014.
Keywords: Climate variation; Precipitation; Mann-Kendall
10484Introduction
Climate of the Earth varies across temporal and spatial scales throughout the planet. Large areas of the earth represent variability as a part of their normal climate over both short and long time periods [1,2]. Climatic variability can be described as the annual difference in values of specific climatic variables within averaging periods such as a 30-year period [3]. These climatic variations will have unexpected consequences with respect to frequency and intensity of precipitation and temperature variability for many regions of the Earth. Air temperature and precipitation are principle element of weather systems, so that examination of their behavior is important for understanding of climate variability because both are highly variable spatially and temporarily at different local, regional and global scales. For the prediction of future climate conditions, level of variability of these two weather elements must be examined and understood. Therefore, recently, the focus on climate variability bases mostly on the detection of trends in instrumental records of precipitation and temperature. Several researches of climatic trends have recently been conducted on rainfall and temperature data at different periods of records throughout the world. Ethiopia is among those areas in the world most likely to experience climatic variations for short and long time periods. Inter-annual variability of precipitation and temperature in Ethiopia is relatively large from the annual mean. As a result of climatic variations, natural resources of the country, such as vegetation, and the existing resources are easily damaged by changes. In this study, we examined precipitation and air temperature trends in Mekelle Illala station for the 1995-2014 time scale. The study area, which is located in the Tigray region (Figure 1). Annual mean precipitation is around 530 mm. The aim of this study is to evaluate precipitation and temperature trends in Mekelle, Illala station To be able achieve our goals we conduct a thorough examination of climatic data from 1995-2014 in order to identify seasonality, variability, trends and other characteristics of precipitation and temperature at different time scales. The main purpose of this study is the detection of significant trends or fluctuations in the annual and seasonal climatic conditions.

Figure 1: Location map of the study area.
Materials And Methods
Area description
Mekelle is the capital city and commercial center of the Tigray National Regional State in the northern Ethiopia (Figure 1). The town is located at 39°33'E longitude and 13°32'N latitude, situated in the extension of the central highlands of Ethiopia. The altitude of Mekele is between 1965 m and 2220 m above sea level. The town is bounded by mountain ranges in the east and north. Climatologically, the area is classified as "Woina Dega" (temperate) with an effective temperature between 14°C and 20°C (Ethiopian Mapping Agency, EMA, 1981), which for most of the time is comfortable. It has a moisture index (P/ ET) ranging in between 0.25 and 0.5, which indicates moderately dry area. The altitude varies from 2220 m at eastern side to 1965 m in the northwestern side of the town (lower reach of Illala River) [4].
Data collection
Observational data for daily maximum temperature, daily minimum temperature, daily mean temperature and annual rainfall recorded at Mekelle agricultural research center, Illala meteorological stations. In the region have been obtained different class of meteorological stations. One of them is Mekelle agricultural research center, Illala station. Temperature and rainfall data were selected parameters because of our agricultural system are highly sensitive to rainfall and temperature. In this study, the annual, seasonal and monthly precipitation totals and temperature measured at the Illala meteorological observation station were used for the period of 1995-2014.
Method of data analysis
Daily precipitation and temperature data were first calculated as monthly and annually on the excel spreadsheet. Then the average precipitation amount was computed over the 20-year period to be able to examine precipitation statistics which is commonly or generally defined as distance from the average. The trend detection methods were applied to annual and monthly precipitation and temperature data. The Thom test resulted homogenous and statistically significant at 95% confidence limit for precipitation and temperature. Thus, time series can be taken as homogeneous during the study period. Firstly, regression models were created in order to detect linear trends of precipitation and temperature data. Secondly, statistical trend detection methods are applied to detect inconsistencies and non-homogeneities (both gradual trends and abrupt changes/shifts) in the data series of climatic variables. Therefore, the determination of abrupt changes or shifts (based on the mean values) in the data series is emphasized in the statistical trend analyses. In this paper, standard monthly, seasonal and annual precipitation and temperature data were analyzed for trends using Mann Kendall (MK) and Sen’s slope (SS) estimator none parametric tests. This technique is based on the detection of trends and change point(s) and attaching to it a probability significance level in a time series. This test has been widely used climatologic data analysis [5-7]. The test examines whether a random response variable monotonically increases or decreases with time. It is a rank based procedure, resistant to the influence of extremes, and useful for skewed data and has a higher power than many other commonly used linear tests [6,8,9].
Result and Discussion
Precipitation trends
The descriptive statistics of annual rainfall such as the coefficient of variation (CV), coefficients of skewness (Cs) and coefficients of kurtosis (Ck) are presented in Table 1. In the study area for the annual totals as well as for the months the coefficient of variation (CV) was greater than CV=5%.The highest values of coefficient of kurtosis were found for the October. Despite the low values for the degree of skewness were found in August (-0.2). The CV values decline from the April, May, June and July with a maximum value of 26% at the month of February. The mean annual rainfall of the study region is relatively low, ranging from 450 mm to 600 mm. In general, the standard deviation is high, ranging at annual were found 140 mm. while the monthly standard deviation varies from 1.77 mm to 84 mm. The precipitations in the study area were not evenly distributed throughout the growing months. The average annual precipitation is influenced by the planetary wind pattern and topography, the evaporation shows peak values during the summer months and low values during the winter months. The maximum monthly precipitation occurs in July and August and minimum monthly precipitation occurs in the dry months. On the other hand, maximum monthly temperature occurs starting from April until mid- June. Statistical properties of the annual, seasonal, and monthly rainfall series were tested and presented in Table 1. The results showed that the data were normally distributed despite of slight positive skewness. According to the results, almost all months have represented higher CV (coefficient of variation) which means that March and October, but all months have homogenous character in terms of rainfall variations. The rest of the months depicted similar rainfall pattern representing similar variation during the study period [10]. Seasonal distribution of mean precipitation in the study area is shown Figure 2 on the average, most precipitation occurs during the JJAS months with 562 mm total, and June, July, August and September are commonly the months with the highest observed precipitation.
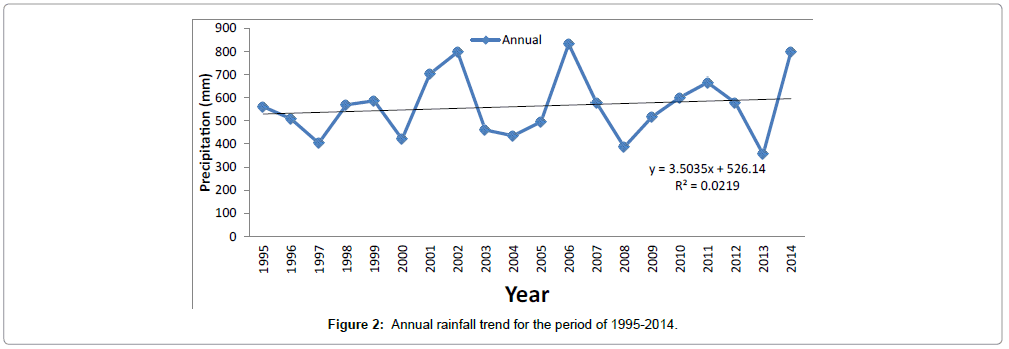
Figure 2: Annual rainfall trend for the period of 1995-2014.
| Annual | Jan | Feb | Mar | Apr | May | Jun | Jul | Aug | Sep | Oct | Nov | Dec | |
|---|---|---|---|---|---|---|---|---|---|---|---|---|---|
| N | 20 | 20 | 20 | 20 | 20 | 20 | 20 | 20 | 20 | 20 | 20 | 20 | 20 |
| Mean | 562 | 4.485 | 1.9 | 36 | 28 | 21.9 | 30.9 | 187.9 | 207.9 | 30.01 | 3 | 3.8 | 0.9 |
| Std.E ofmean | 31.3 | 2.3 | 1 | 18.5 | 5.5 | 4 | 5 | 18 | 12 | 6 | 2 | 2 | 0.4 |
| Median | 566 | 0 | 0 | 17.5 | 25.7 | 24.1 | 29.2 | 193.2 | 207.9 | 23.2 | 0 | 0 | 0 |
| Std. Deviation | 140 | 10 | 5 | 83 | 24 | 17 | 24 | 84 | 52 | 26 | 8 | 7.7 | 1.77 |
| CV(%) | 24.9 | 23.3 | 26.0 | 23.0 | 8.7 | 8.0 | 7.8 | 4.9 | 25.2 | 8.5 | 24.8 | 20.8 | 20.5 |
| Skewness | 0.48 | 2.4 | 2.61 | 3.9 | 0.9 | 1.0 | 1 | 0.03 | -0.2 | 0.60 | 2.8 | 2.3 | 2 |
| Kurtosis | -0.7 | 4 | 5 | 14 | -0.1 | 1.1 | 0.3 | -1.2 | -0.3 | -1.0 | 6.68 | 4.69 | 3.92 |
| Minimum | 476.9 | 0 | 0 | 0 | 0 | 0 | 2.6 | 63.1 | 100 | 0.6 | 0 | 0 | 0 |
| Maximum | 832.4 | 37.2 | 18.2 | 383 | 84.7 | 69.4 | 92.7 | 341 | 299 | 75.5 | 28.6 | 29.7 | 6.7 |
| Mean, Dev | 114 | 7.09 | 3.2 | 38.5 | 20 | 13 | 19 | 76.2 | 41.9 | 22.6 | 4.32 | 4.32 | 1.36 |
Table 1: Statistical summary of monthly precipitation for Illala station.
A description of the applied statistical test procedure is given in Table 2. Statistically, significant trends are not found for precipitation on monthly basis, but the trend on May, June and July (-0.150,-0.081 and -1.082) respectively. But this result is not statistically significant at 95% confidence limit during the period of 1995-2014. On the other hand, annual precipitation trend is positive but the result is not statistically significant at 95% confidence limit (MK=0.15) during the period of 1995-2014. Trend analyses were also conducted on monthly and seasonal precipitation data (Table 2). Precipitation patterns for seasons do not represent significant positive or negative trends at 95% confidence level. However there is considerable amount of precipitation decrease for winter which is statistically significant at 90% confidence limit during the period of 1995-2014. The cumulative deviations of rainfall pattern in the study area for the periods of 1995-2014 (Figure 3). Results reveal that a cyclic pattern of variations with alternating drier and wetter years is suggested. An increase of annual precipitation up to the early 1997s was followed by decrease until 2002s. However last three years have showed slight precipitation increase and drastically decreased in 2006. To be able to determine normal, wet and dry years, seasons and moths, percentiles were computed. Rainfall amount was considered normal between P25 and P75, on the other hand, P25 was considered as drier than normal and called low abnormal year, season or moth. Similarly over P75 was accepted as wet year, season or month for the study area.
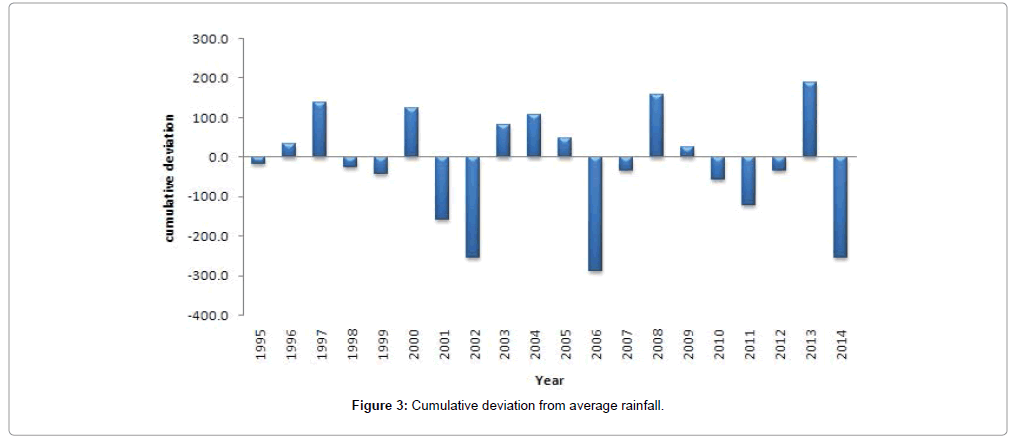
Figure 3: Cumulative deviation from average rainfall.
| Annual Rainfall | Maximum Temperature | Minimum temperature | ||||
|---|---|---|---|---|---|---|
| Month | ZMK | Slope | ZMK | Slope | ZMK | Slope |
| January | -0.76 | 0.000 | 0.03 | 0.001 | 0.04 | 0.002 |
| February | 0.04 | 0.000 | 0.45 | 0.010 | 0.41 | 0.011 |
| March | 0.48 | 0.294 | 0.39 | 0.020 | 0.35 | 0.021 |
| April | 1.24 | 1.142 | 1.48 | 0.034 | 1.43 | 0.034 |
| May | -0.15 | -0.150 | 0.06 | 0.001 | 0.06 | 0.010 |
| June | -0.03 | -0.081 | -0.24 | -0.013 | 0.23 | -0.013 |
| July | -0.33 | -1.082 | 1.96 | 0.069 | 1.8 | 0.070 |
| August | 0.68 | 1.713 | 0.39 | 0.011 | 0.33 | 0.011 |
| September | 1.72 | 2.288 | -0.51 | -0.017 | -0.03 | -0.017 |
| October | -1.59 | 0.000 | 1.18 | 0.034 | 1.45 | 0.034 |
| November | 0.96 | 0.000 | 1.24 | 0.026 | 1.3 | 0.025 |
| December | -0.17 | 0.000 | -0.09 | -0.003 | 0.05 | -0.003 |
Table 2: Monthly Mann-Kendall results of precipitation for the area .ZMK is Mann–Kendall trend test, Slope (Sen’s slope) is the change (days)/annual;
Temperature trends
Air temperature has crucial impact on the water cycle in the study area. So that analysis of trends in annual and monthly temperature data conducted for the periods of record 1995-2014. Figure 4 represents the mean annual maximum temperature and its trend in the period of under examination. Using a linear regression model, the rate of change is defined by the slope of regression line which in this case is about 0.018°C/20 yr. during the period of 1995-2014. This finding is not similar to global warming rate which is estimated 0.6°C for the past century. This result shows that approaching to global warming study has important impact on the regional climate in the study area for the last two decades statistically [11,12], significant trends are not found for maximum temperature data on annual and monthly basis, even though there are negative and positive trends for period of record (1995-2014) considered. Overall, annual maximum temperature trend is positive (increases) but this result is not statistically significant at 95% confidence limit (MK=1.66) during the period of 1995-2014. The increase in annual temperature observed in the study area is caused by increase in summer months, which compensate the slight decrease in the other seasons especially autumn months. Trends in annual minimum temperature were found a negative slope which is a decreasing trend (1995-2014) (Figure 5, Tables 3 and 4).
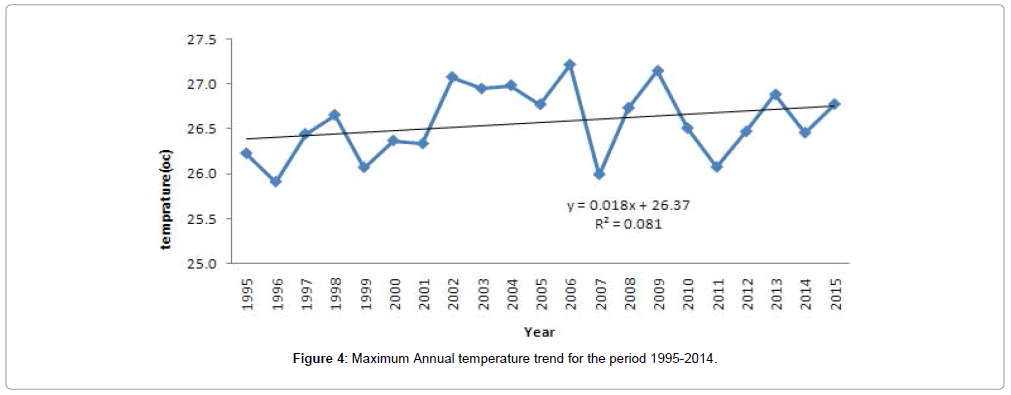
Figure 4: Maximum Annual temperature trend for the period 1995-2014.
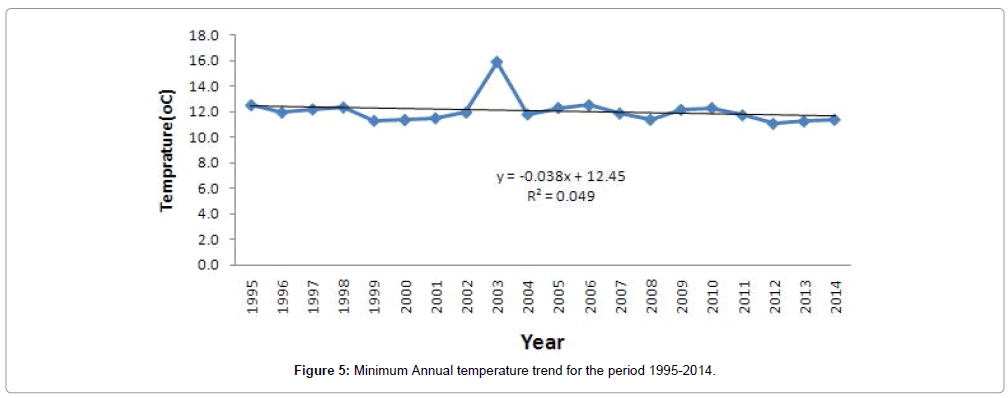
Figure 5: Minimum Annual temperature trend for the period 1995-2014.
| Jan | Feb | Mar | Apr | May | Jun | Jul | Aug | Sep | Oct | Nov | Dec | |
|---|---|---|---|---|---|---|---|---|---|---|---|---|
| N | 20 | 20 | 20 | 20 | 20 | 20 | 20 | 20 | 20 | 20 | 20 | 20 |
| Mean | 26 | 27 | 27 | 28 | 30 | 29 | 25.7 | 24.5 | 26.4 | 26. | 24.99 | 24.7 |
| Std.E of mean | 0.17 | 0.16 | 0.15 | 0.19 | 0.21 | 0.23 | 0.12 | 0.13 | 0.1 | 0.39 | 0.14 | 0.14 |
| Median | 25.7 | 27 | 27.5 | 28 | 29.2 | 29.4 | 25.4 | 24.6 | 26.4 | 26 | 25.1 | 24.8 |
| Std.Deviation | 0.81 | 0.73 | 0.69 | 0.66 | 0.88 | 1.00 | 1.06 | 0.53 | 0.63 | 1.81 | 0.66 | 0.64 |
| Cv(%) | 3.2 | 2.7 | 2.5 | 2.4 | 3.1 | 3.4 | 4.2 | 2.3 | 2.4 | 6.9 | 2.7 | 2.6 |
| Skewness | 0.35 | -0.3 | -0.8 | 0.23 | -0.6 | -1.2 | 0.81 | 0.11 | 0.04 | 3.14 | -0.94 | -0.11 |
| Kurtosis | -0.84 | -0.2 | -0.1 | -0.32 | 1.78 | -0.1 | -0.91 | -0.80 | 10.97 | 0.12 | 1.13 | -0.58 |
| Minimum | 27.7 | 25.4 | 25.6 | 26.7 | 27.1 | 26.3 | 24.2 | 23.7 | 25.3 | 23.5 | 23.1 | 23.7 |
| Maximum | 27.5 | 28.2 | 28.4 | 29.3 | 30.5 | 30.7 | 28.2 | 25.7 | 27.6 | 33.4 | 26 | 26 |
| Mean,Dev | 0.7 | 0.6 | 0.6 | 0.51 | 0.75 | 0.77 | 0.87 | 0.46 | 0.53 | 0.9 | 0.49 | 0.5 |
Table 3: Statistical summary of monthly maximum temperature for Illala station.
| Jan | Feb | Mar | Apr | May | Jun | Jul | Aug | Sep | Oct | Nov | Dec | |
|---|---|---|---|---|---|---|---|---|---|---|---|---|
| N | 20 | 20 | 20 | 20 | 20 | 20 | 20 | 20 | 20 | 20 | 20 | 20 |
| Mean | 8.9 | 4.5 | 12.13 | 14.3 | 14.3 | 13 | 13.6 | 13.5 | 11.81 | 11.27 | 10.37 | 8.57 |
| Std.E of mean | 0.27 | 0.25 | 0.25 | 0.16 | 0.19 | 2.06 | 0.11 | 0.13 | 0.20 | 0.17 | 0.37 | 0.35 |
| Median | 8.8 | 9.9 | 12.2 | 14.2 | 14.4 | 13.1 | 13.7 | 13.5 | 11.65 | 11.2 | 10.2 | 8.55 |
| Std.Deviation | 1.23 | 1.16 | 1.12 | 0.75 | 0.88 | 9.4 | 0.53 | 0.58 | 0.91 | 0.79 | 1.68 | 1.60 |
| Cv(%) | 13.9 | 11.8 | 9.3 | 5.2 | 6.2 | 4.2 | 3.9 | 4.3 | 7.8 | 7.1 | 16.2 | 18.7 |
| Skewness | 0.26 | -0.2 | -1.31 | 0.25 | -0.13 | 4.22 | 0.52 | 0.45 | 1.24 | 0.75 | 1.53 | 0.32 |
| Kurtosis | -0.6 | -0.6 | 2.47 | -0.7 | -0.49 | 15.9 | 0.14 | 0.03 | 1.42 | 2.29 | 2.52 | -0.63 |
| Minimum | 6.8 | 7.4 | 8.7 | 13.1 | 12.5 | 12.5 | 12.9 | 12.6 | 10.6 | 9.7 | 8 | 5.9 |
| Maximum | 11.6 | 11.9 | 13.8 | 15.7 | 16.1 | 15.3 | 15 | 15 | 14.3 | 13.6 | 15.4 | 11.9 |
| Mean, Dev | 1.07 | 0.98 | 0.81 | 0.61 | 0.73 | 4.12 | 0.42 | 0.48 | 0.69 | 0.55 | 1.17 | 1.38 |
Table 4: Statistical summary of monthly minimum temperature for Illala station.
Figure 6 shows the cumulative deviations of average temperature pattern in the study area for the periods of 1995-2014. Results reveal that a cyclic pattern of variations with alternating warming and cooling years is suggested. The last twenty years were characterized drastically decreased starting from 1999 of temperature up to the early 2007s and was followed by increase until 2008s.
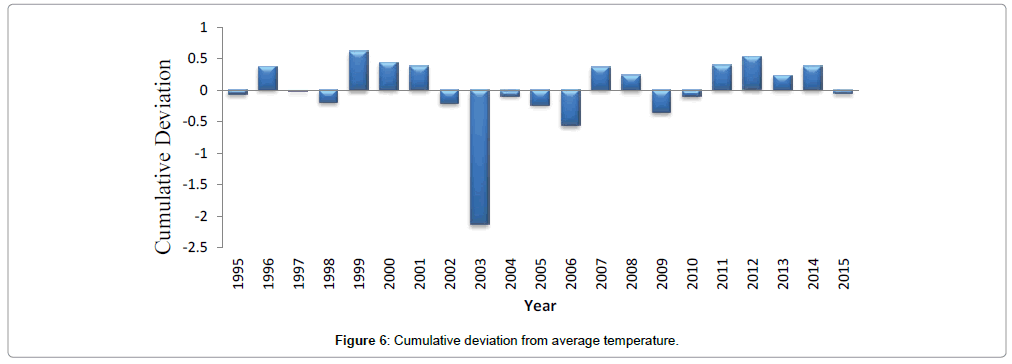
Figure 6: Cumulative deviation from average temperature.
Conclusion
This study investigated rainfall and temperature trend analysis in the Illala station, Mekelle Agriculture Research center. we were use 20 years of data. Results showed that all analyzed time-series, the Mann- Kendall test applied to the annual rainfall and temperature time-series showed statistical significance at p<0.05 or p<0.01 we were found that there is decreasing trend in the annual rainfall and were found an increasing trend or a positive trend in both the maximum and minimum temperature. But we conclude that the trend that found from the analysis not statically significant. In the annual rainfall analysis the higher CV were found in the month of February which is (26%). for the maximum and minimum temperature the coefficient of variation were found in October (CV=6.9%) and December (CV=18.7%) respectively. the monthly Mann-Kendall precipitation results were found negative at the months January, May, June, July, October and December while the rest are positives. In both the maximum and minimum temperatures were found all most all having a positive. As a recommendation for prediction of future climate conditions, level of variability of these two weather elements must be examined and understood. Temperature were slightly increasing when we compare to the global average temperature and the rainfall also decreased, shorten the length of growing period. And we were also observing irregularity of onset and cessation of rainfall. Therefore, we should work on the best of adaptation strategies for our agriculture system with the existing climate condition.
References
- Houghton J (1994) Global Warming, Cambridge University Press, Great Britain.
- Gardner RH, Hargrove WG, Turner MG, Romme WH (1996) Climate change, disturbances and landscape dynamics. In: Global Change and Terrestrial Ecosystems (Ed. by B. Walker and W. Steffen), Cambridge University Press, Great Britain, 149-172.
- Melillo JM, Callaghan TV, Woodward FI, Salati E, Sinha K (1990) Climate Change: Effects on Ecosystems. In: Houghton JT, Jenkins GJ, Ephraums JJ (eds.) Climate Change, Cambridge University Press, New York, 283-310.
- Gebremedhin B (2002) Engineering Geological Investigation of Mekelle area, Tigray, Northern Ethiopia. M.Sc. Thesis, Addis Ababa University, Addis Ababa, pp. 163.
- Libiseller C, Grimvall A (2002) Performance of partial Mann-Kendall test for trend detection in the presence of covariates. Environmetrics 13: 71-84.
- Lazaro R, Rodrigo FS, Gutierrez L, Domingo F, Puigdefabregas J (2001) Analysis of a 30-year rainfall record (1967-1997) in semi-arid SE Spain for implications on vegetation. J Arid Environ 48: 373-395.
- Mirza MQ, Warrick RA, Ericksen NJ, Kenny GJ (1998) Trends and persistence in precipitation in the Ganges, Brahmaputra and Meghna river basins. Hydrologic Sci 43: 845-858.
- Önöz B, Bayazit M (2003) The power of statistical tests for trend detection. Turkish J Eng Environ Sci 27: 247-251.
- Kahya E, Kalayci S (2004) Trend Analysis of Stream flow in Turkey. J Hydrol 89: 128-144.
- Ethiopian Mapping Agency (1981) Atlas of Ethiopia. Ethiopian Mapping Agency, Addis Ababa, Ethiopia.
- Kadioglu M (1997) Trends surface air temperature data over Turkey. Int J Climatol 17: 511-520.
- Kadioglu M (2000) Regional variability of seasonal precipitation over Turkey. Int J Climatol 20: 1743-1760.
Citation: Beyene AN (2016) Precipitation and Temperature Trend Analysis in Mekelle city, Northern Ethiopia, the Case of Illala Meteorological Station. 7: 324. DOI: 10.4172/2157-7617.1000324
Copyright: © 2016 Beyene AN. This is an open-access article distributed under the terms of the Creative Commons Attribution License, which permits unrestricted use, distribution, and reproduction in any medium, provided the original author and source are credited.
Select your language of interest to view the total content in your interested language
Share This Article
Recommended Journals
Open Access Journals
Article Tools
Article Usage
- Total views: 14853
- [From(publication date): 1-2016 - Aug 20, 2025]
- Breakdown by view type
- HTML page views: 13490
- PDF downloads: 1363