Predicting Fluconazole Drug-Drug Interactions Using a Physiologically-based Pharmacokinetic (PBPK) Model
Received: 14-Jun-2022 / Manuscript No. JIDT-22-66684 / Editor assigned: 16-Jun-2022 / PreQC No. JIDT-22-66684 / Reviewed: 30-Jun-2022 / QC No. JIDT-22-66684 (PQ) / Revised: 07-Jul-2022 / Manuscript No. JIDT-22-66684 (R) / Published Date: 14-Jul-2022 DOI: 10.4172/2332-0877.1000504
Abstract
Aim: Physiologically Based Pharmacokinetic (PBPK) model is developed to (1) simulate clinical trials involving the Drug-Drug Interactions (DDI) between fluconazole and drugs (substrates) metabolized primarily by CYP2C9 and CYP3A, and to (2) support dosing recommendations.
Methods: The plasma-concentration profiles were simulated in virtual individuals for each drug alone and in combination with fluconazole in B2O simulator. The effect of fluconazole on substrates was compared with published clinical data, and dose adjustment was carried out.
Results: The magnitude of inhibition tended to be more pronounced for substrates with predominant CYP3A4 metabolism, for example, lemborexant, than those with dual CYP3A4/2C9 metabolism. The dose of flurbiprofen was adjusted from 50 mg to 25 mg and 20 mg respectively, to counteract the DDI effects caused by fluconazole 200 mg/day and 400 mg/day.
Conclusion: The PBPK model established based on the mechanism of DDI and inhibitor’s effect on enzyme activity can reasonably simulate the effect of fluconazole on drug substrates mainly metabolized by CYP2C9, CYP3A or both.
Keywords: CYP2C9; CYP3A; Inhibitor; Fluconazole; Pharmacokinetic/pharmacodynamic model; Drug-drug interaction; Candidemia
Introduction
As a triazole antifungal, fluconazole is one of the most prescribed antifungal drugs for candidemia. Candidemia is one of the most common bloodstream infections in the United States, with rate of new infections approximately 9 per 100,000 people [1]. It is estimated to have 25,000 cases of candidemia nationwide each year [2] including adults aged ≥ 65 years. People have candidemia may also have diseases such as cancer, asthma. Others may be suffering from insomnia or pain. Therefore, it is common to use a combination of anticancer drugs, asthma drugs, sleep-improving drugs, or pain relievers while treating candidiasis.
Fluconazole is also an inhibitor to Cytochrome P450 (CYP) 3A and CYP2C9 isoenzymes. The CYP superfamily is the primary oxidative drug metabolism mediator. CYP2C9 constitutes 10%-20% of the CYP protein content in the human liver, and it has been reported to catalyse approximately 20% of the CYP mediated drug oxidation reactions [3-5].
For drugs that are primarily metabolised by CYP3A and CYP2C9, we need to consider Drug-Drug Interactions (DDIs), because when fluconazole is co-administered with these drugs, the exposure of these drugs in humans may change and dose adjustments may be required. To optimise dose design and avoid unnecessary clinical trials, we used the PBPK simulation method to predict the effect of fluconazole on other drugs.
PBPK modelling has become an accepted tool in drug development and clinical DDI studies. In the FDA's 2020 In vitro DDI guidance [6], various modelling approaches are mentioned to help translate in vitro observations into in vivo predictions of potential clinical DDIs, including PBPK models. PBPK models can predict the DDI potential of investigational drugs or metabolites as enzyme substrate or enzyme perpetrators.
In the current study, following co-administration with fluconazole, drug exposures were simulated and compared using a PBPK model. Drugs (substrates) under investigation included vismodegib (anticancer agent), lemborexant (treat insomnia), ospemifene (treat dyspareunia), zafirlukast (treat chronic asthma), flurbiprofen (pain reliever), rivaroxaban (prevent blood clots) and avatrombopag (pain reliever). The PBPK model was developed using B2O simulator software (Shanghai Yinghan Pharmaceutical Technology Co., Ltd) and the same simulator has already been used in bioequivalence studies [7]. Elimination of these drugs involved multiple pathways in which important metabolites are formed by the CYP enzymes 2C9 and 3A4 [8-10]. Lemborexant is primarily metabolised through the cytochrome CYP3A pathway [11], while flurbiprofen is metabolised by CYP2C9 [12]. Rivaroxaban is metabolised by cytochrome CYP 3A4/3A5, CYP2J2 and other CYP-independent mechanisms [13]. As a member of CYP3A superfamily, CYP3A4 is the most abundantly expressed form in the liver [14]. CYP3A5 accounted for only 2% of the overall CYP3A protein among all studies samples, and CYP3A5 did not contribute significantly to hepatic drug metabolism in Caucasians [15]. CYP3A7 is considered a fetal-specific P450 enzyme [16], and CYP3A43 is extremely low in liver expression and contributes little to drug metabolism [17,18].
This PBPK model was established based on the mechanism of action of DDI and the effect of the inhibitor on enzyme activity. Changes in inhibitor/substrate concentration over time were considered. Plasma drug-concentration profiles were simulated in virtual individuals for each drug administered alone or in combination with fluconazole. The effect of fluconazole on substrates was compared with published clinical DDI data, and dose adjustment was carried out.
Materials And Methods
Data collection
Drug interaction studies with inhibitor fluconazole and CYP substrates were searched by using PubMed, with the keywords' fluconazole AND substrate AND human AND clinical study.
Interaction studies that met the following requirements were selected for further study.
1. The plasma concentration-time curves for substrate alone and with fluconazole are available.
2. Pharmacokinetic parameters such as Area Under the Plasma Concentration Curve (AUC) and maximum Concentration in serum (Cmax) are available.
3. Research published in the last 20 years.
4. The inhibitor fluconazole was pre-treated, and substrate was administered when fluconazole concentration reached a steady state.
PBPK model
The model included the substrate and inhibitor’s gastrointestinal, liver absorption, and systemic elimination in the central and tissue compartments. When the drug elimination was single-phase elimination, a one-compartment model was used. A PBPK model describing the substrate and inhibitor concentration-time profile is shown in Figure 1.

Figure 1: PBPK model describing the concentration-time curve of the substrate and inhibitor. C1 and I1 concentration in the systemic circulation, Ch and Ih concentration in the liver, CLr and CLr,i renal clearance. CLint and CLint,i the internal clearance rate of the liver, V1 and V1,i volume of the systemic circulation, Vh volume of the liver, K12 and K12,i transfer rate constant from the systemic circulation to the tissue compartment, K21 and K21,i transfer rate constant from the tissue compartment to the systemic circulation, Fa the fraction absorbed, Fg the intestinal availability, Qh the hepatic blood flow rate. X2, X2,i the content of the substrate in the tissue compartment. Subscript -i when a substrate is co-administered with an inhibitor.
The drug interaction model was adapted from the equations developed by Kato in 2005 and 2008 [19,20]. In this model, the DDI effect is specifically related to the local concentration of the perpetrators in the liver, which takes into account its nonspecific binding to liver tissue. When the substrate is co-administered with an inhibitor, the clearance rate of the substrate is:
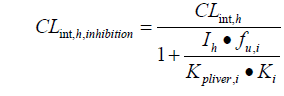
Kpliver is the ratio of liver to plasma concentration; Ki is the inhibition constant, which affects liver drug metabolism. CLint, h is the hepatic clearance rate and fu is the unbound fraction of the drug in the liver.
Parameters of simulated drugs
The input parameters were acquired from in vitro and in vivo data for the following compound: fluconazole (DDI perpetrator) and seven substrates. Drug absorption, distribution, and elimination parameters, such as Ka, V1, K12, K21, τ, were derived from their in vivo PK data. Referring to the physiological parameters and coefficient of variation of healthy people, the parameters were obtained from literature search [21,22]. The Fa and Fg referred to fractional absorption and intestinal availability, mainly derived from oral bioavailability. Fg was assumed to be 1 in the absence of data. In the B2O simulator, the inter-subject variability was set to the default value of 30% and all the parameters were assumed to be normally distributed.
Design of simulated Drug-Drug Interaction (DDI) studies
Based on B2O Caucasian population database, the virtual healthy Caucasian subjects were generated with age of 18-60 years, body weight of 50-100 kg, and a proportion of females of 0.5. The trial design used the same dose as the clinical trial study, and the dosing conditions were consistent. Fifty virtual individuals received different substrates and steady-state fluconazole 200 mg or 400 mg per day. Additional simulations were performed to determine dose adjustment of flurbiprofen to overcome the DDI of fluconazole. The criterion for dose adjustment is to obtain a drug exposure value as close as possible to that of the drug administered alone to provide an actual dose adjustment.
PBPK modelling software
The PBPK model was implemented using the software B2O simulator, a web-based platform, to predict drug exposures. With lower and upper CI% (Confidence Interval) limits 2.5%-97.5%, the geometric mean of all Cmax and AUC was calculated, and ratios between geometric means with and without inhibitor were calculated and compared to the reported geometric mean ratios (if any) in clinical studies. ≥ 1.5-fold change is considered significant. These data were further dissected to overall metabolic Clearance (CLm) to investigate the effect of fluconazole on substrates.
Results
Parameters used in the PBPK model
The parameters were firstly used to simulate single drug plasma concentration to evaluate the performance of the model. Parameters were adjusted to best fit the single drug model (Table 1). When the adjustments finished, inhibitor and substrates parameters were input into B2O simulator to simulate the DDI effect on the substrates. The contribution of each CYP isoform to the total hepatic metabolism of a substrate (ƒm) was evaluated by in vitro inhibition studies using specific CYP inhibitors or antibodies. If there is no information on ƒm, it is assumed to be 1. In Table 1, most fm values can be obtained directly or inferred from literature, except ospemifene and rivaroxaban. The fm of ospemifene was from the in vitro metabolic data and the relative abundance of each CYP enzyme in the liver [23,24]. Furthermore, that of rivaroxaban was calculated as the ratio of CYP3A4 contribution to total clearance and renal clearance [25]. Kpliver values were calculated by the method introduced by Poulin, et al. and Rodgers, et al. [26,27].
| Drug | Fluconazole | Lemborexant | Avatrombopag | Vismodegib | Rivaroxaban | Ospemifene | Zafirlukast | Flurbiprofen |
|---|---|---|---|---|---|---|---|---|
| Category | Inhibitor | Substrate | Substrate | Substrate | Substrate | Substrate | Substrate | Substrate |
| Kpliver | 0.889 | 5.422 | 5.259 | 3.656 | 1.041 | 5.122 | 1.171 | 1.172 |
| Fa | 0.95 | 0.87 | 0.675 | 0.318 | 0.9 | 0.3 | 0.2 | 1 |
| Fg | 0.948 | 1 | 1 | 1 | 1 | 1 | 1 | 1 |
| Ka(1/h) | 2.727 | 1.369 | 0.366 | 2.529 | 0.449 | 0.52 | 0.481 | 0.925 |
| fu | 0.89 | 0.113 [28] | 0.037 [29] | 0.01 [30] | 0.065 [31] | 0.01 [30] | 0.01 [30] | 0.01 [30] |
| BP | 1 | 0.636 [28] | 0.66 [29] | 0.745 [32] | 0.71 [31] | 0.564 [33] | 0.55 | 0.55 [34] |
| V1 (L) | 21.8 | 75.3 | 122.4 | 13.9 | 37.6 | 7.78 | 2.242 | 3.25 |
| CLr (L/h) | 0.475 | 0.145 | 0.181 | 0.039 | 2.91 | 0.002 | 0.0935 | 0.0306 |
| CLint,h (L/h) | 0.134 | 181.6 | 89.6 | 0.501 | 86.1 | 325.1 | 184.5 | 112.8 |
| K12 (1/h) | 0 | 0.313 | 0 | 0 | 0.0884 | 0.808 | 0.669 | 0 |
| K21 (1/h) | 0 | 0.0568 | 0 | 0 | 0.253 | 0.0292 | 0.0113 | 0 |
| Main metabolic CYP enzyme inhibited by fluconazole | / | CYP3A | CYP2C9 CYP3A | CYP2C9 CYP3A | CYP3A4 | CYP2C9 CYP3A | CYP2C9 CYP3A | CYP2C9 |
| fm | / | 1 [30] | 1 [30] | 1 [30] | 0.28 [25] | 0.83 [23] | 1[35] | 1 |
| τ | 0 | 0 | 1 | 0.45 | 0.75 | 0.5 | 0.45 | 0.25 [30] |
| Ki(mg/L) | 2.91 | 2.91 | 2.14 [36] | 2.14 [36] | 2.91 | 2.14 [36] | 2.14 [36] | 2.14 [36] |
Note: Parameter description: Kpliver: liver tissue partition coefficient to plasma; Fa: absorption fraction; Fg: intestinal availability;Ka : the absorption rate; Fu: plasma unbound drug fraction; BP: whole Blood Plasma fraction;V1: central compartment volume; CLr: renal Clearance; CLint: inherent Liver Clearance; K12/K21 : absorption and elimination rate of the tissue compartment in the two-compartment model; fm: the contribution of each CYP isoform to the metabolism of a substrate; τ: delay time; Ki: Inhibition constant of the corresponding enzyme that fluconazole inhibits (if there are more than one enzyme, the smallest value is chosen).
Table 1: Prediction of PK parameters for use in the PBPK model.
Validation of the PBPK Models
The PK parameters of each drug were simulated individually to evaluate the performance of the PBPK model. Parameters from observed clinical data and simulations, including area under the plasma concentration-time curve (AUCt), maximum concentration (Cmax) and the time to maximum concentration in serum (Tmax) are collected in Table 2. The simulated plasma concentrations of the seven substrates were in good accordance with clinical data (Table 2 and Figure 2), such as avatrombopag. The observed value of AUCt in clinical trials was 3.177h*μg/ml, and the predicted value (mean) was 3.417 h*μg/ml. The observed values of Cmax in clinical trials was 0.0941 μg/ml, and the predicted value (mean) was 0.0946 μg/ml [28-39].
| Drug (Dose mg/day) | AUCt (h*µg/ml) | Cmax (µg/ml) | Tmax (h) | References |
|---|---|---|---|---|
| Fluconazole (150 mg/day) a | ||||
| Simulated | 149.2 | 4.21 | 1.9 | [37] |
| Observed (n=25) | 151.7 | 4.38 | 1.5 | |
| Lemborexan (10 mg/day) | ||||
| Simulated | 0.324 | 0.04598 | 1.3 | [11] |
| Observed (n=14) | 0.2816 | 0.04663 | 1 | |
| Avatrombopag (20 mg/day) | ||||
| Simulated | 3.417 | 0.0946 | 8.7 | [10] |
| Observed (n=16) | 3.177 | 0.0941 | 7.0b | |
| Vismodegib (150 mg/day) | ||||
| Simulated | 173 | 8.419 | 2.3 | [38] |
| Observed (n=22) | 176.9 | 8.175 | 2.0b | |
| Rivaroxaban (20 mg/day) | ||||
| Simulated | 1.615 | 0.1746 | 3.7 | [13] |
| Observed (n=13) | 1.541c | 0.1866c | 4.0b | |
| Ospemifene (60 mg/day) | ||||
| Simulated | 4.482 | 0.466 | 2.3 | [9] |
| Observed (n=12) | 3.871 | 0.4923 | 3 | |
| Zafirlukast (20 mg/day) | ||||
| Simulated | 1.78 | 0.3058 | 3.3 | [39] |
| Observed (n=12) | 1.535 | 0.3492 | 3.0b | |
| Flurbiprofen (50 mg/day) | ||||
| Simulated | 30.46 | 5.387 | 1.9 | [12] |
| Observed d (n=11) | 30.50b | 6.015b | 1.5b | |
Note: a Fluconazole formulation: Diflucan®, Pfizer, S.A. de C. V., Mexico City, Mexico
b Only median (min, max were available from the tables in the papers)
c Subjects having genotype CYP2C9*1/*1
All observed data were obtained from the figures as an arithmetic mean
Abbreviation: AUCt: Area Under the plasma Concentration-time Curve over a dosing interval; Cmax: Maximum Concentration in serum; Tmax: Time of Maximum Concentration in serum
Table 2: Validation of PBPK models: simulated versus observed clinical data of each drug.

Figure 2: Simulated plasma concentration of (a) Lemborexant, (b) avatrombopag, (c) vismodegib, (d) rivaroxaban, (e) ospemifene, (f) zafirlukast, (g) flurbiprofen (dashed lines, n=50) with observed data (red dots) in the clinical study; perpetrator: fluconazole.
Simulations of DDIs between fluconazole and cytochrome P450 substrates
The simulated DDIs between fluconazole and cytochrome P450 substrates are presented as AUCR and CmaxR in Table 3. AUCR is the combination/single drug AUCt ratio, and CmaxR is the combination/ single Cmax ratio. The dose used in each simulation were the same as in the relevant clinical studies. In clinical studies, substrates were administered when fluconazole concentrations reached a steady state. The model predicted the effects of fluconazole on substrates within a 1.5-fold difference of the observed corresponding pharmacokinetic parameters (Figure 3), demonstrating that the model reasonably predicted drug exposure.
| Parameter | AUCR (CI%) | CmaxR (CI%) | References |
|---|---|---|---|
| Lemborexan (10 mg/day)+fluconazole (200 mg/day) | |||
| Simulated | 4.027(2.307-7.164) | 1.486 (1.141-2.096) | Landry 2021[11] |
| Observed | 4.439 | 1.538 | |
| Avatrombopag (20 mg/day)+fluconazole (400 mg/day) | |||
| Simulated | 2.271 (1.814-2.675) | 1.176 (1.054-1.384) | Nomoto 2018[10] |
| Observed | 2.143 | 1.102 | |
| Vismodegib (150 mg/day)+fluconazole (400 mg/day) | |||
| Simulated | 1.096 (1.023-1.195)a | 1.080 (1.023-1.147)a | Malhi 2016 [38] |
| Observed | 1.289a | 1.257a | |
| rìvaroxaban (20 mg/day)+fluconazole (400 mg/day) | |||
| Simulated | 1.208 (1.124-1.262) | 1.089 (1.031-1.159) | Mueck 2013 [13] |
| Observed | 1.405 | 1.267 | |
| Ospemifene (60 mg/day)+fluconazole (200 mg/day) | |||
| Simulated | 2.231 (1.744-3.046) | 1.308 (1.171-1.521) | Lehtinen 2013 [9] |
| Observed | 2.504 | 1.756 | |
| Zafirlukast (20 mg/day)+fluconazole (200 mg/day) | |||
| Simulated | 1.105 (1.379-2.269) | 1.321 (1.105-1.678) | Karonen 2012 [39] |
| Observed | 1.53 | 1.287 | |
| Flurbiprofen (50 mg/day)+fluconazole (200 mg/day) | |||
| Simulated | 2.087 (1.656-2.592) | 1.270 (1.105-1.537) | Kumar 2008 [12] |
| Observed | 1.992 | 0.9887 | |
| Flurbiprofen (50 mg/day)+fluconazole (400 mg/day) | |||
| Simulated | 2.424 (1.974-2.857) | 1.319 (1.123-1.602) | Kumar 2008 [12] |
| Observed | 2.658 | 1.021 | |
Note: AUCR is the ratio of the AUC of fluconazole with substrate to the AUC of the substrate alone; CmaxR is the ratio of the exposure Cmax of fluconazole with substrate to the Cmax of the substrate alone.
a PK on day seven after multi-dose administration.
b Subjects having genotype CYP2C9*1/*1
Table 3: Simulated versus observed values of drug-drug interactions between fluconazole and substrates.

Figure 3: Simulated (N=50) versus observed (blue dots) of AUCR (a) and CmaxR (b) for all substrates studied in the study. The red dashed lines represent the 1.5-fold difference from the observed pharmacokinetic parameters. The slope of the blue line is 1.
Lemborexant, mainly metabolised by CYP3A and CYP2B6 : Co-administration of lemborexant with fluconazole resulted in an approximately 1.5-fold increase in lemborexant Cmax and an approximately 4-fold increase in lemborexant AUCt (Table 3). Fourteen healthy subjects were randomly dosed and completed the study (six males and eight females, mean ± SD age were 37.4 ± 10.4 years) [11]. Since fluconazole inhibited CYP3A4 approximately 15-fold more than CYP2B6, CYP3A played a more critical role in the metabolic clearance of lemborexant [40].
Avatrombopag, mainly metabolised by CYP2C9 and CYP3A : Co-administration of avatrombopag and fluconazole increased the Cmax and AUCt of avatrombopag by 1.2-fold and 2.3-fold, respectively (Table 3). In the clinical study, sixteen subjects were randomly assigned and completed study. There were fourteen male subjects and two females, with an average age of 38.4 years. There were eight (50.0%) Black or African American subjects, six (37.5%) White, one (6.3%) Asian and one (6.3%) multiracial subject [10]. Both CYP2C9 and CYP3A contributed to the metabolic clearance of avatrombopag.
Vismodegib, mainly metabolised by CYP2C9 and CYP3A : Coadministration of fluconazole with vismodegib increased the Cmax and AUCt of vismodegib by 1.08-fold and 1.10-fold, respectively (Table 3). Eligible subjects for clinical studies were non-fertile females aged 18- 70 years and in good health [38]. Both CYP2C9 and CYP3A contributed to the metabolic clearance of vismodegib.
Rivaroxaban, mainly metabolised by CYP3A4 and CYP2J2 : Coadministration with fluconazole significantly increased the primary pharmacokinetic parameters of rivaroxaban. Mean AUCt and Cmax increased by approximately 44% and 18%, respectively, compared with rivaroxaban alone (Table 3). In the clinical study, thirteen healthy male subjects between 18-55 years were randomised. CYP3A4/3A5 accounted for approximately 18% of total rivaroxaban elimination and CYP2J2 approximately 14% [13].
Ospemifene, mainly metabolised by CYP2C9 and CYP3A : The concentrations of ospemifene increased after fluconazole pretreatment. The ratio of the geometric means for AUCt for ospemifene after fluconazole compared with ospemifene alone was 2.23. After fluconazole administration, Cmax was 31% higher than ospemifene alone (Table 3). In the clinical study, all subjects were white, with a mean age of 62.5 years [9]. Both CYP2C9 and CYP3A contributed to the metabolic clearance of ospemifene.
Zafirlukast, mainly metabolised by CYP2C9 and CYP3A4 : Co-administration of fluconazole increased zafirlukast plasma concentrations. During the fluconazole phase, the geometric mean ratio of zafirlukast AUTt was 1.11, and its Cmax was 1.32. Twelve healthy volunteers with genotypes CYP2C9 and CYP2C19 (eight men, four women; age range 20-27 years) were randomised [39]. Both CYP2C9 and CYP3A contributed to the metabolic clearance of zafirlukast.
Flurbiprofen, mainly metabolised by CYP2C9 : The ratio of the AUCt of co-administration to the AUCt of the flurbiprofen alone (200 mg and 400 mg) in subjects CYP2C9*1/*1 is described in Table 3. Coadministration of flurbiprofen and fluconazole (200 mg) increased AUCt of flurbiprofen by 2.09-fold, and co-administration with fluconazole (400 mg) increased AUCt by 2.42-fold. CYP2C9 played a significant role in the metabolic clearance of flurbiprofen.
Dosage adjustments to overcome the interaction with fluconazole
Dose adjustment simulations showed that a flurbiprofen dose of 25 mg per day resulted in a mean AUCt of 31.25 (h*μg/ml; observed flurbiprofen AUCt when administered alone at 50 mg daily: 30.11 h*μg/ ml), which was sufficient to overcome the effect of fluconazole (200 mg) on flurbiprofen exposure (Table 4). Also, reducing the dose to 20 mg per day resulted in a mean AUCt of 29.07 h*μg/ml (observed AUCt for flurbiprofen at 50 mg per day: 30.06 h*μg/ml), which was sufficient to overcome the effect of fluconazole (400 mg) on flurbiprofen exposure (Table 4).
| Administration (dose after adjustment) | AUCt (h*µg/ml) | AUCR (% CI) |
|---|---|---|
| Flurbiprofen (25 mg)+fluconazole 200 mg | 31.25 | 1.038 (0.9022-1.137) |
| Flurbiprofen (20 mg)+fluconazole 400 mg | 29.07 | 0.967 (0.8468-1.063) |
Note: AUCR is the ratio of the AUCt after dose adjustment of co-administration of flurbiprofen and fluconazole to the AUCt of flurbiprofen alone.
Table 4: Comparison of AUC and AUCR of the substrate alone before dosage adjustment and co-administration of fluconazole after dosage adjustment.
Discussion
Fluconazole is a prototypical CYP2C9 inhibitor with almost complete bioavailability, and less than 10% of the dose being metabolised [12]. Gastrointestinal symptoms associated with fluconazole use are rare, and when they do, they are usually considered mild [41]. Fluconazole is also water-soluble and exists as polymorphic forms [42]. Because CYP3A4 is expressed in the intestine as well as in the liver and some CYP3A4 substrates are metabolized by intestinal first-pass metabolism, it is better to select drug candidates that exhibit no intestinal first-pass metabolism during the drug discovery and development processes [20]. In the B2O simulator, drug interaction was assumed to take place both in the hepatic and intestinal metabolism, and the unknown parameters were Ki and FaFg [20]. When the intrinsic hepatic clearance of substrates exceeded 100 ml/min*kg, the estimated value of FaFg increased significantly by more than 1.3 times and further adjustment of FaFg will be required. In this study, the CLint for fluconazole was 0.118 L/h and the FaFg was 0.901, no more adjustment for FaFg was made [20]. When the logP of the inhibitor was more than 1, there was a relatively significant difference between the in vivo and in vitro Ki values [20]. Since the logP of water-soluble fluconazole is less than 1, the Ki value was no longer adjusted.
The PBPK model was used to quantitatively predict the DDI effects between fluconazole, a moderate CYP3A and CYP2C9 inhibitor, and seven substrates metabolised primarily by CYP3A or CYP2C9 or of both. The simulated results approved that the model reasonably predicted the effects of fluconazole on drug substrates. The same PBPK model was also validated with other inhibitors such as gemfibrozil (inhibiting CYP2C8), clopidogrel (inhibiting CYP2C8) and enoxacin (CYP1A2) (Data not published).
Predicting DDI interactions can be challenging due to the complex exposure-response relationship of each drug and the lack of a complete understanding of the underlying mechanisms. Avatrombopag is a substrate of CYP2C9 and CYP3A. Co-administration results of fluconazole or itraconazole suggested that CYP2C9 played a more important role than CYP3A in the metabolic clearance of avatrombopag [10]. Zafirlukast is also a substrate of CYP2C9 and CYP3A4 in vitro. Fluconazole, but not itraconazole, increased zafirlukast plasma concentrations, strongly suggesting that CYP2C9 but not CYP3A4 is involved in zafirlukast metabolism in vivo [39]. In the ospemifene study, 4-hydroxylation, a hydroxylated metabolite involved in the metabolism of ospemifene, appeared to be catalysed by many CYPs, whereas 4’-hydroxylation appeared to be predominantly catalysed by CYP3A4. In conclusion, CYP3A4 was the most critical CYP isoform for ospemifene metabolism, and CYP2C9, CYP2C19 and other isoforms also contribute to ospemifene metabolism [9]. One of the substrates metabolised by CYP3A but not CYP2C9 is rivaroxaban. CYP3A4/3A5 accounted for approximately 18% of total rivaroxaban elimination and CYP2J2 approximately 14% [13]. As a result, coadministration resulted in a 1.6-fold increase in rivaroxaban exposure. Co-administration of lemborexant (substrate mainly metabolised by CPY3A) with fluconazole resulted in a 4-fold increase in lemborexant, and the total CLm was decreased from 15.37 L/h (without fluconazole) to 0.4980 L/h (with fluconazole). The magnitude of inhibition appears to be more significant for substrates with major CYP3A4 metabolism such as lemborexant. Patients should avoid taking fluconazole with lemborexant.
CYP2C9 polymorphisms are responsible for 10% of human drug metabolism [43]. Although more than 100 single nucleotide polymorphisms (SNPs) have been identified, only homozygous CYP2C9*3/*3 is considered to have clinically significant low CYP2C9 activity [43]. In the clinical study reported by Kumar, et al. the apparent oral clearance, AUCt, and half-life of flurbiprofen at baseline in subjects with CYP2C9*1/*1 or CYP2C9*1/*3 genotypes were significantly different with post-coadministration parameters. However, there were no statistically significant changes in the above parameters following fluconazole co-administration in CYP2C9*3/*3 subjects [12]. No statistically significant differences were observed in Cmax and Tmax for any of the three genotype groups after the same treatment [12]. Since homozygotes for CYP2C9*3/*3 constitute only 0.5% of the population, in clinical study, the sample size of subjects with the CYP2C9*3/*3 genotype was small (N=2), it is difficult to conclude that parameters such as AUCR or CmaxR are significantly affected depending on genotypes. In cases where dose adjustment is required following co-administration with CYP2C9 inhibitor, subjects with genotype CYP2C9*3/*3 may require different dose suggestion due to low CYP2C9 activity. Furthermore, subjects of different ages, such as the elderly and children, may require different simulations due to the physiological changes associated with ageing. Because most of the substrates are metabolised mainly by CYP3A4 and CYP2C9, the simulator didn’t consider transporter-medicated drug interactions. The nonspecific or tissue binding for CLint,h, Kpliver and Ki were not considered either.
Conclusion
The PBPK model established based on the compartment model can reasonably simulate the effect of fluconazole on drugs mainly metabolised by CYP2C9 or CYP3A or both. This model has the potential to be used to predict the effects of inhibitors on drugs with CYP mechanisms. Based on the simulated AUCR, the dose of flurbiprofen was adjusted from 50 mg to 25 mg and 20 mg respectively, to counteract the DDI effect caused by fluconazole 200 mg/day and 400 mg/day.
Acknowledgment
We thank Dr Hongyun Wang in Peking Union Medical College Hospital for providing guidance and scientific suggestions.
Author Contributions
Conceptualization, Bo Liu; Data curation, Jingxi Li, Xue Li; Formal analysis, Keheng Wu; Investigation, Xue Li; Methodology, Keheng Wu; Project administration, Bo Liu; Software, Keheng Wu and Youni Zhao; Validation, Keheng Wu; Writing – original draft, Xue Li; Writing– review and editing, Xue Li, Zhou Zhou and Ranran Jia.
Declaration of Conflicting Interests
X.L., K.W., Z.Z., R.J., Y. Z. were employees of Yinghan Pharmaceutical Technology (Shanghai) at the time of study conduct.
Data Availability Statement
The data that support the findings of this study are available from the corresponding author upon reasonable request.
References
- CDCP (2021) Invasive Candidiasis Statistics.
- Tsay S, Williams S, Mu Y, Epson E, Johnston H, et al. National burden of candidemia, United Statesexternal icon. Open Forum Infect Dis 5(Suppl 1):S142-S143.
- Miners JO, Birkett DJ (1998) Cytochrome P4502C9: and enzyme of major importance in human drug metabolism. Br J Clin Pharmacol 1998. 45: p. 525-538.
[Crossref] [Google Scholar] [PubMed]
- S Rendic, Carlo FJD (1997) Human cytochrome P450 enzymes: A status report summarizing their reactions, substrates, inducers and inhibitors. Drug Metab Rev 29:413-580.
[Crossref] [Google Scholar] [PubMed]
- Shimada T, Yamazaki H, Mimura M, Inui Y, Guengeich FP (1994) Interindividual variations in human liver cytochrome p-450 enzymes involved in the oxidation of drugs, carcinogens and toxic chemicals: studies with liver microsomes of 30 Japanese and 30 Caucasians. J Pharmacol Exp Ther 270:414-423.
[Google Scholar] [PubMed]
- Guidance Document (2020) In Vitro drug interaction studies–cytochrome p450 enzyme and transporter- mediated drug interactions.
- Zhang F, Zhou Y, Wu N, Jia R, Liu A, et al. (2021) In silico prediction of bioequivalence of Isosorbide Mononitrate tablets with different dissolution profiles using PBPK modeling and simulation. Eur J Pharm Sci 157:1-10.
[PubMed]
- Graham RA, Lum BL, Morrison G, Chang I, Jorga K, et al. (2011) A single dose mass balance study of the Hedgehog pathway inhibitor vismodegib (GDC-0449) in humans using accelerator mass spectrometry. Drug Metab Dispos 39:1460-1467.
[Crossref] [Google Scholar] [PubMed]
- Lehtinen T, Tolonen A, Turpeinen M, Uusitalo J, Vuorinen J, et al. (2013) Effects of cytochrome P450 inhibitors and inducers on the metabolism and pharmacokinetics of ospemifene. Biopharm Drug Dispos 34:387-395.
[Crossref] [Google Scholar] [PubMed]
- Nomoto M, Zamora CA, Schuck E, Boyd P, Chang M, et al. (2018) Pharmacokinetic /pharmacodynamic drug-drug interactions of avatrombopag when coadministered with dual or selective CYP2C9 and CYP3A interacting drugs. Br J Clin Pharmacol 84:952-960.
[Crossref] [Google Scholar] [PubMed]
- Landry I, Aluri J, Nakai K, Hall N, Miyajima Y, et al. (2021) Evaluation of the CYP3A and CYP2B6 drug-drug interaction potential of Lemborexant. Clin Pharmacol Drug Dev 10:681-690.
[Crossref] [Google Scholar] [PubMed]
- Kumar V, Brundage RC, Oetting WS, Leppik IE, Tracy TS (2008) Differential genotype dependent inhibition of CYP2C9 in humans. Drug Metab Dispos 36:1242-1248.
[Crossref] [Google Scholar] [PubMed]
- Mueck W, Kubiz D, Becka M (2013) Co-administration of rivaroxaban with drugs that share its elimination pathways: pharmacokinetic effects in healthy subjects. Br J of Clin Pharmacol 76:455-466.
[Crossref] [Google Scholar] [PubMed]
- Michaels S, Wang MZ (2014) The revised human liver cytochrome P450 ‘Pie’: Absolute protein quantification of CYP4F and CYP3A enzymes using targeted quantitative proteomics. Drug Metab Dispos 42:1241-1251.
[Crossref] [Google Scholar] [PubMed]
- Westlind-Johnsson A, Malmebo S, Johansson A, Otter C, Andersson TB, et al. Comparative analysis of CYP3A expression in human liver suggests only a monor role for CYP35 in drug metabolism. Drug Metab Dispos 31:755-761.
[Crossref] [Google Scholar] [PubMed]
- Leeder JS, Gaedigk R, Marcucci KA, Gaedigk A, Vyhlidal CA, et al. (2005) Variability of CYP3A7 expression in human fetal liver. J Pharmacol Exp Ther 314:626-635.
[Crossref] [Google Scholar] [PubMed]
- Domanski TL, Finto C, Halpert JR, Zaphiropoulos PG (2001) cDNA cloning and initial characterization of CYP3A43, a novel human cytochrome P450. Mol Pharmacol 59:386-392.
[Crossref] [Google Scholar] [PubMed]
- Westlind A, Malmebo S, Johansson I, Otter C, Andersson TB, et al. (2001) Cloning and tissue distribution of a novel human cytochrome p450 of the CYP3A subfamily, CYP3A43. Biochem Biophys Res Commun 281:1349-1355.
[Crossref] [Google Scholar] [PubMed]
- Kato M, Chiba K, Horikawa M, Sugiyama Y (2005) The quantitative prediction of in vivo enzyme-induction caused by drug exposure from in vitro information on Human Hepatocytes. Drug Metab Pharmacokinet 20:236- 243.
[Crossref] [Google Scholar] [PubMed]
- Kato M, Shitara Y, Sato H, Yoshisue K, Hirano M, et al. (2008) The quantitative prediction of CYP-mediated drug interaction by physiologically based pharmacokinetic modelling. Pharm Res 25:1891-1901.
[Crossref] [Google Scholar] [PubMed]
- Brown RP, Delp MD, Lindstedt SL, Rhomberg LR, Beliles RP (1997) Physiological parameter values for physiologically based pharmacokinetic models. Toxicol Ind Health 13:407-484.
[Crossref] [Google Scholar] [PubMed]
- Jones H, K Rowland-Yeo K (2013) Basic concepts in physiologically based pharmacokinetic modelling in drug discovery and development. CPT Pharmacometrics Syst Pharmacol 2:e63.
[Crossref] [Google Scholar] [PubMed]
- Tolonen A, Koskimies P, Turpeinen M, Uusitalo J, Lammintausta R, et al. (2013) Ospemifene metabolism in human in vitro and in vivo: metabolite identification, quantitation, and CYP assignment of major hydroxylations. Drug Metabol Drug Interact 28:153-161.
[Crossref] [Google Scholar] [PubMed]
- Rostami-Hodjegan A, Tucker GT (2007) Simulation and prediction of in vivo drug metabolism in human populations from in vitro data. Nat Rev Drug Discov 6:140-148.
[Crossref] [Google Scholar] [PubMed]
- Mueck W, Stampfuss J, Kubitza D, Becka M (2014) Clinical pharmacokinetic and pharmacodynamic profile of rivaroxaban. Clin Pharmacokinet 53:1-16.
[Crossref] [Google Scholar] [PubMed]
- Poulin P, Theil FP (2002) Prediction of pharmacokinetics prior to in vivo studies. 1. Mechanism-based prediction of volume of distribution. J Pharm Sci 91:129-156.
[Crossref] [Google Scholar] [PubMed]
- Rodgers T, Rowland M (2006) Physiologically based pharmacokinetic modelling 2: Predicting the tissue distribution of acids, very weak baes, neutrals and zwitterions. J Pharm Sci 95:1238-1257.
[Crossref] [Google Scholar] [PubMed]
- Ueno T, Miyajima Y, Landry I, Lalovic B, Schuck E (2021) Physiologically-based pharmacokinetic modelling to predict drug interactions of Lemborexant with XY3A inhibitors. CPT Pharmacometrics Syst Pharmacol 10:455-466.
[Crossref] [Google Scholar] [PubMed]
- EPAR Assessment Report (2019)Avatrombopag, European Medicines Agency.
- Drugbank online.
- CHMP Assessment Report (2008) Rivaroxaban, European Medicines Agency.
- EMA Assessment report (2019) Vismodegib, European medicines Agency.
- EMA Assessment report (2015) Ospemifene, European medicines Agency.
- Kaiser DG, Brooks CD, Lomen PL (1986) Pharmacokinetics of flurbiprofen. Am J Med 80:10-15.
[Crossref] [Google Scholar] [PubMed]
- Package leaflet (2015) Information for the user Accolate® 20 mg film-coated tablets, Astra ZenecaA.
- Kunze KL, Wienkers LC, Thummel KE, Trager WF (1996) Inhibition of the human cytochrome P450-dependent metabolism of warfarin by fluconazole: In vitro studies. Drug Metab Dispos 24:414-421.
[Google Scholar] [PubMed]
- Palma-Aguirre JA, Lopez-Gamboa M, Castro-Sandoval TJ, Hernández-González R, Mejía-Callejas J, et al. (2010) Bioequivalence of two oral fluconazole formulations in healthy subjects: A single dose, open-label, randomized two-period crossover study. J Bioequiv Availab 2:23-27.
- Malhi V, Colburn D, Williams SJ, Hop CECA, Dresser MJ, et al. (2016) A clinical drug-drug interaction study to evaluate the effect of a proton-pump inhibitor, a combined P-glycoprotein/cytochrome 450 enzyme (CYP)3A4 inhibitor, and a CYP2C9 inhibitor on the pharmacokinetics of vismodegib. Cancer Chemother Pharmacol 78:41-49.
[Crossref] [Google Scholar] [PubMed]
- Karonen T, Laitila J, Niemi M, Neuvonen PJ, Backman JT (2012) Fluconazole but not the CYP3A4 inhibitor, itraconazole, increases zafirlukast plasma concentrations. Eur J Clin Pharmacol 68(5):681-688.
[Crossref] [Google Scholar] [PubMed]
- Moody DE, Liu F, Fang WB (2015) Azole antifungal inhibition of buprenorphine, methadone and oxycodone in vitro metabolism. J Anal Toxicol 39:374-386.
[Crossref] [Google Scholar] [PubMed]
- Anaissie EJ, McGinnis MR, Pfaller MA (2009) Clinical Mycology. 2nd ed. London, Churchill Livingstone, United Kingdom.
- Charoo N, Cristofoletti R, Graham A, Lartey P, Abrahamsson B, et al. (2014) Biowaiver monograph for immediate-release solid oral dosage forms: Fluconazole. J Pharm Sci 103:3843-3858.
[Crossref] [Google Scholar] [PubMed]
- Schaffenburg WC, DeKlotz BL (2021) Comprehensive dermatologic drug therapy. 4th ed. Amsterdam, Elsevier, Netherlands.
Citation: Li X, Wu K, Zhou Z, Jia R, Zhao Y, et al. (2022) Predicting Fluconazole Drug-Drug Interactions Using a Physiologically-based Pharmacokinetic (PBPK) Model. J Infect Dis Ther 10: 504. DOI: 10.4172/2332-0877.1000504
Copyright: © 2022 Li X, et al. This is an open-access article distributed under the terms of the Creative Commons Attribution License, which permits unrestricted use, distribution, and reproduction in any medium, provided the original author and source are credited.
Select your language of interest to view the total content in your interested language
Share This Article
Recommended Journals
Open Access Journals
Article Tools
Article Usage
- Total views: 3572
- [From(publication date): 0-2022 - Nov 05, 2025]
- Breakdown by view type
- HTML page views: 2981
- PDF downloads: 591