Projected Rainfall Erosivity Changes under Future Climate in the Upper Nan Watershed, Thailand
Received: 09-Nov-2014 / Accepted Date: 01-Dec-2014 / Published Date: 10-Dec-2014 DOI: 10.4172/2157-7617.1000242
Abstract
This study aims to estimate the potential changes in rainfall erosivity under future climatic conditions in the Upper Nan watershed, Thailand. The multi-climate model and multi-emission scenario approach for the estimation of climate change impacts used in the study consists of PRECIS: ECHAM4, GFDLR-30, HadCM3 and NCAR CCSM3. The change factor or the delta change method is used as a downscaling technique to generate future precipitation. The relationship between monthly precipitation and rainfall erosivity can be used to estimate monthly rainfall erosivity under future climate. Results indicate that the average annual precipitation for all three future time slices increases from a baseline value of 1250 mm by between 2.14% (1277 mm) in 2011-2040 and 7.00% (1337 mm) in 2071-2099. Moreover, the mean of each GCM and emission scenario combination illustrates an increase in average annual rainfall erosivity for all three future time slices; from a baseline value of 5503 MJ mm ha-1 h-1 yr-1, the amount increases by between 5.02% (5779 MJ mm ha-1 h-1 yr-1) in 2011−2040 to 14.20% (6284 MJ mm ha-1 h-1 yr-1) in 2071-2099. According to RUSLE, a 1% increase in rainfall erosivity will lead to a 1% increase in soil erosion, if other factors remain constant. Therefore, soil erosion in the Upper Nan watershed is projected to be more serious in the coming decades.
Keywords: Rainfall erosivity; Precipitation; Climate change; Upper nan watershed
8651Introduction
Soil erosion due to water is a major and very serious environmental threat in Thailand. Thailand is one of those countries where the strongest effects of climate change are expected [1]. In addition, profound land use changes occur predominantly in vulnerable mountainous areas such as the Upper Nan watershed. The Upper Nan watershed is located in northern Thailand and more than 85 percent of the watershed is mountainous. The rate of soil erosion in the watershed, on an average, is higher than 200 ton ha-1 yr-1, which is the highest among all the watersheds in northern Thailand [2]. Since the last few decades, the Upper Nan watershed has been one of the most intensive agricultural areas in Thailand and it has also become very vulnerable to soil erosion due to its undulating topography, steep slopes and high rainfall.
Rainfall erosivity represents the measure of the erosive force of rainfall to cause soil erosion. Rainfall erosivity quantifies the impact of raindrops on the soil and reflects the amount and rate of runoff associated with rain. It is well known that several very intense rainfall events are responsible for the largest proportion of soil erosion and sediment delivery. Hence, estimating rainfall erosivity is central to the assessment of soil erosion risk. The rainfall erosivity for a given storm or EI30, as per USLE [3], or its revised version RUSLE [4] is equal to the product of the total storm energy (E) and maximum 30-min rainfall intensity (I30). The EI30 index has been the most widely used index. However, a series of more than 20 years of rain gauges is recommended to calculate this factor, but such a length of time series is not found in many parts of the world [5]. Simplified methods for predicting rainfall erosivity using readily available data have been presented in various studies and are used in many countries because high resolution rainfall data needed to directly compute rainfall erosivity is not available in many locations; moreover, calculations of such data are intricate and time consuming [6]. An estimation method using monthly precipitation is a good example of these simplified models. Monthly precipitation data is relatively easy to obtain in most places and is reliable. This approach assumes that annual erosivity is correlated with monthly precipitation. A number of studies have reported good correlations between monthly and annual precipitation and rainfall erosivity for many locations around the world. Precipitation data has been used as a simple estimator of rainfall erosivity in many countries [7-10].
Climate change is expected to affect soil erosion based on a variety of factors [11], including precipitation amount and the impact of precipitation intensity on soil moisture and plant growth, and direct fertilization effects on plants due to greater CO2 concentrations. The most direct effect of climate change on erosion by water can be expected to be the effect of changes in rainfall erosivity [12-15]. Thus, the increase in precipitation can be expected due to the increase in rainfall intensity. The study conducted by Pruski and Nearing [16] indicated that changes in rainfall that occur due to changes in storm intensity can be expected to have a greater impact on erosion rates. Several studies have used prediction models to assess soil erosion under future climate [10,16-21]. The main objective of the present study was to evaluate the impact of possible future climate change on rainfall erosivity in the Upper Nan watershed, Thailand, using multiple models and scenarios.
Materials And Methods
Study area
The Upper Nan watershed is located in northern Thailand. It lies between 18° 00' 45" and 19° 37' 53" N latitude and 100° 20' 34" and 101° 06' 29" E (Figure 1). The catchment area of the Upper Nan watershed is about 13,000 km2 and the topography of the watershed ranges from a flat terrain to mountains. Land use in the area is mainly degraded forests and upland agriculture. Rice, maize, and vegetables are grown in both shifting cultivation and permanent cultivation patterns [22]. There are several rivers and rivulets in the watershed which drain in the main river, the Nan River. The name of the watershed, that is the Nan Basin, is derived from this river. The Nan Basin is divided into sixteen sub-basins and the Upper Nan Basin is divided into nine subcatchments.
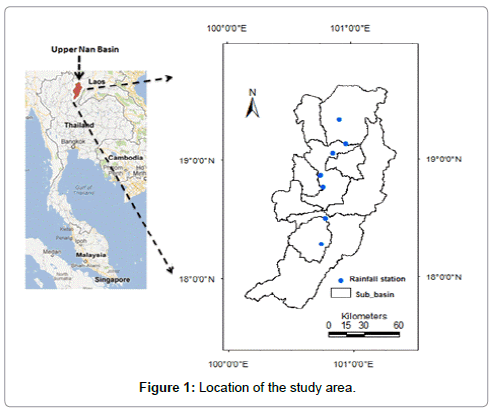
Figure 1: Location of the study area.
Climate
The general climate of the study area is tropical monsoon and characterized by winter, summer and rainy seasons. The area is influenced by the northeast and southwest monsoons. The rainy season, brought about by the southwest monsoon originating in the Indian Ocean, lasts from mid-May until the end of October. July and August are usually months of intense rainfall. During the winter season, the weather is cold and dry due to the northeast monsoons, beginning in November and ending in February. From mid-February until mid-May, the weather is rather warm. The annual rainfall in the area is about 1,263 mm. More than 80 percent of the rainfall is concentrated in the wet season. Rainfall data from 1961 to 2010 for this study was collected from the Thai Meteorological Department. The rainfall distribution pattern of the area shows two peaks during the baseline period. The first peak is in May and the second peak is in August (Figure 2). Dry spills usually occur between the two peaks. The maximum and minimum monthly average rainfall values are about 262 mm in August and 6 mm in December respectively.
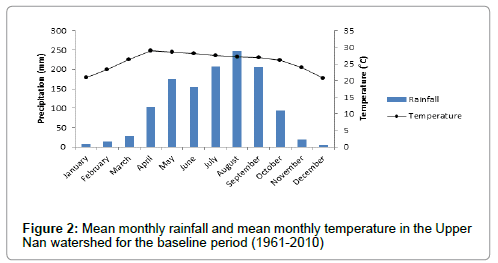
Figure 2: Mean monthly rainfall and mean monthly temperature in the Upper Nan watershed for the baseline period (1961-2010)
The database for and computation of the estimation of rainfall erosivity
The approach used to estimate the R-factor values is summarized in the following three-step process described by Renard and Freimund [8]: (1) R-factor values are calculated by the prescribed method for stations with continuous graphical record siphon rain gauges; (2) a relation is established between the calculated R-values and more readily available types of precipitation data; and (3) the relation is extrapolated, and R-values are estimated for stations with the associated precipitation data.
In this study, rainfall data from 7 stations with continuous graphical record rain gauges were used to compute the R-factor. The same rain gauge stations were used to derive the equation to estimate R based on monthly precipitation data. The stations are a part of the national rain gauge network managed by the Climatological Center, Meteorological Development Bureau, Thai Meteorological Department. Rainfall data is shown in Table 1 and Figure 1. The criteria for the identification of an erosive event are provided by Renard et al. [4]: (i) the cumulative rainfall of an event should be greater than 12.7 mm, or (ii) the event should have at least one peak that is greater than 6.35 mm in 15 min, or (iii) a rainfall-period of less than 1.27 mm in 6 h can be used to divide a longer storm period into two storms.
| Rain gauge station | Longitude E | Latitude N | Mean of annual rainfall (mm) | Length of record (yr) |
|---|---|---|---|---|
| Thung Chang | 100 52 47 | 19 23 11 | 1569 | 22 |
| Na Noi | 100 43 02 | 18 19 34 | 941 | 15 |
| Pou | 100 55 03 | 19 10 57 | 1089 | 20 |
| Viang Sa | 100 45 15 | 18 34 10 | 1166 | 17 |
| Maung Nan | 100 46 26 | 18 46 35 | 1263 | 22 |
| Nan Agro Station | 100 45 00 | 18 52 00 | 1307 | 20 |
| Ta Wang Pa | 100 48 48 | 19 07 04 | 1383 | 17 |
Table 1: Characteristics of continuous graphical records rain gauge stations.
Daily EI30 values for the period of 1997-2006 were calculated using rainfall intensity data recorded every 15 min and the RUSLE model. The RUSLE model uses the Brown and Foster approach [23] to calculate average annual rainfall erosivity or the R-factor:
where E is the total storm kinetic energy (MJ ha-1), I30 is the maximum 30 minute rainfall intensity (mm h-1), j is an index of the number of years used to produce the average, k is an index of the number of storms in each year, n is the number of years used to obtain the average R, and m is the number of storms in each year.
The total storm kinetic energy (E) is determined using the relation
where er is the rainfall energy per unit depth of rainfall per unit area in megajoules per hectare per millimeter (MJ ha-1 mm-1), and ΔVr is the depth of rainfall in millimeters (mm) for the rth increment of the storm hyetograph which is divided into m parts, in which each part has a constant rainfall value.
Rainfall energy per unit depth of rainfall (er ) can be calculated using the relation:
where er in measured in units of megajoules per hectare per millimeter of rain (MJ ha-1mm-1), and  is rainfall intensity (mm h-1). Rainfall intensity for a particular increment of a rainfall event () is calculated using the relation

where Δtr is the depth of rain falling (mm) during the increment.
Rainfall erosivity estimates from daily rainfall intensity data
Event rainfall erosivity values (EI) are usually well fitted to the event’s precipitation amount (P) by an exponential relationship:

where a and b are empirical parameters and e is a random, normally distributed error. The R factor, equal to the annual cumulative EI, is obtained by summing up all the events’ values. The parameters a and b can be adjusted month-by-month to take account of intra-annual variations in rainfall characteristics. This leads to the more general expression:
where m represents the month of the year being evaluated. The exponential relationship has been applied to event [24], daily [25] and even monthly data [26]. In all these studies, parameter a was the only variable, and parameter b was assumed to be stationary through the year.
Global Circulation Models (GCMs)
The estimation of future climate change, as provided by Global Circulation Models (GCMs) and Regional Circulation Models (RCMs), does not entail the type of detailed storm information that is needed to directly calculate predicted rainfall erosivity changes. Therefore, relationships between rainfall erosivity and monthly precipitation had to be developed and these were used to analyze the impact of climate change on rainfall erosivity [8,15,16,21]. For this study, the commonly used HadCM3, CCSM3, GFDLR-30 and PRECIS: ECHAM4 were chosen to generate future precipitation scenarios in order to enable the estimation of future rainfall erosivity under possible changes in climatic conditions.
For this study, three GCMs were selected on the basis of their performance in the simulation of precipitation. (1) The GFDLR-30 model was constructed in 1986 in the United States at the Geophysical Fluid Dynamics Laboratory at Princeton, New Jersey. The designation R30 was given to the model because it has a rhomboid type of spectral resolution truncated on the 30 wave number. This model has a R30 horizontal resolution (2.25 latitude by 3.75 longitudes), 14 vertical levels and realistic topography, sensorial sunshine variation, cloud forecast and a “drained” gravitational wave [27]. It is available at http://www.ipcc-data.org/ . (2) NCAR’s Community Climate System Model (CCSM3) was one of the global climate models included in the Fourth Assessment Report (AR4) of the Intergovernmental Panel on Climate Change (IPCC). NCAR’s GIS program provides GIS-compatible users access to CCSM3 AR4 global data (1.4 degree or 155 km). The selected GCMs can be downloaded from the NCAR community climate system model (CCSM) projections in GIS format, which is available at http://gisclimatechange.ucar.edu/. (3) HadCM3 was used to generate future precipitation scenarios. HadCM3 is a coupled atmospheric-ocean GCM developed at the Hadley Centre of the United Kingdom National Meteorological Service that studies climate variability and change. The atmospheric component of the model has 19 levels, with a horizontal resolution of 2.5° latitude and 3.75° longitude. The ocean component of the model has 20 levels, with a horizontal resolution of 1.25° latitude and 2.5° longitude.
Regional Climate Model (RCM)
The Regional Climate Model (RCM) used in this study is PRECIS, developed by the Hadley Centre of the UK Meteorological Office. The PRECIS RCM is based on the atmospheric components of the ECHAM4 GCM developed by the Max Planck Institute for Meteorology, Germany. The PRECIS data is produced by the Southeast Asian System for Analysis, Research and Training (SEA START) Regional Center for 2225 grid cells covering the entire Mae Nam Nan sub-catchment with a resolution of 0.2×0.2 degree (approximately 22×22 km2). This data comprises two data sets for ECHAM4 SRES A2 and B2 with respect to daily precipitation. The PRECIS: ECHAM4 data over the periods of 1971-2000 (present) and 2011-2098 (future), for both A2 and B2 scenarios, was obtained from the Southeast Asian START Regional Center website http://www.start.or.th/.
Several statistical downscaling techniques have been developed to translate large-scale GCM/RCM output into finer resolution. In this study, the simplest method change factor or delta change approach has been applied. The change factor or the delta change method has been used in many climate change impact studies earlier as well [15,16,28]. Basically, this approach modifies the observed historical time series of precipitation by multiplying the ratio of monthly historic and future precipitations simulated by NCAR CCSM3 (A2, A1b and B1 scenarios), HadCM3 and PRECIS: ECHAM4 (A2 and B2 scenarios) for each time period. The observational database used in this approach covers the period of 1981-2000.
Results And Discussion
Relations between monthly precipitation and rainfall erosivity
We analyzed the relationships between annual precipitation and rainfall erosivity for 7 weather stations in greater detail and used equations (1)-(4) to calculate monthly and annual rainfall erosivity. The results of the computed rainfall erosivity factor values are listed in Table 2. Considerable differences in erosivities were detected throughout the 7 rain gauge stations. It can be seen that Thung Chang showed the highest erosivity value (7786 MJ mm ha-1 h-1 yr-1) and Na Noi had the lowest value (3494 MJ mm ha-1 h-1 yr-1). The R values varied among the stations as a result of the rainfall depths, a regional feature determined by elevation. Elevation itself decreases with latitude from north to south in the study area. High R-factor values were calculated for Ta Wang Pa, Maung Nan, and Vaing Sa. Table 2 shows the monthly rainfall-runoff erosivity factor values for the 7 continuous graphical records rain gauge stations. In the study area, 70% of the annual erosivity is recorded in May, June, and July. This distribution is fairly constant among all the rain gauge stations. However, less that 10% of the annual erosivity is recorded between December and February. Because the R-factor values in this study were calculated by the prescribed method with continuous rainfall records, these values can be directly used for soil erosion estimations in the 7 rain gauge locations and also in nearby areas with similar geographical arrangements and rainfall regimens.
| Month | Rain gauge station | ||||||
|---|---|---|---|---|---|---|---|
| Thung Chang | Pou | Ta Wang Pa | Maung Nan | Viang Sa | Agriculture | Na Noi | |
| Jan | 20 | 12 | 15 | 8 | 9 | 6 | 7 |
| Feb | 12 | 11 | 18 | 20 | 21 | 19 | 15 |
| Mar | 95 | 57 | 60 | 21 | 54 | 52 | 22 |
| Apr | 443 | 236 | 315 | 367 | 362 | 291 | 227 |
| May | 851 | 617 | 915 | 945 | 772 | 837 | 647 |
| Jun | 1051 | 715 | 998 | 633 | 653 | 643 | 391 |
| Jul | 1676 | 1003 | 1160 | 1080 | 984 | 854 | 496 |
| Aug | 2227 | 1299 | 1697 | 1261 | 1270 | 1142 | 692 |
| Sept | 1085 | 878 | 692 | 980 | 971 | 799 | 745 |
| Oct | 254 | 134 | 241 | 249 | 319 | 334 | 233 |
| Nov | 62 | 27 | 41 | 51 | 32 | 28 | 16 |
| Dec | 12 | 3 | 6 | 5 | 6 | 6 | 4 |
| Annual | 7786 | 4995 | 6158 | 5618 | 5453 | 5010 | 3494 |
Table 2: Monthly rainfall erosivity for 7 continuous graphical records rain gauge stations in the Upper Nan watershed in northern Thailand (units are MJ mm ha-1 h-1 month-1 and MJ mm ha-1 h-1 yr-1).
Figure 3 shows the monthly rainfall erosivity and precipitation values of the seven stations in the Upper Nan watershed. Figure 4 shows the calibration between measured and predicted monthly rainfall erosivity (R factor) in the study area. A power function gave the highest coefficient of determination when compared with seven stations using a simple regression analysis of monthly rainfall (mm) versus monthly rainfall erosivity. The equation had a 0.94 coefficient of determination, statistically, for the whole watershed. The regression equation based on the 7 rain gauge stations is:
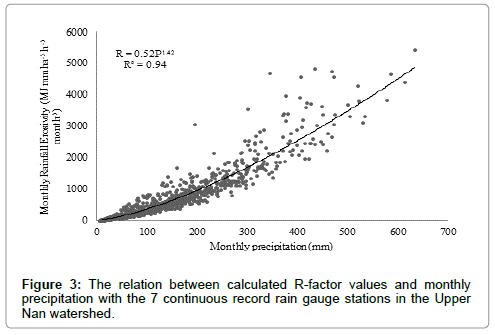
Figure 3: The relation between calculated R-factor values and monthly precipitation with the 7 continuous record rain gauge stations in the Upper Nan watershed.
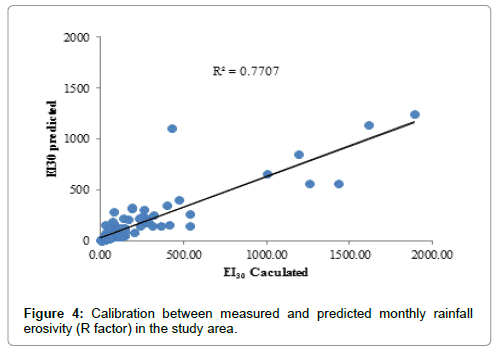
Figure 4: Calibration between measured and predicted monthly rainfall erosivity (R factor) in the study area.
where R is monthly rainfall erosivity (MJ mm ha-1 h-1 month-1), P is monthly precipitation (mm) and 0.52 and 1.42 are the fitted parameters specific to the region. Renard and Freimund [8] calculated such a relationship for continental USA (132 stations) and predicted the R-factor with r2=0.81 and 1075 standard error of estimation by using a=0.048 and b=1.610. In a similar study, researchers concerned with variations in actual rainfall erosivity proposed monthly regression models for predicting monthly rainfall erosivity [29]. The use of daily or monthly rainfall records can provide a better understanding of rainfall erosivity for individual storms than for annual precipitation [30].
Projected precipitation changes
Figure 5 presents the average monthly rainfall cycle for all climate projections in the three future periods and the baseline period (between 1981 and 2000). Overall, there is a dramatic rise in rainfall from January until a peak in August is reached. After this, rainfall drops considerably until December. It is clear that there is less monthly average rainfall from PRECIS ECHAM4 under A2 and B2 scenarios’ output than in the base period and under other GCMs from March to May, whereas there is equality in comparison with the baseline period from September to December. The rainfall peak range in August of all climate projections is between 198–238 mm in 2011-2040, 188–237 mm in 2041-2070 and 196-242 mm in 2071-2099. For annual rainfall, the changes range from -13-9% in 2011-2040, to -16-10% in 2041-2070 and -10-14% in 2071-2099, depending on the emission scenarios and climate models selected.
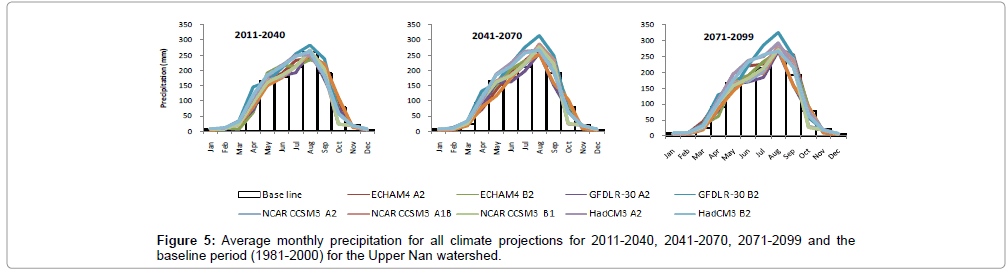
Figure 5: Average monthly precipitation for all climate projections for 2011-2040, 2041-2070, 2071-2099 and the baseline period (1981-2000) for the Upper Nan watershed.
Table 3 presents individual model-projected mean annual precipitation and its changes averaged over the region during the three future periods under the three scenarios. The models project increases over the region with the exception of the model GFDL R-30 under A2 scenario for all three periods and NCAR CCSM3 for all three scenarios in 2011-2040. The average annual precipitation for all three future time slices increases from a baseline value of 1250 mm by 2.14% (1277 mm) in 2011-2040 to 7.00% (1337 mm) in 2071-2099. Overall, the model GFDL R-30 under B2 scenario simulates the highest increase in mean precipitation during the period of 2041-2070, while GFDL R-30 under B2 scenario projects the highest decrease—approximately -10.96% (1113 mm)—in 2041-2070.
| Climate models | GHGES | 2011-2040 | 2041-2070 | 2071-2099 | |||
|---|---|---|---|---|---|---|---|
| Rainfall (mm) | Change (%) |
Rainfall (mm) | Change (%) |
Rainfall (mm) | Change (%) |
||
| ECHAM4 | A2 | 1287 | 2.96 | 1263 | 1.04 | 1444 | 15.52 |
| B2 | 1243 | -0.56 | 1292 | 3.36 | 1234 | -1.28 | |
| GFDL R-30 | A2 | 1168 | -6.56 | 1113 | -10.96 | 1148 | -8.16 |
| B2 | 1489 | 19.12 | 1574 | 25.92 | 1541 | 23.28 | |
| NCAR CCSM3 | A2 | 1196 | -4.32 | 1261 | 0.88 | 1280 | 2.4 |
| A1B | 1211 | -3.12 | 1307 | 4.56 | 1284 | 2.72 | |
| B1 | 1215 | -2.8 | 1267 | 1.36 | 1243 | -0.56 | |
| HadCM3 | A2 | 1332 | 6.56 | 1382 | 10.56 | 1467 | 17.36 |
| B2 | 1350 | 8.00 | 1375 | 10.00 | 1393 | 11.44 | |
| Average | 1277 | 2.14 | 1315 | 5.19 | 1337 | 7.00 | |
Table 3: Annual average precipitations for all climate projection compared to the
base period’s 1250 mm (1971-2000).
Projected rainfall erosivity changes
The relationship between monthly precipitation and rainfall erosivity can be used to estimate monthly or annual rainfall erosivity (R factor) values using Equation (5) because rainfall erosivity is not provided by current GCM/RCM outputs. Therefore, the purpose of this process was to estimate rainfall erosivity under future climate based on the outputs of GCMs HadCM3, ECHAM4 and GFDLR-30 under A2 and B2 scenarios and NCAR CCSM3 under A2, A1b and B1 scenarios. Raw GCM outputs have been used in many previous studies of rainfall erosivity and its effects under climate change [10,11,19-21].
Figure 6 illustrates that the changes in monthly rainfall erosivity are not unidirectional for all emission scenarios, climate models and time periods. The intra-annual patterns of rainfall erosivity changes range from unimodal to the base period. For example, there is a decrease in rainfall erosivity from November to February and an increase in March to October for all three time periods. Future changes in rainfall erosivity, in comparison to the base period (5503 MJ mm ha-1 h-1), range between -4.62-24.08% in 2011-2040, -9.87-33.51% in 2041-2070 and -8.05-35.27% in 2071-2099 depending on the emission scenarios and climate models. The changes in intra-annual rainfall erosivity range from -80-140% in 2011-2040, -90-140% in 2041-2071 and −80- 138% in 2071-2099 (Figure 7).
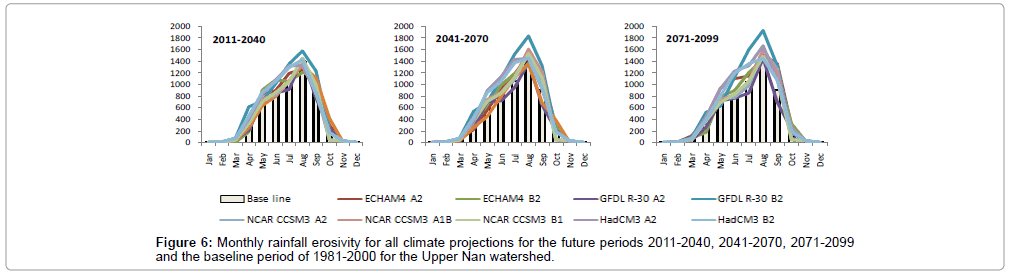
Figure 6: Monthly rainfall erosivity for all climate projections for the future periods 2011-2040, 2041-2070, 2071-2099 and the baseline period of 1981-2000 for the Upper Nan watershed.
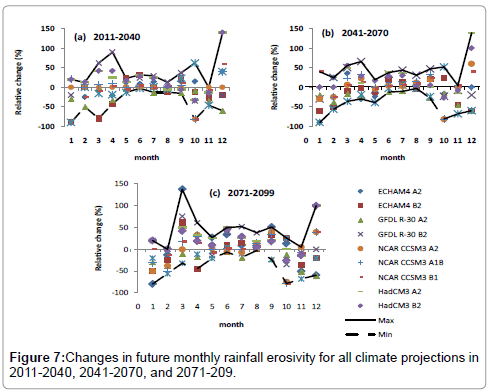
Figure 7: Changes in future monthly rainfall erosivity for all climate projections in 2011-2040, 2041-2070, and 2071-209.
Table 4 illustrates the impacts of climate change (changes in precipitation) on future rates of rainfall erosivity in the Upper Nan watershed. The mean of each GCM-emission scenario combination illustrates an increase in average annual rainfall erosivity for all three future time slices, as compared to the baseline value of 5503 MJ mm ha-1 h-1 yr-1. Average annual rainfall erosivity increases by between 5.02% (5779 MJ mm ha-1 h-1 yr-1) in 2011−2040 and 14.20% (6284 MJ mm ha-1 h-1 yr-1) in 2071-2099. The magnitude of change varies, depending on the GCM (ECHAM4, GFDL R-30, NCAR CCSM3 and HadCM3, Table 4) and the emission scenario (A1b, B1, A2 and B2, Table 4). The largest increase of 35.27% (7444 MJ mm ha-1 h-1 yr-1) occurs under GFDL R-30, B2 scenario in 2071-2099. In addition, there is a decrease in rainfall erosivity: from a baseline value of 5503 MJ mm ha-1 h-1 yr-1, rainfall erosivity decreases by -4.62% (5249 MJ mm ha-1 h-1 yr-1) for GFDLR-R30 under A2 scenario in 2011-2040 to -9.87% (4960 MJ mm ha-1 h-1 yr-1) in 2041-2070. The use of multiple GCMs and emission scenarios helps to address uncertainties inherent in climate models.
| Climate models | GHGES | Annual rainfall erosivity (MJ mm ha-1 h-1 yr-1) | Mean change (%) | Stdev. | ||
|---|---|---|---|---|---|---|
| Min | Max | Mean | ||||
| Baseline | 3679 | 7869 | 5503 | 0.00 | 851 | |
| 2011-2040 | ||||||
| ECHAM4 | A2 | 3236 | 9094 | 5550 | 0.85 | 948 |
| B2 | 3081 | 8922 | 5212 | -5.29 | 884 | |
| GFDL R-30 | A2 | 4790 | 6316 | 5249 | -4.62 | 457 |
| B2 | 6335 | 9136 | 6828 | 24.08 | 796 | |
| NCAR CCSM3 | A2 | 5158 | 6097 | 5601 | 1.78 | 210 |
| A1B | 5202 | 6211 | 5675 | 3.13 | 226 | |
| B1 | 5280 | 6239 | 5736 | 4.23 | 215 | |
| HadCM3 | A2 | 3923 | 9612 | 6266 | 13.87 | 1144 |
| B2 | 3622 | 9330 | 5894 | 7.11 | 1116 | |
| Average | 4514 | 7884 | 5779 | 5.02 | 666 | |
| 2041-2070 | ||||||
| ECHAM4 | A2 | 3345 | 9296 | 5692 | 3.43 | 938 |
| B2 | 3163 | 9192 | 5509 | 0.11 | 945 | |
| GFDL R-30 | A2 | 4373 | 5978 | 4960 | -9.87 | 476 |
| B2 | 6831 | 10068 | 7347 | 33.51 | 950 | |
| NCAR CCSM3 | A2 | 5573 | 6488 | 6012 | 9.25 | 200 |
| A1B | 5841 | 6866 | 6329 | 15.01 | 225 | |
| B1 | 5573 | 6661 | 6089 | 10.65 | 242 | |
| HadCM3 | A2 | 4108 | 10366 | 6554 | 19.10 | 1217 |
| B2 | 3811 | 9721 | 6145 | 11.67 | 1140 | |
| Average | 4735 | 8293 | 6071 | 10.32 | 704 | |
| 2071-2099 | ||||||
| ECHAM4 | A2 | 4002 | 11183 | 6709 | 21.92 | 1103 |
| B2 | 3272 | 9639 | 5570 | 1.22 | 983 | |
| GFDL R-30 | A2 | 4386 | 6030 | 5060 | -8.05 | 471 |
| B2 | 6467 | 9410 | 7444 | 35.27 | 776 | |
| NCAR CCSM3 | A2 | 5668 | 6652 | 6152 | 11.79 | 218 |
| A1B | 5780 | 6604 | 6217 | 12.97 | 169 | |
| B1 | 5415 | 6474 | 5906 | 7.32 | 240 | |
| HadCM3 | A2 | 4447 | 11383 | 7153 | 29.98 | 1338 |
| B2 | 4054 | 10031 | 6349 | 15.37 | 1183 | |
| Average | 4832 | 8601 | 6284 | 14.20 | 720 | |
Table 4: Spatial statistics of annual rainfall erosivity and mean changes for all climate projections, as compared to the baseline period (1971-2000).
Conclusion
This study estimates the impacts of climate change on precipitation and rainfall erosivity in the Upper Nan watershed, Thailand. In this study, a multi-climate model and a multi-emission scenario approach are used for the estimation of climate change impacts. The change factor, or the delta change method, is used as a downscaling technique to generate future precipitation data. The relationship between monthly precipitation and rainfall erosivity can be used to estimate monthly rainfall erosivity under future climate. The results of this study indicate that rainfall erosivity changes are not unidirectional and vary depending on greenhouse gas emission scenarios and land use scenarios. The expected increase in precipitation, caused by global climate changes, may have positive effects on the rehabilitation of vegetation in the Upper Nan watershed. The two principal measures that should be used in the Upper Nan watershed to control soil erosion are planting and engineering. Such changes may affect other factors like protective cover. Improved vegetation conditions will lead to a decrease in the cropping factor, resulting in a somewhat lower soil erosion rate than would otherwise be the case. The relationship between rainfall erosivity and monthly precipitation was extended in the study to obtain an estimate of changes in erosivity due to the potential changes in rainfall in the Upper Nan watershed. The expected increase in rainfall erosivity may have significant effects on soil and water conservation in the study area. Thus, the presumable increase in erosion potential will make more soil conservation efforts necessary in the watershed. However, the quantity and resolution of the results of this study need to be improved by subsequent investigations.
Acknowledgements
The authors would like to thank the Siam University of Thailand for financial assistance provided to the first author for his PhD at the Asian Institute of Technology (AIT), Thailand. We are also thankful to the Southeast Asia START Regional Center for providing the PRECIS: ECHAM4 data, the National Center for Atmospheric Research (NCAR) for providing the NCAR Community Climate System Model (CCSM) projections and the Thai Meteorological Department (TMD) for providing the historical precipitation data.
References
- IPCC (2007) The physical science basis. In: Solomon S et al. (Edn) Contribution of Working Group I to the Fourth Assessment Report of the Intergovernmental Panel on Climate Change, Cambridge University Press, Cambridge, UK.
- LDD (2000) Soil Erosion in Thailand, Soil and Water Conservation Division, Land Development Department: Bangkok, Thailand.
- Wischmeier WH, Smith DD (1978) Predicting Rainfall Erosion Losses. A Guide to Conservation. Agricultural Handbook 537. US Department of Agriculture: Washington, DC.
- Renard KG, Foster GA, Weesies GA, McCool DK, Yoder DC (1997)Â Predicting Soil Erosion by Water: A Guide to Conservation Planning with the Revised Universal Soil Loss Equation (RUSLE). In USDA Agriculture Handbook; AgriculturalResearch Service: Washington, DC, USA703: 400-404.
- Capolongo D, Diodato N, Mannaerts CM, Piccarreta M, Strobl RO (2008) Analyzing temporal changes in climate erosivity using a simplified rainfall erosivity model in Basilicata (Southern Italy). Â J Hydrol 356: 119-130.
- Lee JH, Heo JH (2011) Evaluation of estimation methods for rainfall erosivity based on annual precipitation in Korea. J Hydrol 409: 30-48.
- Roose E (1977) Application of the universal soil loss equation in West Africa. In: Greenland DJ, Lal R (Edn) Soil Conservation and Management in the Humid Tropics. John Wiley and Sons, Chichester, United Kingdom 177-188.
- Renard KG, Freimund JR (1994) Using monthly precipitation data to estimate the R-factor in the revised USLE. J Hydrol 157: 287-306.
- Lin CY, Lin WT, Chou WC (2002) Soil erosion prediction and sediment yield estimation: the Taiwan experience. Soil Tillage Res 68: 143-152.
- Zhang XC, Liu WZ (2005) Simulating potential response of hydrology, soil erosion, and crop productivity to climate change in Changwu tableland region on the Loess Plateau of China. Agr Forest Meteorol 131: 127-142.
- Zhang XC, Nearing MA (2005) Impact of climate change on soil erosion, runoff and wheat productivity in central Oklahoma. Catena 61: 185-195.
- Favis-Mortlock DT, Savabi MR (1996) Shifts in rates and spatial distributions of soil erosion and deposition under climate change. In: Anderson MG, Brooks, SM (Eds.) Advances in Hillslope Processes, Wiley Chichester 1.
- Williams J, Nearing MA, Nicks A, Skidmore E (1996) Using soil erosion models for global change studies. J Soil Water Conserv 51: 381-385.
- Favis-Mortlock DT, Guerra AT (1999) The implications of general circulation model estimates of rainfall for future erosion: a case study from Brazil. Catena 37: 329-354.
- Nearing MA (2001) Potential changes in rainfall erosivity in the U.S with climate change during the 21st century. J Soil Water Conserv 56: 229-232.
- Pruski FF, Nearing MA (2002) Climate-induced changes in erosion during the 21st century for eight U.S. locations. Water Resour Res 38: 1298.
- Favis-Mortlock DT, Boardman J (1995) Nonlinear responses of soil erosion to climate change: a modelling study on the UK South Downs. Catena 25: 365-387.
- Favis-Mortlock DT, Guerra AT (2000) The influence of global greenhouse-gas emissions on future rates of soil erosion: a case study from Brazil using WEPPCO2. In: Schmidt J (Edn) Soil Erosion: Application of Physically Based Models. Springer-Verlag, Berlin.
- Zhang XC, Liu WZ, Li Z, Zheng FL (2009) Simulating site-specific impacts of climate change on soil erosion and surface hydrology in southern Loess Plateau of China. Catena 79: 237-242.
- Zhang XC (2005) Spatial downscaling of global climate model output for site-specific assessment of crop production and soil erosion. Agr Forest Meteorol 135: 215-229.
- Mullan DJ,Favis-Mortlock DT, Fealy R (2012) Addressing key limitations associated with modelling soil erosion under the impacts of future climate change. Agr Forest Meteorol 156: 18-30.
- LDD (2006) Land Use Map of Nan Province, Land Use Planning Division, Bangkok, Thailand.
- Brown LC, Foster GR (1987) Storm erosivity using identical intensity distributions. Trans ASAE 30: 379-386.
- Richardson CW, Foster GR, Wright DA (1983) Estimation of Erosion Index from Daily Rainfall Amount, T. ASAE 26: 153-160.
- Bagarello V, Asaro F (1994) Estimating single storm erosion index. ASAE 37: 785-791.
- Petkovsek G, Mikos M (2004) Estimating the R factor from daily rainfall data in the sub-Mediterranean climate of southwest Slovenia. HydrolSci J 49: 869-877.
- Delworth TL, Stouffer KW, Dixon MJ, Spelman TR, Knutson AJ, et al. (2002) Review of simulations of climate variability and change with the GFDL R30 coupled climate model. ClimDyn 19: 555-574.
- Minville M, Brissette F, Leconte R (2008) Uncertainty of the impact of climate change on the hydrology of a Nordic watershed. J Hydrol 358: 70-83.
- Diodato N,Bellocchi G (2010)MedREM, a rainfall erosivity model for the Mediterranean region. JHydrol 387: 119-127.
- Xin Z, Yu X, Li Q, Lu XX (2010) Spatiotemporal variation in rainfall erosivity onthe Chinese Loess Plateau during the period 1956–2008. Regional Environ Change1 1: 149-159.
Citation: Plangoen P, Babel MS (2014) Projected Rainfall Erosivity Changes under Future Climate in the Upper Nan Watershed, Thailand. J Earth Sci Clim Change 5: 242. DOI: 10.4172/2157-7617.1000242
Copyright: © 2014 Plangoen P, et al. This is an open-access article distributed under the terms of the Creative Commons Attribution License, which permits unrestricted use, distribution, and reproduction in any medium, provided the original author and source are credited.
Select your language of interest to view the total content in your interested language
Share This Article
Recommended Journals
Open Access Journals
Article Tools
Article Usage
- Total views: 16413
- [From(publication date): 12-2014 - Jul 13, 2025]
- Breakdown by view type
- HTML page views: 11634
- PDF downloads: 4779