Rain Fed Rice Agriculture under Climate Variability in Southeast Asia: The Case of Thailand
Received: 11-Aug-2015 / Accepted Date: 31-Aug-2015 / Published Date: 10-Sep-2015 DOI: 10.4172/2157-7617.1000297
Abstract
This study was undertaken to analyze historical climate variability and quantify its impacts on rice production in the Ping River Basin, Northern Thailand. Catchment based climate gradient trend showed Upper Ping received the highest rainfall followed by Lower Ping and Middle Ping, respectively. Temperature and evaporation increased with decreasing altitude. The Ping climate exhibited high spatiotemporal variability. Temperature had an increasing trend but no significant trend in rainfall during the period of 1961-2010. Multiple regression models significantly explained 54% (P<0.01) rice yield, 43% (P<0.01) total production, and 47% (P=0.01) rice area temporal variation by climatic factors variability in Ping Basin, respectively. A critical impact assessment of climate variability on rice production showed that highest yield gap of 48%, planted area loss as high as of 55% and yield loss of 32% were observed. These losses in planted area and productivity are of paramount importance from food security perspective opting appropriate adaptation strategy at basin level. Planting of rice could be done Mid May to end of May in Upper and Middle Ping catchments while end of May to first week of June in Lower Ping without waiting until Mid-June and early July. Our findings indicate that there is a need to modify rice crop calendar that would ensure farmers to obtain better yield. This proposed adjustment of crop calendar will encourage farmers to plant early in May and harvest in September to avoid risk of flooding in October as an adaptation strategy in the face of prevailing climate variability.
Keywords: Climate variability; Climate parameters; Crop calendar; Ping river basin; Rice production; Thailand; Trend
11898Introduction
Agriculture is the main stay of Thailand economy accounting for 25% of GDP and for over 60% of total exports. Rice is the country’s most important crop economically and culturally. The total area under rice is estimated to be about 11 million ha occupying 55% of the total cropped land [1,2]. The climate of Thailand is under the influence of Monsoon, Inter Tropical Convergence Zone (ITCZ), and Tropical Cyclone. The climate of Ping River Basin is dominantly affected by Monsoon. The three distinct seasons in Northern Thailand are Monsoon (rainy season), winter and summer. Rainy season or Southwest Monsoon Season (May to Mid-October) is dominated by the southwest monsoon, during which time rainfall in the north is at its heaviest [3]. Thailand climatology exhibits a strong trend and inter-decadal variability. The variability in recent decades (Post-1980) seems to be strongly ENSO and it is the main cause of many of the disastrous Interannual climate fluctuations affecting tropical and sub-tropical countries [4,5]. According to Aree Wattana Tummakird [6], 1°C temperature rise was observed during the last 40 years period in Thailand but this estimate doesn’t manifest inconsistency of climate variability (annual, Interannual and decadal variability, trend and anomalies) that can impact on agriculture, environment and society with possible natural climatic disasters like flooding and drought. Accurate understanding of climate variation is of paramount importance to recognizing and understanding their effect on humans and environment [7]. Climate variability associated with the ENSO cycle has a range of implications for different socio-economic sectors in Southeast Asia. Climate variability contributes significantly to poverty and food insecurity and it is more important than climate change to rice farmers in Ping River Basin. Farmers may be forced to adjust crop calendar in response climate variability. Assessment of the adverse effects of climate variability on agriculture might help to properly anticipate and adapt farming to optimize agricultural production [8]. In this article, three major issues related to climate variability, impacts of climate variability on rain-fed rice production and adaptation strategies in the face of varying climate are addressed. Historical analysis of climate (1961-2010) in terms of pattern, variability and trend would help understand the historical perspective of climate and identify anomalous years. Impact assessment of historical climate on rain-fed rice production (1981-2009) helps quantify impacts brought about by climate variability on rice production (area, total production and productivity). There is no comprehensive study to date on Ping climatology and its impacts on rice production. Integrated regional and local area-based climate variability impact studies would generate up to date information for better understanding of impacts. Outputs of such studies will be inputs for further sector-based assessment to generate holistic results on realistic climate variability impacts. Furthermore, such studies will have policy and planning implications at local level in designing locally fit adaptation strategies to minimize effects of climate variability and sustain rice production in the basin. This article follows multidisciplinary approach, integrates and bridges the disciplines of climatology, agriculture, and GIS to generate the desired outputs. It deals with impact of spatiotemporal climate variability on rain-fed rice production and addresses the following issues:
a) Historical climate variability analysis (1961-2010) of three catchments and the Ping Basin,
b) Identification of the trend and periods of anomalies in the last 50 years,
c) Impact of climate variability on rain-fed rice production through regression modeling,
d) Critical impact of anomalous years of climate on planted area loss, yield loss or increment, and yield gaps and losses in total production of rain-fed rice attributed to climate variability, and
e) Adaptation strategy against existing climate variability for the sustainability of agricultural production through crop calendar adjustment and popularization of new varieties and agronomic practices such as transplanting.
The study area: The Ping river basin, Northern Thailand
The Ping River Basin is the major watershed in Northern Thailand. The basin is strategically important in terms of its upstream location, population density, economic integration, and as a cultural center [9]. It covers 5 provinces (Chiang Mai, Lamphun, Tak, Kamphaeng Phet and Nakhon Sawan) with geo-coordinates of location of latitude (15.7 °N to 19.8°N) and longitude (98 °E to 100.1°E). The topography of the basin includes hilly and mountains, valley, and lowland plains (Figure 1). With a catchment area of about 35,000 km2, the Ping River Basin covers about 22 percent of the Chao Phraya river system and contributes 24 percent of the system’s average annual runoff (annual average run of 9,073 Mm3) and population of 2,384,946. The upper catchment includes Chiang Mai and Lamphun and the middle catchment represented by Tak while the lower catchment covers Kamphaeng Phet and small portion of Nakhon Sawan. Rice is the major crop followed by orchards, maize, cassava, sugarcane, beans and other minor crops. The rice production system is characterized mainly by rain-fed production in the wet season and irrigated rice in the dry season. The major production constraint of rain-fed rice production in Ping Basin is climate variability [1,2,10]. Forests are highly threatened as a result of encroachment for cash and energy crops [2,11,12].
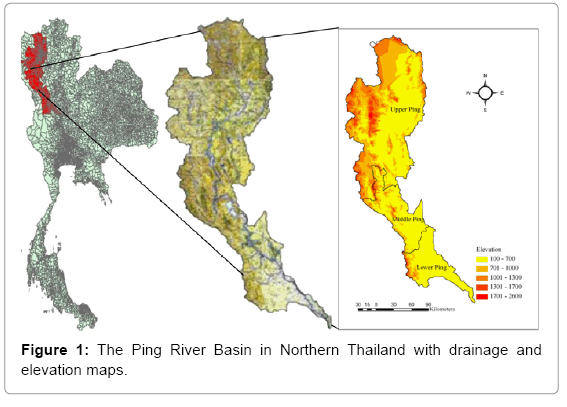
Figure 1: The Ping River Basin in Northern Thailand with drainage and elevation maps.
Methodology
Data acquisition, analysis and output generation processes are summarized in Figure 2.
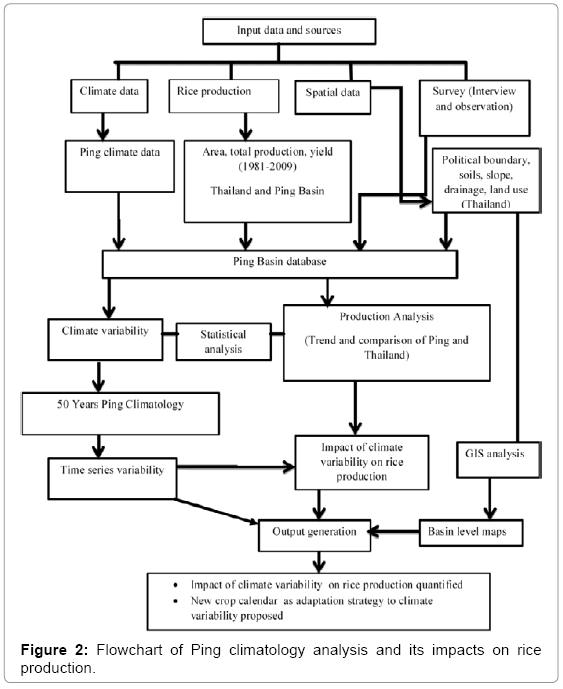
Figure 2: Flowchart of Ping climatology analysis and its impacts on rice production.
Data acquisition
Data acquisition included both primary and secondary data sources and methods. Climate data (1961-2010) acquired from Thailand Meteorological Department while rice production data (area, production, and productivity) for the period of 1981-2009 was acquired from Office of Agricultural Economics (OAE), Department of Agricultural Extension (DOAE), and National Statistical Office (NSO) of Thailand. Basic spatial data (GIS maps of Ping Basin) were extracted from Thai GIS, DIVA GIS. ORG, Chiang Mai University, GISTDA (Geo Information and Space Technology Development Agency, Thailand), and Northern Regional Offices of Agriculture and Land Development Department. Crop management data were collected from interview, key informants, northern regional offices and existing reports. Location information and characteristics were collected through field recording. Input data of climate and rice production for analysis included:
1. 50 years (1961-2010) climate data: Temperature (maximum, minimum and mean), rainfall and relative humidity.
2. 30 years (1980-2010) climate data of extreme maximum and extreme minimum temperature and evaporation for Ping River Basin.
3. Climatological base year (1961-90): Time series data should be compared with standard climatological base year of known 30 years period [13] (WMO). The 1961-90 period was selected as baseline for climate variability, trend and anomaly comparison of 50 years climatological period (1961-2010).
4. GIS data of Northern Thailand, Ping Basin and Thailand.
5. Rice production (area, total production, and yield) of Thailand and Ping Basin for the period of 1981-2009.
Data processing and analysis
This includes both GIS and statistical analysis.
GIS manipulation, analysis and output generation: This covered geo processing operations to prepare Ping. GIS operations such as geo processing (union, intersection and clipping) were carried out in ARCGIS10 to extract geo data from their sources to clip in to the study area. These include deriving biophysical geo data, administrative boundaries and land use and infrastructure data. The geo database of Ping River Basin was prepared through geo processing and image classification.
Field survey
Interview: Farmers and key informants in the three catchments of Ping Basin (Upper, Middle, and Lower Ping) were interviewed about the overall history and trend of rice production, agronomic practices, climate variability challenges, constraints and coping strategies. Their responses included extension packages (input application such as varieties, fertilizer, land preparation, etc.), crop calendar, pest and disease control, operation sequences, cropping patterns, perception on climate variability and disaster, and coping strategies against climate variability.
Statistical analysis: Out of 31 main meteorological stations in Northern Thailand, 6 stations are located in Ping Basin and 3 representative stations were selected based on representativeness and availability of complete dataset. These are Chiang Mai, Tak and Nakhon Sawan representing Upper, Middle and Lower Ping catchments, respectively. Data Analysis was done at 3 catchment zones (Upper, Middle, and Lower Ping catchments) and at Ping basin level for all variables. Temporal climate variability (annual, inter annual and decadal variability); time series trend; climate anomaly and index; rice production (area, total production, and yield) were input data for climate variability and impact analysis. Software packages used include ARC GIS 10 and Statistical packages (Excel, MINITAB 15.3 and SPSS 20). Farmers and key informants were interviewed about the overall history and trend of rice production, agronomic practices, climate variability challenges, constraints and coping strategies. Their responses included input application, operation sequences, cropping patterns, perception on climate variability and coping strategies against climate variability. Statistical analytical tools included descriptive statistics, correlation, regression, ANOVA and Mann-Kendall trend. Descriptive summary was prepared for each parameter to derive statistics at catchment and Ping Basin level. Normality test was done to check the distribution pattern of parameters and to choose appropriate statistical tests (parametric or nonparametric tests). Monthly, annual, decadal and long term climate data descriptive statistics, graphs and summary were prepared. Pearson’s bivariate correlation coefficient as a measure of linear association between climate and production variables was executed to explore their degree of relationship and r and p-values calculated. Regression analysis was undertaken to quantify impact of climate variability on rice production. Independent variable (s), Xs (predictors) and dependent variable, Y (predictand) in multiple regression models are represented by the equation:
Y = β0 + β1X1 + β2X2 + β3X3 + ----------
Where, β0 is a constant (regression intercept), β1,β2,β3 are the slopes (the regression coefficients, β1=y2-y1/x2-x1). Y is the impact estimator (crop yield, area) while Xs , are the climate variables. Multicollinearity between predictor variables was checked through stepwise regression. Goodness of fit between observed and predicted data for model validation was explored by regressing observed and predicted values and its degree of fitness is expressed in “r2” value [14,15].
Time series (temporal) trend test (parametric and non- parametric tests) was undertaken through regression and Mann Kendall trend test to detect temporal trend of variables [16,17].
Temporal climate variability: Measures of climate variability (C.V., annual, inter-annual, and decadal variability, index, and anomaly) were calculated. Critical impacts of anomalous years on extreme loss (gain) of yield and production, yield gap, and loss of planted area were calculated on the basis of formulae in Table 1. Detail of how production loss (gain) assessment and yield gap were calculated is presented as follows:
| S.N. | Parameter | Formula |
|---|---|---|
| 1 | Coefficient of variation (C.V.) | 100 *Standard Deviation Average |
| 2 | Inter-annual variability | Difference between two consecutive years(Δ) |
| 3 | Annual variability(AV) | Annual climate data- long term mean climate data( μ) or(Climate variability, t= Annual climate, t-Average climate) |
| 4 | Rainfall index (δi) | δi=(Pi-μ)/σ, (δ is rainfall index for year , Pi is annual rainfall for year i and μ is mean rainfall and σ as standard deviation) |
| 4 | Anomaly | Main value of particular year-normal average base year climatological data |
| 6 | Productivity loss or gain | Yield loss (%)=[(Annual yield loss or gain (t\ha)*100)]/ Average catchment yield) |
| 7 | Planted area loss | Loss of planted area (%)= [Area loss*100]/planted area |
| 8 | Catchment yield gap | Yield gap (%)=[yield gap (t\ha)*100]/ Highest catchment yield in the time series period |
Table 1: Climate and crop parameters calculation.
a) Production= Area * Productivity
b) Productivity loss
– Yield loss (t\ha) = Annual yield- Average catchment yield
– Yield loss (%) = [(Yield loss (t\ha)*100)]/Average catchment yield
c) Area loss
– Loss of planted area = Planted area-Harvested area
– Loss of area (%) = [(Area loss*100)]/ Planted area
d) Total production loss: Total production loss (tones) = Area loss * annual productivity
e) Catchment yield gap
– Base (best) year: highest productivity in 29 years taken as 100%
– Yield gap (t\ha) = highest yield-annual yield
– Yield gap (%) = [Yield gap (t\ha)*100]/ Highest yield
– Average catchment yield gap (t\ha) = Highest yield- catchment average yield
– Average catchment yield gap (%) = [Average catchment yield gap*100]/ Catchment highest yield in the time series period.
f) Temporal yield variability = [Annual yield]-[Temporal average yield]
Yield gap was calculated based on highest attained yield in the years 1981-2009 in each catchment and Ping Basin.
Results and Discussion
The ping basin climatology
Overall gradient climate trend: Catchment based 50 years climate data (1961-2010) analysis showed that the mean (normal) temperature was 27.44°C while mean maximum temperature of 34.27°C and mean minimum temperature was 20.7°C and mean rainfall was 1123 mm at Ping River Basin. The climatological base year (1961-1990) mean maximum temperatures was 37.3°C and mean minimum temperature of 20.7°C and mean rainfall of 1200 mm indicating that the base period had higher temperature and rainfall than the 50 years (1961- 2010) normal climate. Temperature and evaporation increased with descending altitude. Upper Ping received the highest rainfall followed by Lower Ping and Middle Ping, respectively. The upper catchment exhibited higher rainfall (1172 mm) followed by lower catchment (1142 mm) and the middle catchment received the lowest amount of rainfall (1056 mm) and no gradient trend was observed for rainfall. Coefficient of Variation (C.V) is the measure of spatiotemporal climate variability. Rainfall was highly variable with coefficient of Variation of 19% followed by minimum temperature (10%) and maximum temperature (4%). Descriptive statistics of long term (50 years average) of climate variables of Ping catchments is presented in Table 2.
| Catchment | Max T | MinT | MeanT | ExtMaxT | ExtMinT | TotalRF | Rainydays | RH | Evap |
|---|---|---|---|---|---|---|---|---|---|
| Upper Ping | |||||||||
| Mean (μ) | 33 | 19.2 | 26.03 | 41.03 | 10.6 | 1171.47 | 116.96 | 71.62 | 4.14 |
| St.dev (σ ) | 1.24 | 2.10 | 0.61 | 0.92 | 1.75 | 213.59 | 11.38 | 3.32 | 1.12 |
| CV (%) | 4 | 11 | 2.3 | 2.2 | 16.5 | 18.2 | 9.7 | 4.6 | 27 |
| Middle Ping | |||||||||
| Mean (μ) | 34.68 | 21.08 | 27.79 | 43.54 | 11.46 | 1056.15 | 104.34 | 67.88 | 5.11 |
| St.dev (σ) | 1.61 | 2.11 | 0.53 | 0.92 | 2.17 | 199.75 | 15.53 | 2.32 | 0.46 |
| CV (%) | 4.6 | 10 | 1.9 | 2.1 | 18.9 | 18.9 | 14.9 | 3.4 | 8.9 |
| Lower Ping | |||||||||
| Mean (μ) | 35.13 | 21.95 | 28.51 | 42.22 | 13.45 | 1141.72 | 108.34 | 70.63 | 5.30 |
| St.dev (σ) | 1.31 | 2.04 | 0.50 | 0.99 | 1.85 | 226.09 | 13.36 | 3.16 | 0.47 |
| CV (%) | 3.7 | 9.3 | 1.8 | 2.3 | 13.8 | 19.8 | 12.3 | 4.5 | 8.9 |
Table 2: Time series averaged climatological data by variable and catchment (1961-2010). Where, Max and Min. T (Maximum and minimum temperature, Ext Max and Min (Extreme maximum and minimum temperature), Total RF (total annual rainfall), RH (Relative Humidity) and Evap (Evaporation).
Temporal climate variability and trend: Measures of climate variability in this study include temporal variability, trend, anomaly and index. Time series test through non parametric (Mann Kendall) and parametric (linear regression) of climate variables (1961-2010) showed significant trend in annual maximum and minimum temperature; annual variability of maximum and minimum temperature; minimum and mean temperature and relative humidity anomalies. There was no significant trend in annual rainfall, rainy days, and rainfall variability index; Interannual climate variability; annual rainfall and relative humidity variability; rainfall, rainy days and maximum temperature anomalies.
Temperature variability
Maximum temperature: It showed an increasing trend but not significant during pre-and post-1980 period trend in all catchments which is in line with the Thailand trend showing increasing trend. During pre-1980 period (1961-1979) the lower catchment had a relatively higher increment than the middle and upper catchments while the middle catchment showed more rising followed by lower and upper catchments, respectively. These two distinct clusters of maximum temperature (pre-and post-1980 periods) indicate that the pre-1980 period was warmer period than the post-1980 period and was above average and increasing trend during 1961-1978. There was sharp increase above average in 1979 and it was the warmest year during 1961-2010 period recording 2.1°C, 2.9°C and 2.5°C and 2.53°C above normal for upper, middle and lower catchments and Ping Basin, respectively. This sharp rise in temperature in the 1970s is attributed to ENSO occurrences in Thailand [5]. The first two decades of time period 1961-1979 had higher maximum temperature record for the basin and from 1980 onwards maximum temperature was lower than the pre- 1980 period. This finding is in line with global trends justifying that the standard base year of 1961-90 could be taken as climatological base year and local maximum temperature phenomenon is observed and global trend validated at local level (Figure 3). The year 1999 showed Sharp rise and was the warmest year in the post-1980 period for all catchments and was typical year for rise of maximum temperature and this year is also a global indicator of sharp climate shifts. There were two distinct cluster classes of maximum temperature; Pre- and post- 1980 periods. The pre-1980 period characterized by higher temperature than post-1980. The Upper Ping showed a rise of 0.48°C above normal in 2010 contrary to middle and lower catchments indicating that cool areas are getting warmer which is in line with global trend (Table 3).
| Climate variable | 1961-70 | 1971- 1980 | 1981- 1990 | 1991- 2000 | 2001-2010 |
|---|---|---|---|---|---|
| Thailand | |||||
| Rainfall (%) | +1.8 | +0.3 | −2.9 | −3.3 | +1.6 |
| Max.Temp (°c) | −0.2 | −0.4 | 0.00 | +0.4 | +0.4 |
| Min. Temp (°c) | −0.4 | −0.2 | +0.1 | +0.4 | +0.6 |
| Ping River Basin | |||||
| Rainfall (%) | +1.8 | −0.45 | −0.87 | -0.67 | +6.3 |
| Max.Temp (°c) | +1.71 | +1.31 | −1.13 | -1.01 | −0.89 |
| Min. Temp (°c) | −2.56 | −2.04 | +1.10 | +1.54 | +1.95 |
Table 3: Decadal temperature and rainfall variability in Thailand and Ping River Basin.
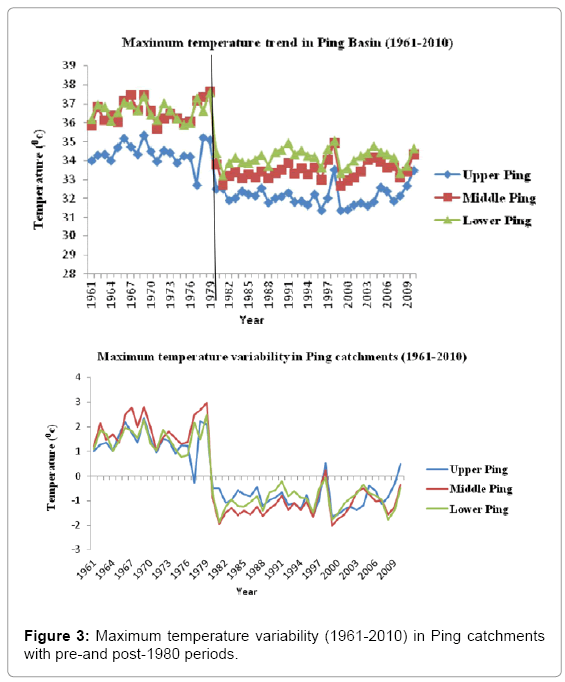
Figure 3: Maximum temperature variability (1961-2010) in Ping catchments with pre-and post-1980 periods.
Minimum temperature: It was below average but increasing trend during1961-79 but sharp rise above average in 1980 in all catchments. The 1980 minimum temperature record shows rise of 2.3°C, 1.8°C and 1.5°C for upper, middle and lower Ping, respectively indicating that the upper catchment is getting warmer at a faster rate than the middle and lower catchments. Minimum temperature variability also confirms this finding in that the upper catchment is showing higher positive deviation from normal than the middle and lower catchments (Figure 4). The period 1981-2010 was characterized by increasing trend of minimum temperature in the basin. From 1980 onwards, there was faster increasing trend of minimum temperature than pre- 1980 period showing that seasons are getting hotter in recent years. This is also in line with global climate change and variability trends that some places are getting hotter in which cold periods of the year are getting hotter. This variability is manifested either by rise of maximum temperatures or increment of minimum temperatures so that years and seasons become hotter than their past climatic condition. Years prior to 1980 were below normal but post-1980 years are above normal for minimum temperature. Temperature variability shows deviation of annual temperature (negative or positive) as compared to long-term normal (average) temperature whereas anomaly shows deviation from the standard base year average (1961-90). Inter-annual and inter-decadal temperature variability was observed in terms of fluctuation, inconsistency, trend and extreme values and events, and anomalies. In the first 2 decades (1961-80), maximum temperature increased by 1.5°C and decreased by 1°C in the later decades (1981- 2010). Minimum temperature dropped by 2.3°C in the period 1961- 80 and increased by 1.53°C in the years 1981-2010 as compared to the long term 50 years normal temperature of 1961-2010. The change in minimum temperature has been occurring at faster rate than maximum temperature and showed consistent results with that of Thailand attributed to El Niño-Southern Oscillation (ENSO) events as important source of interannual/interdecadal variability in Thailand surface air temperatures. The overall warming trends of maximum temperature and minimum temperature in the 1980s and 1990s were consistent with the tendency for more frequent El Niño events and fewer La Niña events since the late 1970s [5].
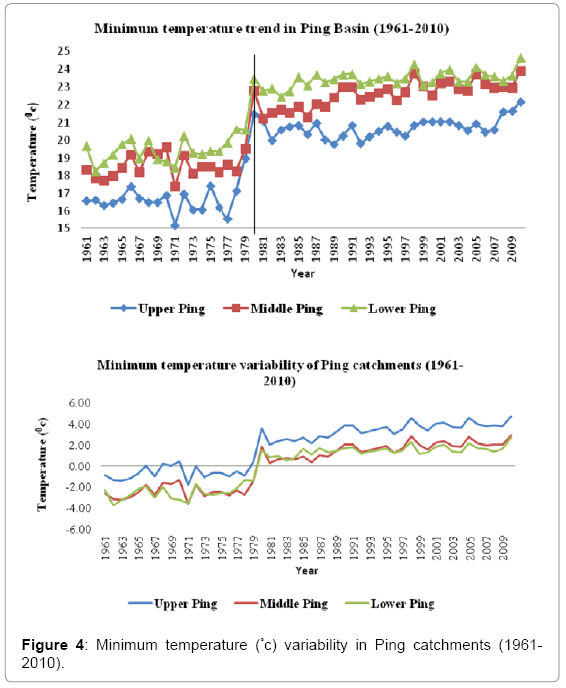
Figure 4: Minimum temperature (°c) variability in Ping catchments (1961- 2010).
Temperature anomaly: Anomalous years of temperature were screened to identify warmest and coldest years in the study period (1961-2010) at Ping River Basin. Accordingly, the year 1979 was the warmest year recording 2.5°C above normal maximum temperature. The year 1971 was the coldest year for both upper (15.18°C) and middle 7.4°C) catchments but the year 1972 was the coldest period in lower catchment (20.27°C) during the last 50 years (1961-2010). During 1980-2010, the middle catchment showed faster rate of minimum temperature increment (0.06°C) than the other catchments.
Extreme temperature: Extreme maximum of 44°C and minimum of 4°C were observed. Extreme maximum temperature was highly fluctuating and ranged between 38-44°C. Very high records of 43-44°C were observed in recent years (2004-2008). These recent inter annual extreme maximum temperatures would have had negative implications on agricultural production and environment. Extreme minimum temperature dropped sharply in 1999 recording 4°C in the upper Ping catchment whereas 6°C in middle and lower catchments in the same year. Years before and after 1999 had similar records between 8-16°C indicating that the year 1999 had extreme low temperature which is in line with global extreme events of the year 1999.
Rainfall variability, trend and index: Rainfall showed high variability with annual, Interannual and decadal fluctuation and no clear trend in all catchments. Rainfall and rainy days followed similar variability. Rainfall was highly variable evidenced by high annual and Interannual inconsistency and fluctuation and no clear trend. There was high inter-annual variability deviating up to 450 mm above long term average and up to 300 mm below normal average in some years. There was decadal anomaly of 19.46 mm in 1961-70 and -7.41 mm in the next 2 decades (1971-90). The decade 1991-2000 showed decline of rainfall (-75.45 mm) while the recent decade (2000-2010) was evidenced by increment of 70.80 mm indicating that the 1990s were deficit years and 2000-2010 as increased rainfall. It was also highly variable in terms of amount, intensity, onset and seasonal distribution. We classified years based on rainfall index to identify the wettest and driest years during 1961-2010. We found out that 1970 and 1988 were the wettest years and 1993 as the driest year for the three catchments during the period of 1961-2010. Normal seasonal distribution in the Ping Basin shows that September receives the highest rainfall (20.4%), followed by August (15.8%), May (14.2), July (11.5%) and June (11.1%) during the rainy season, respectively. Rainy season (May-October) contributes 84.7% while the dry season (November-April) contributes only 15.3% to the total annual rainfall in the basin. The Northern Thailand Region where the Ping Basin is located receives 76.8% rainfall in the rainy season and 23.2% in the dry season (winter and summer) showing that the amount of rainfall in the rainy season in Ping River Basin (84.7%) was found to be higher than the Northern Region [3,18]. Similar study on rainfall analysis in agricultural context was undertaken in India by Gopal Krishan et al. [19] to analyze rainfall pattern in Saharanpur District, Uttar Pradesh using monthly rainfall data for 30 years (1982- 2011) (Figure 5).
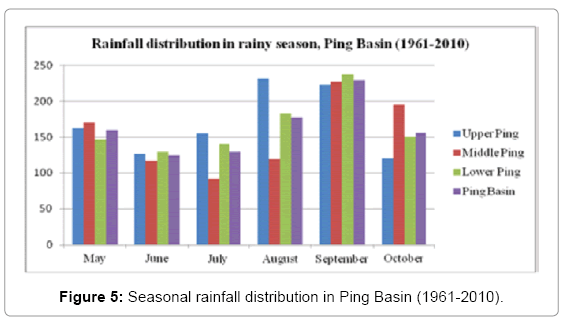
Figure 5: Seasonal rainfall distribution in Ping Basin (1961-2010).
Relative Humidity (%): There was no significant trend in relative humidity (R2=0.02). Years 1966 and 1977 were anomaly years for high humidity record in Upper and Lower Ping catchments, respectively. Other years were not significantly different from the normal average.
Evaporation: No significant trend (R2=0.04) was observed. It increased as we go down from upper to lower Ping catchment which is directly proportional to temperature increment when descending from upper to lower Ping justifying distinct altitudinal variation among the 3 Ping catchments.
Impact of climate variability on rice production in Ping River Basin
Rice production trend in the Ping River Basin (1981-2009): Time series rice production trend analysis showed significant trend in harvested area, annual production and productivity (yield. Rice production increased from 17,774,320 in 1980 to 31,597,200 Metric tons in 2010 (R2=0.86).
Rice area: Rice area significantly increased in Middle Ping (R2=0.56) at the rate of 526 ha\annum but significantly declined at the rate of 643 ha\annum (R2=0.62) in the Upper Ping but no significant trend was observed in Lower Ping, Ping Basin and Thailand during the period of 1981 to 2009. The decline of rice area in the Upper Ping is in line with our field survey indicating that rice fields in the hilly areas are being substituted by high value cash crops such as orchards, spices, flowers and bioenergy crops.
Rice production trend: Upper Ping had a declining trend of total rice production (R2=0.2) due to diminishing area trend but Middle (R2=0.73) and Lower Ping ((R2=0.64) had an increasing trend as a result of increased rice area in Middle Ping and large area coverage in Lower Ping.
Rice yield (t\ha): Comparison of rice yield (t\ha) in Thailand and Ping Basin (1981-2009) (Table 4) shows that Upper Ping had the highest average yield (3.33 t\ha) followed by Lower Ping (2.65 t\ha) and the Middle ping had the least yield record (2.58 t\ha). The Ping River Basin had higher average yield (2.86 t\ha) than that of the Northern Region (2.83 t\ha) and Thailand national average yield of 2.22 t\ha. Time series yield trend in Ping Basin (1981-2009) indicates that yield had an increasing trend in Ping River Basin with increasing rate per annum of 0.0154 t\ha, 0.0318 t\ha, 0.0551 t\ha, and 0.341 t\ha in Upper, Middle and Lower Ping catchments and Ping Basin, respectively. The temporal yield variability and potential in catchments could be attributed to seasonal distribution pattern of rainfall; runoff from upper catchment to middle catchment rendering advantage of more available water in middle Ping; availability of irrigation (Bhumibol dam in Middle Ping) and supplemental irrigation from Ping River for nearby farms in all catchments; temporal variation of other climatic factors (temperature, relative humidity and evaporation). Rice yield showed an increasing trend at the rate of 0.02, 0.03 and 0.06 tones\ha for upper, middle and lower catchments, respectively. It also showed similar trend at Ping Basin level (R2=0.66 at the rate of 0.034 tones\ha\annum) and Thailand (R2=0.87 at the rate of 0.035 tones\ha\annum) for the period of 1981- 2009. Rice yield trend and its variability showed an increasing trend from 2000 onwards in all catchments which may be attributed to recent rainfall increment after 2000 in the Ping Basin.
| Catchment | Rate\annum | Standard error | F-value | R2 | P-value | Mean |
|---|---|---|---|---|---|---|
| Maximum temperature (°c) | ||||||
| 1961-1979 | ||||||
| Upper Ping | 0.004 | 0.62 | 0.87 | 0.005 | 0.87NS* | 34.4 |
| Middle Ping | 0.007 | 0.61 | 1.1 | 0.006 | 0.29NS* | 36.6 |
| Lower Ping | 0.03 | 0.51 | 0.12 | 0.06 | 0.74NS* | 36.7 |
| 1980-2010 | ||||||
| Upper Ping | 0.002 | 0.52 | 0.05 | 0.001 | 0.82NS* | 32.1 |
| Middle Ping | 0.02 | 0.47 | 4.1 | 0.12 | 0.053NS* | 33.5 |
| Lower Ping | 0.005 | 0.46 | 0.35 | 0.01 | 0.56NS* | 34.2 |
| Minimum temperature(°c) | ||||||
| 1961-1979 | ||||||
| Upper Ping | 0.03 | 0.62 | 0.03 | 0.033 | 0.45NS* | 16.7 |
| Middle Ping | 0.02 | 0.61 | 1.12 | 0.06 | 0.31 NS* | 18.6 |
| Lower Ping | 0.05 | 0.62 | 4.5 | 0.2 | 0.049 | 19.5 |
| 1980-2010 | ||||||
| Upper Ping | 0.024 | 0.5 | 5.7 | 0.17 | 0.023 | 20.75 |
| Middle Ping | 0.06 | 0.64 | 1.1 | 0.6 | 0.001 | 22.63 |
| Lower Ping | 0.03 | 0.62 | 4.5 | 0.3 | 0.001 | 23.5 |
| 1961-2010 | ||||||
| Upper Ping | 0.123 | 0.72 | 125.5 | 0.72 | <0.0001 | 19.2 |
| Middle Ping | 0.131 | 0.9 | 220 | 0.82 | <0.0001 | 21.1 |
| Lower Ping | 0.123 | 0.98 | 164 | 0.77 | <0.0001 | 21.95 |
| Rainfall (mm) | NS* (0.581) | |||||
*NS- No Significant trend.
strong>Table 4: The overall climate trend of Ping Basin (1961-2010).
Correlation between production and climate variables: Pearson’s bivariate correlation test was done at three temporal scales (correlation among climate variables (1961-2010), 1980-2010 to include evaporation and extreme temperatures, and correlation among climate and production variables (1981-2009). Highly significant correlation was observed between year (time) and minimum temperature (0.74), relative humidity (0.55), yield (0.81) and total production (0.77), respectively. Maximum and minimum temperatures had highly significant negative correlation (-0.87). During the period of 1981- 2009, maximum temperature was also positively correlated with extreme temperatures and evaporation. Rainfall, rainy days and relative humidity were significantly (positively) correlated while evaporation had significant negative correlation with rainfall, rainy days and relative humidity. Minimum temperature and relative humidity were positively correlated with yield and total production during 1981-2009 and were taken as predictor variables in the regression modeling to quantify impact of climate variability on rice production.
Impact of climate variability on rice production: Multiple regression techniques are applied to assess and explain impacts. They are used to identify yield constraints, to quantify their impacts on yield and to predict yield [14]. Various workers [15,20-22] have applied regression modeling to quantify the temporal impact of climate variability on crop production. Minimum temperature and relative humidity were selected for regression analysis to assess the effect of climate variability on temporal rice production (yield and total production) variation. The functional relationship between independent (climate variables) and dependent variables (yield and total production) was denoted as:
Yield and total production = f (minimum temperature, relative humidity).
Other climatic factors (maximum temperature correlated with minimum temperature and rainfall and rainy days correlated with relative humidity) were dropped as redundant factors as they can mask and jeopardize the robustness of the regression equation. Multiple regression models significantly explained 54% (p-value=0.001) yield variation and 43% (p-value=0.001) variation of total production by climatic factors variability in Ping Basin. The remaining unexplained variation could be attributed to other lurking variables of crop production influencing biophysical and crop management factors. The remaining unexplained variation in yield could be attributed to other lurking variables of crop production influencing biophysical and crop management factors. Comparison of linear and nonlinear (second degree polynomial) regression models showed that linear regression model was found to be more robust and fit (R2=54%) than non-linear regression model (R2=46%) in estimating impact of climate variability on yield variation in Ping River Basin (1981-2009). This model result is in agreement with the interview responses of farmers and key informant and existing reports that indicated climate variability (especially of rainfall onset, intensity, and seasonal distribution) is the key limiting factor of rain-fed rice farming in Ping Basin (Field survey, 2010). Regression models equations for yield and total production prediction are presented below (Table 5).
| Dependent Variable | Regression Model |
|---|---|
| Yield | Y= −5.39+0.4Min.T+0.42RH |
| Total production | Y= −1572235+0.37Min.T+0.44RH |
Where, Min T= Minimum Temperature; RH= Relative Humidity
Table 5: Regression models equations for yield and total production prediction.
Regression model validation: The above models were verified and validated through fitness test between observed and predicted data of Ping Basin and they showed good level of fitness for yield (R2=55%) and total production (R2=50%). The models have reasonably estimated observed values. Critical impact of climate variability of anomalous years on production losses/gains and yield gaps are assessed, calculated and quantified and associated with seasonal rainfall distribution. Yield variability due to climatic variation in middle and lower catchment was higher than upper catchment as the middle and lower catchments had higher rate of increasing trend and variability of climatic factors. Climate anomalies can cause extreme disasters like flooding and drought. The World Bank estimated 1,425 billion baht (US$ 45.7 billion) in economic damages in Thailand due to the 2011 flooding. An estimated damage of 1.6 million ha of cultivated areas, of which 1.28 million was paddy with estimated loss of 6-7 million tons was reported [23]. Impact of climate variability on rice production is explained in terms of area, total production and yield [24]. Yield was variable from year to year and this Interannual variability could not be tapped through regression and every year was checked and related to loss in planted area, loss or increment in yield and total production, and yield gap. Other methods other than regression should be sought to tap their impacts on agricultural production (area and yield). Extremely anomalous yield in anomalous years were calculated and attributed to climatic factors such as rainfall seasonal distribution, availability of runoff from flooding to the next catchment (from upper to middle catchment flooding) and availability of irrigation from Bhumibol dam (Middle Ping) and supplemental irrigation from Ping River. Productivity loss of 24% (1992) and increment of 15% (2005) with total production loss of 6484 tones and 5466 tones for the years 1992 and 2005 with yield gap of 34% was observed in Upper Ping. Productivity loss of 30% (1983) and area loss of 17%, total production loss of 19,367 tones and increment (gain) of 30% was observed in 2004 in Middle Ping. In Lower Ping, planted area loss of 55 % (1990) and productivity loss (32% in 1990) and increment of 33% in 2005, and yield gap of 48% in 1990 were observed. The losses in productivity are attributed to unbalanced seasonal rainfall distribution and moisture availability is critical during seedling (May-July) and grain filling (Late August- Mid September) stages. Loss in planted area is caused by flooding during harvest time (October). Some farmers take advantage of supplemental irrigation from Ping River and Bhumiphol dam during deficit period to boost their production.
Climate variability and crop calendar adjustment as adaptation strategy: The onset and end of the southwest monsoon in the Lower Mekong Basin in terms of rainfall are remarkably consistent (Mekong River Commission (MRC), 2010). Though onset of Monsoon was consistent the rainfall intensity effective for rice planting was highly variable and inconsistent forcing farmers to adjust their planting period from May through July depending sufficiency of rainfall amount, intensity and distribution (Field survey interview, 2010). Before two decades farmers of the Ping River Basin used to plant rice in May because effective rainfall started in May and was consistent but in the last two decades onset of effective rainfall was not consistent as per their response. They adapted a risk aversion strategy through their exposure to the climate uncertainty, fluctuation and inconsistency of onset of rainfall by widening and extending gap of planting date May through July in response to onset and intensity of rainfall for effective planting. According interview response of farmers and department of agriculture official reports, the existing crop calendar of rice in Ping Basin covers May to November. Planting is done Mid-May to early July and harvesting (4-5 months after planting) in October to November based on seasonal rainfall distribution. July planting faces danger of flooding in October during harvest. Adjustment of crop calendar is one of the adaptation strategies against climate variability [25]. Periods prior to 2000 showed fluctuation of rainfall and rainy days and farmers adopted and extended planting period from May to July and harvest was frequently hampered due to October flooding. Rainfall significantly increased in all catchments during May 2006-2012. May rainfall for the period of 1961-2000 shows negative deviation from normal but from 2001-2012 it is showing an increasing trend above normal. An increment of 19%, 38% and 10.4% May rainfall (2006- 2010) and rainy days of 3.5%, 17.3% and 21% was observed in Upper, Middle and Lower Ping catchments, respectively. This is also supported by Projection by South East Asia START predicting that rainfall will increase in the near future. According to Mekong River Basin report (2010), the amount of rainfall will increase by 20% and the length of rainy season would remain the same but with higher rainfall intensity. The past decadal May rainfall data (2000-2012) indicate that planting of rice could be done Mid May to End May in Upper and Middle Ping catchments while end of May to first week of June in Lower Ping and no need to wait until Mid-June and July. Harvesting could be finished in September to avert risk of flooding during October harvest. The October rains could be used to promote double cropping and avail ample moisture and increased water use efficiency to second crop thereby boosting agricultural productivity and improving livelihood of farmers in the basin. Nevertheless, this is an indicative result as uncertainty in future climate prevails and an abrupt ENSO occurrence can happen at any time which can affect seasonal onset and cessation of rainfall. This result should be well supported by seasonal forecasts and the extension department should provide an early warning in time of unusual occurrences of ENSO in collaboration with regional Thai Meteorological Department (TMD) to manage undesired effects of ENSO. The proposed crop calendar may be synergized with introduction and popularization of early maturing varieties and transplanting of seedlings so that farmers are benefited from yield gains and minimize risk of flooding during harvest. This study will have policy implications for the SEA Region to indicate that ASEAN countries should give top priority for climate variability adaptation mechanisms through regional integrated planning and investment. This includes designing adaptation strategies such as adjustment of crop calendar, crop diversification, improving productivity, introduction and expansion of irrigation infrastructures, introducing early maturing varieties, transplanting methods, integrated flood management strategies to reduce disasters, agronomic practices for moisture conservation, integrated pest management practices to minimize effects of pest outbreaks due to unexpected climate variability, improvement of extension services, empower local knowledge of coping mechanisms and complement with new agricultural technologies, improve input supply (select seed, machinery, fertilizer, pesticides, and access to credit, and other inputs), and regional coordination for financial, technological, material and experience sharing is pivotal to create climate resilient society and sustain rice agriculture in South East Asia.
Conclusion
Catchment based gradient climate trend showed Upper Ping received the highest rainfall followed by Lower Ping and Middle Ping, respectively. Temperature and evaporation increased with decreasing altitude. The Ping Basin exhibited high spatiotemporal climate variability during 1961-2010. Temperature showed an increasing trend while there was no significant trend in rainfall. The Upper Ping catchment showed highest rate of increment in minimum temperature indicating that cool areas are getting warmer manifesting effect of global warming at local level. Though there is no significant trend in rainfall based on Mann Kendall trend test, its annual and inter-annual variability, anomaly and seasonal distribution pattern are of paramount importance for yield variability. Multiple regression models significantly explained 54% (p-value=0.001) yield and 43% (p-value=0.001) variation of total production by climatic factors variability in Ping Basin, respectively. The remaining unexplained variation in yield and total production could be attributed to other lurking variables of crop production influencing biophysical and crop management factors. A critical impact assessment of climate variability on rice production showed that highest yield gap of 48%, planted area loss as high as of 55% and yield loss of 32% were observed. Recent and future trends of May rainfall (2000 onwards) show an increasing trend above the 1961-2010 normal. Hence, planting of rice could be done Mid May to end of May in Upper and Middle Ping catchments while end of May to first week of June in Lower Ping and no need to wait until Mid-June and July. Our findings indicated the need to modify rice crop calendar that would ensure farmers to obtain better yield. This proposed adjustment of crop calendar will encourage farmers to plant early in May and harvest in September to avoid floods in October as an adaptation strategy in the face of prevailing climate variability. The proposed crop calendar may be synergized with introduction and popularization of early maturing varieties and transplanting of seedlings so that farmers are benefited from yield gains and minimize risk of flooding during harvest. This result should be well supported by seasonal forecasts and the extension department should provide an early warning in time of unusual occurrences of ENSO in collaboration with regional Thai meteorological department to manage undesired effects of ENSO. There is a need for detailed studies through multidisciplinary and integrated impact assessment methods and approaches to quantify the environmental and economic impacts of climate variability and thereby design effective adaptation strategy to sustain rice production in Ping Basin.
Acknowledgement
We express our gratitude to the Thai Meteorological Department (TMD), Office of Agricultural Economics and Department of Agricultural Extension (Ministry of Agriculture and Cooperatives, Thailand) and Northern Regional offices of Meteorology, Agricultural Extension, and Land Resources Development for sharing their data and information. Farmers of the Ping River Basin owe us too much for sharing their indigenous knowledge on climate variability adaptation and land management. Department of Geography (Dr. Arisara Charoenpanyanet and her team), Chiang Mai University was central in providing office and internet facilities and guidance of field survey. Rujee Rodcha (student of Remote Sensing and GIS, AIT) deserves acknowledgement for her facilitation and translation.
References
- DoAE (2012). Department of Agricultural Extension report, Ministry of Agriculture and cooperatives, Thailand.
- Office of Agricultural Economics (OAE) (2012) Ministry of agriculture and cooperatives, Statistical bulletin of crop production. Thailand.
- Chalalai J (2007) Climate dataset: Past and Future for Climate data, Thailand Meteorological Department, TMD,Thailand.
- Singhrattna N, Babel MS, Perret SR (2009) Hydroclimate variability and its statistical links to the large-scale climate indices for the Upper Chao Phraya River Basin, Thailand Discussion paper, Hydro Earth SystSci Discuss 6: 6659-6690.
- Atsamon L, Joaquim IG (2008) Empirical evidence for interannual and longer period variability in Thailand surface air temperatures. Atmospheric Res 87: 89-102.
- Aree WT (2006) Climate Change Impacts & Adaptation in Thailand. Workshop on Mainstreaming Policies and Investment in Low Carbon: Opportunities for New Approaches to Investment and Flexible Mechanisms.
- ADB (1994) Climate Change in Asia: Executive Summary. Asian Development Bank, Manila, Philippines, 122 pp.
- James WH (2004) Climate Variability and the Millennium Development Goal Hunger Target. International Research Institute for Climate Prediction, USA.
- Thomas DE (2006) Developing Watershed Management Organizations in the Ping River Basin, Thailand.
- Shinawatra B, Sukapong C, Woodtikarn P, Deundao P, Padermchai P, et al. (1992) Assessing the Impact of Farming Systems Research. In Proceedings of the 9th Thailand National Farming Systems Seminar, Phuket, Thailand.
- Shinawatra B, Patanun W (1994) Farmers' Choice of Rice Varieties in the Chiang Mai Valley. J Agricultural Econ Res 16: 37-54.
- Punpim PM, Nutchanart S (2009) Estimation of the URBS model parameters for flood estimation of ungauged catchments in the Upper Ping River Basin, Thailand. Science Asia 35: 49-56.
- IPCC WGI (2007) Contribution of Working Groups I, II and III to the Fourth Assessment Report of the Intergovernmental Panel on Climate Change Core Writing Team, Pachauri, RK and Reisinger A (Eds.) IPCC, Geneva, Switzerland 104.
- De Bie K (2000) Comparative Performance Analysis of Agro-Ecosystems. PhD Thesis, ITC/ Wageningen, The Netherlands.
- Weisberg S (2005) Applied Linear Regression. 3rd edition. New York, John Wiley & Sons Inc.
- Gilbert RO (1987) Statistical methods for environmental pollution monitoring. Van Nostrand Reinhold, New York.
- Kendall MG (1975) Rank correlation methods. (4thedn). Charles Griffin, London.
- Abbadi GR, Nitin KT, Peeyush S, Taravudh T, Chaya V (2012) Climate variability in Ping River Basin, Northern Thailand. In Nitin KT, Hamid M, RP De Silva (Eds.) 268-274.
- Gopal K, Pankaj G, Rao MS, Kumar CP, Rajesh A (2012) Rainfall Trend Analysis in Saharanpur District of Uttar Pradesh- agricultural context. Excel Publishers, New Delhi, India.
- Christoph M, Alberte B, Alexander P, Katharina W, Marianela F (2010) Climate change impacts on agricultural yields. Potsdam Institute for Climate Impact Research (PIK), Germany.
- Pedram R,David BL, Marc L, Navin R (2011) Climate variability and crop production in Tanzania. J Agricultural Forest Meteorol 151:Â 449-460.
- Timothy RW, Peter QC, Richard HE, John RP, Vara Prasad PV (2000) Temperature variability and the yield of annual crops. Agriculture, Ecosystems & Environ 82: 159-167.
- World Bank (2012) 2011 Thailand floods and the World Bank Support to post-floods recovery effort.
- Gommes R (1999) Production variability and losses: Agroclimatic concepts. FAO Research, Extension and Training Division.
- FAO (2007) Adaption to climate change in agriculture, forestry and fisheries: Perspectives, frameworks and Priorities (FAO-Interdepartmental working group on climate change).
Citation: Reda AG, Tripathi NK, Soni P, Tipdecho T (2015) Rain Fed Rice Agriculture under Climate Variability in Southeast Asia: The Case of Thailand. J Earth Sci Clim Change. 6: 297. DOI: 10.4172/2157-7617.1000297
Copyright: © 2015 Reda AG, et al. This is an open-access article distributed under the terms of the Creative Commons Attribution License, which permits unrestricted use, distribution, and reproduction in any medium, provided the original author and source are credited.
Select your language of interest to view the total content in your interested language
Share This Article
Recommended Journals
Open Access Journals
Article Tools
Article Usage
- Total views: 17304
- [From(publication date): 10-2015 - Jul 13, 2025]
- Breakdown by view type
- HTML page views: 12492
- PDF downloads: 4812