Reducing Uncertainty on Global Precipitation Projections
Received: 04-Dec-2013 / Accepted Date: 20-Dec-2013 / Published Date: 28-Dec-2013 DOI: 10.4172/2157-7617.1000178
Abstract
In order to study the future of freshwater availability, reliable precipitation projections are required. Potential future changes in global precipitation are investigated by analyzing the Global Climate Models’ projections. However, these projections cannot be used in their native form on climate change impact studies, due to the high systematic errors and biases that they feature, limiting the applicability of these projections. Various methodologies have been developed to correct the precipitation bias, including dynamical and statistical methods. Here we present a global precipitation ensemble projection for the 21st century. We use a multi-segment statistical bias correction method that radically reduces the correction-induced uncertainty to the precipitation. The ensemble consist of results from three different global climate models for A2 and B1 emission scenarios, in order to reduce the uncertainty related to the model selection. The results show significant changes in areal mean and extreme precipitation during the 21st century for the A2 and B1 emission scenarios. For all simulations, the results show that the global mean and extreme precipitation will increase under both scenarios, indicating a more intense forthcoming global water cycle.
Keywords: Global precipitation; Climate change projections; Bias correction
5686Introduction
Global Change will seriously affect the hydrological processes and alter the supply of ecosystem services that are vital to human well-being [1,2]. For the twentieth-century, changes that cannot be explained by natural forcing or internal climate variability have been detected in average precipitation within latitudinal bands [3]. For the twentyfirst century an increase of about 6% per kelvin of global warming for the globally averaged 20-yr return values of annual extremes daily precipitation is projected based on results from a multi-scenario, multi-model climate change simulations ensemble [4].
Raw climate model outputs cannot be used in their native form on climate change impact studies, due to the high systematic errors and biases that they feature [5-7]. Methods of statistical bias correction are increasingly being developed and adopted as means to use climate models’ projections in impact models. These methods involve some form of transfer function [8-11], or techniques for equalization of statistical characteristics between modelled and observed precipitation [7,12-14].
Methodology
The change in future precipitation (2001-2100) period was assessed in annual basis as % change relative to the mean 1960-2000 observed precipitation. The extreme precipitation, defined as the average of precipitation values exceeding the 99.9th percentile, is assessed for changes during 21st century. The recently presented, multi-segment bias correction (MSBC) method, described in Grillakis [15], was used to correct the precipitation data for its biases. The methodology has the ability to better transfer the observed precipitation statistics to the raw GCM data. The method utilizes multiple discrete segments on the Cumulative Density Function (CDF) to fit multiple theoretical distributions, as opposed to the commonly used single transfer function at the entire CDF space. Pragmatically, the method eliminates to a large extent the bias in mean precipitation, while significantly reducing the bias of the higher quantile of the precipitation CDF associated with extreme precipitation events. The methodology was applied separately to each calendar month of the year in order to correct the seasonality of the precipitation. The results of the method were obtained for the 21 different areas of the world according to Giorgi and Francisco [16]. Here we present the bias correction results for 8 of the areas.
Case Study
The daily global precipitation output of three Global Climate Models (GCMs), the ECHAM5 [17], the IPSL [18] and the CNRM [19] between 1960 and 2100 was analysed. The GCMs data were corrected for biases using the 20th Century (1960-2000) WATCH Forcing Data observed precipitation (WFD) of EU FP 6 project WATCH [20]. The spatial resolution of the three GCMs ranges between ~200 km for ECHAM5 and ~300 km for CNRM and IPSL. However, they were interpolated to 50 km resolution, to meet the Watch Forcing Data resolution [20].
The MSBC methodology was applied between the WFD and each GCM for the period 1960-2000, removing the respective biases of the three GCM model data. Then the established transfer functions were applied to the projection period of 2001-2100 for the three GCMs.
The MSBC is compared to a well-established bias correction method presented in Piani [11] (hereafter called WSBC) which was used to correct biases of the same three GCM data used in this study, for the EU funded WATCH research project.
Results
The initial difference between the overland latitudinal average of observed and past GCM average annual precipitation are shown in Figure 1a. The added value of MSBC is shown in Figure 1b where the remaining bias between the corrected GCM data using MSBC and WSBC, and the observed precipitation for the control period (1960-2000) are presented. The deviations between observed mean and the corrected past GCM mean, using both methods, show that the MSBC method presents better bias correction performance than WSBC, at every latitude. The deviation in mean precipitation of MSBC methodology compared to observations does not exceed 1%, while values achieved with WSBC are constantly above 1% and frequently over 10%. The reduction of the remained bias in the corrected past GCM data leads to more trustful future projections (Figure 1c) comparing to WSBC method (Figure 1d), as it is shown at -50 to -60 degrees where the WFD mean ranges between 800 and 1000 mm/year and the WSBC corrected precipitation ranges between 1500 and 2000 mm/year. Similar findings can be seen at 20 to 30 degrees and >70 degrees, where the remaining bias in WSBC exceeds 10% (Figure 1b).
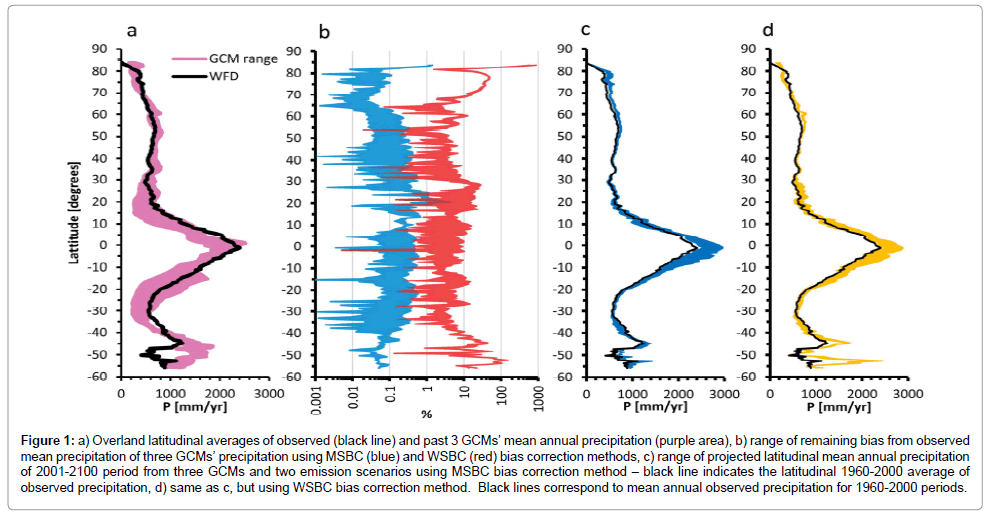
Figure 1: a) Overland latitudinal averages of observed (black line) and past 3 GCMs’ mean annual precipitation (purple area), b) range of remaining bias from observed mean precipitation of three GCMs’ precipitation using MSBC (blue) and WSBC (red) bias correction methods, c) range of projected latitudinal mean annual precipitation of 2001-2100 period from three GCMs and two emission scenarios using MSBC bias correction method – black line indicates the latitudinal 1960-2000 average of observed precipitation, d) same as c, but using WSBC bias correction method. Black lines correspond to mean annual observed precipitation for 1960-2000 periods.
On a global scale, the precipitation average of 2000-2100 is projected to increase by 8.8% and 6.5% for A2 and B1 emission scenarios [21], respectively, while projected simulation results corrected with WSBC project an increase of 8.1% and 6.4%. The signal of regional change in precipitation is robust between both scenarios as shown in Figure 2 global maps, with A2 changes to be more pronounced. Large areas of Central America, the Mediterranean, Southern South America, Northern and Southern Africa and South Australia will experience decreases in mean precipitation ranging between -5% and -40% for the studied scenarios A2 and B1 respectively, and in some areas the decrease may be even greater. Indeed, the ensemble annual precipitation projection of the three GCMs for eight regions of the world is presented in the surrounding diagrams of Figure 2.
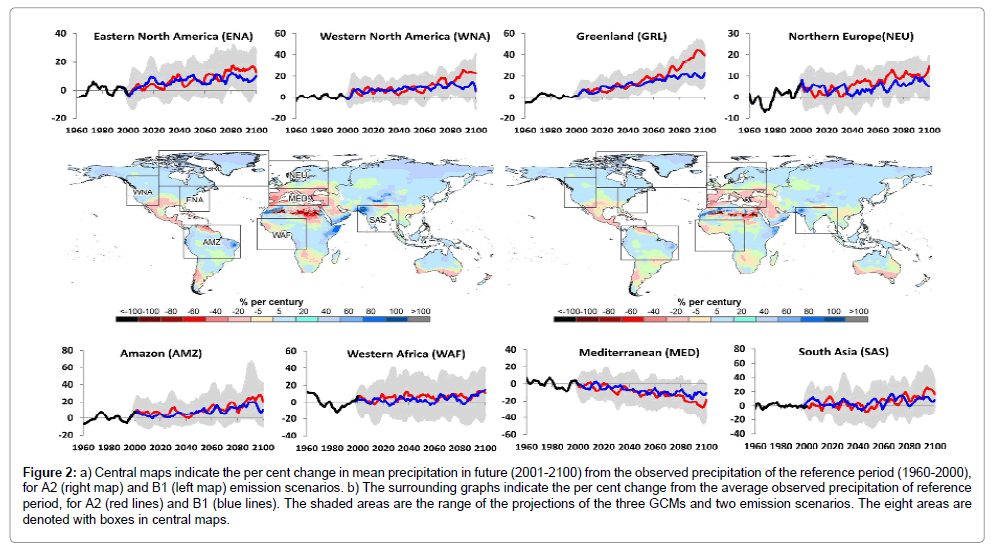
Figure 2: Precipitation change (%) of the values exceeding the 99.9th percentile for each one of the 8 areas of Figure 2, for each GCM and emission scenario and for the 2001-2100 period.
According to the ensemble projection, Eastern and Western North America is expected to become 10% to 20 % wetter in average by 2100, depending on the scenario used for projection. In all regions, the A2 scenario projections indicate more severe changes in the mean precipitation. The largest increase is projected for the region of Greenland, which is going to receive greater amounts of precipitation, with the ensemble A2 to show an increase of up to 40% by 2100. Northern Europe also shows a strong and clear increasing trend in precipitation ranging between 5% and 10% until 2100 compared to 1960 to 2000, contrary to the Mediterranean that shows decreasing trends of the order of –10% to -20% and small variability in the ensemble projection. South Asia, Western Africa and Amazon regions that belong to the tropical zone, show high variability amongst the projections, with a positive trend in precipitation change that ranges between 10% and 20%.
Extreme precipitation defined as precipitation values exceeding the 99.9th percentile, is expected to increase according to all three GCMs and two emission scenarios, in all of the eight areas described before. According to Figure 3 all these areas will experience high precipitation events of greater magnitude in a daily basis. It is worth noting that all GCMs provide similar results in extreme precipitation increase in the eight studied areas. The increase ranges between 22% and 46 % for the A2 scenario while for B1, the increase ranges between 21% and 32 %. This is a robust signal of change in extreme precipitation events due to climate change in the 21st century. A general conclusion is that even in the Mediterranean region, despite the decreasing trend in mean precipitation that is projected between 2000 and 2100; the extreme precipitation is likely to increase by 23.5% and 22.5 % according to A2 and B1 scenarios, respectively. Similar trends of mean and extreme precipitation are projected from impact studies at a watershed scale in two of these areas: ENA [22] and MED [23].
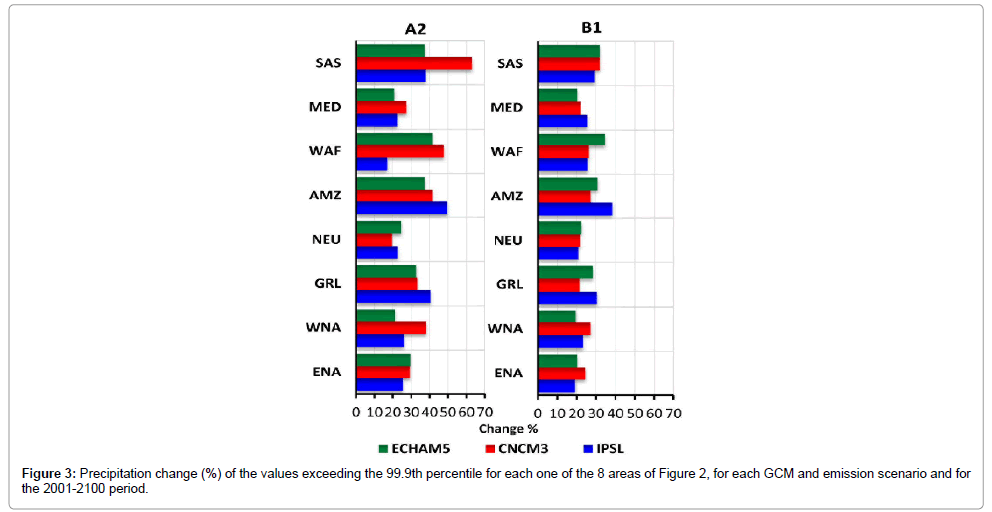
Figure 3: Precipitation change (%) of the values exceeding the 99.9th percentile for each one of the 8 areas of Figure 2, for each GCM and emission scenario and for the 2001-2100 period.
Fresh water resources management is one of the greatest challenges under the view of a changing climate. Large collaborative projects like Water Model Intercomparison Project (WaterMIP) strive to analyze the impact of climate change on the global water cycle. Global climate model projections under a range of greenhouse gas scenarios and land surface hydrological models are essential components of strategic resource management. It is widely accepted that GCM projected components of the hydrological cycle, like precipitation, cannot be directly used to force hydrological simulations without the application of some form of bias correction. The bias correction has an impact on the climate change signal of the same order of magnitude as uncertainty on the choice of GCM or the hydrological model [24]. A recently presented bias correction technique that radically reduces the correction induced uncertainty of the precipitation is used. Notwithstanding the uncertainty in the climate modelling and the variability between the climate projections, a robust signal of mean and extreme precipitation changes is presented here. Considerable increase in global precipitation mean and extreme precipitation, along with decrease in mean precipitation, indicate an intensification of the future global water cycle.
Acknowledgements
The financial support of this work has been provided by the European Commission through the FP6 WATCH, FP7 ECLISE and FP7 COMBINE projects.
References
- Schröter D, Cramer W, Leemans R, Prentice IC, Araújo MB, et al. (2005) Ecosystem service supply and vulnerability to global change in Europe. Science 310: 1333-1337.
- Schaller N, Mahlstein I, Cermak J, Knutti R (2011) Analyzing precipitation projections: A comparison of different approaches to climate model evaluation. J Geophys Res 116: 27.
- Zhang X, Zwiers FW, Hegerl GC, Lambert FH, Gillett NP, et al. (2007) Detection of human influence on twentieth-century precipitation trends. Nature 448: 461-465.
- Kharin VV, Zwiers FW, Zhang X, Hegerl GC (2007) Changes in Temperature and Precipitation Extremes in the IPCC Ensemble of Global Coupled Model Simulations. J Clim 20: 1419-1444.
- Wood AW, Leung LR, Sridhar V, Lettenmaier DP (2004) Hydrologic Implications of Dynamical and Statistical Approaches to Downscaling Climate Model Outputs. Clim Change 62: 189-216.
- Sharma D, Das GA, Babel MS (2007) Spatial disaggregation of bias-corrected GCM precipitation for improved hydrologic simulation: Ping River Basin, Thailand. Hydrol Earth Syst Sci 11: 1373-1390.
- Leander R, Buishand TA (2007) Resampling of regional climate model output for the simulation of extreme river flows. J Hydrol 332: 487-496.
- Fowler HJ, Blenkinsop S, Tebaldi C (2007) Linking climate change modelling to impacts studies: recent advances in downscaling techniques for hydrological modelling. Int J Climatol 27: 1547-1578.
- Déqué M (2007) Frequency of precipitation and temperature extremes over France in an anthropogenic scenario: Model results and statistical correction according to observed values. Global Planet Change 57: 16-26.
- Block PJ, Souza FA, Sun L, Kwon HA (2009) Streamflow Forecasting Framework using Multiple Climate and Hydrological Models1. JAWRA J Am Water Res Assoc 45: 828-843.
- Piani C, Haerter J, Coppola E (2010) Statistical bias correction for daily precipitation in regional climate models over Europe. Theor Appl Climatol 99: 187-192.
- Horton P, Schaefli B, Mezghani A, Hingray B, Musy A (2006) Assessment of climate-change impacts on alpine discharge regimes with climate model uncertainty. Hydrol Proc 20: 2091-2109.
- Engen-Skaugen T (2007) Refinement of dynamically downscaled precipitation and temperature scenarios. Clim Change 84: 365-382.
- Leander R, Buishand TA, van den H, Bart JJM, Marcel de Wit JM (2008) Estimated changes in flood quantiles of the river Meuse from resampling of regional climate model output. J Hydrol 351: 331-343.
- Grillakis MG, Koutroulis AG, Tsanis IK (2013) Multi-segment statistical bias correction of daily GCM precipitation output. J Geophys Res 118: 3150-3162.
- Giorgi F, Francisco R (2000) Uncertainties in regional climate change prediction: a regional analysis of ensemble simulations with the HADCM2 coupled AOGCM. Climate Dynamics 16: 169-182.
- Roeckner E, Bauml G, Bonaventura L, Brokopf R, Esch M, et al. (2003) The atmospheric general circulation model ECHAM5. Part I: Model description. Max Planck Institute for Meteorology 349: 127.
- Hourdin F, Mousat I, Bony S, Braconnot P, Codron F, et al. (2006) The LMDZ4 general circulation model: climate performance and sensitivity to parametrized physics with emphasis on tropical convection. Clim Dynamics 27: 787-813.
- Royer JF, Cariolle D, Chauvin F, Deque M, Douville H, et al. Simulation des changements climatiques au cours du XXIe siècle incluant l’ozone stratosphérique. Comptes Rendus Geosci 334: 147-154.
- Weedon GP, Gomes S, Viterbo P, Shuttleworth WJ, Blyth E, et al. (2011) Creation of the WATCH Forcing Data and Its Use to Assess Global and Regional Reference Crop Evaporation over Land during the Twentieth Century. J Hydrometeorol 12: 823-848.
- Nakicenvoic N, Davidson O, Davis G, Grübler A, Kram T, et al. (2000), Special Report on Emissions Scenarios. A Special Report of Working Group III of the Intergovernmental Panel on Climate Change. Cambridge University Press: Cambridge, UK.
- Grillakis MG, Koutroulis AG, Tsanis IK (2011) Climate change impact on the hydrology of Spencer Creek watershed in Southern Ontario, Canada. J Hydrol 409: 1-19.
- Tsanis I, Koutroulis A, Daliakopoulos I, Jacob D (2011) Severe climate-induced water shortage and extremes in Crete. Clim Change 106: 667-677.
- Hagemann S, Chen C, Haerter AO (2011) Impact of a Statistical Bias Correction on the Projected Hydrological Changes Obtained from Three GCMs and Two Hydrology Models. J Hydrometeorol 12: 556-578.
Citation: Tsanis IK, Grillakis MG, Koutroulis AG, Jacob D (2013) Reducing Uncertainty on Global Precipitation Projections. J Earth Sci Clim Change 5: 178. DOI: 10.4172/2157-7617.1000178
Copyright: ©2013 Tsanis IK, et al. This is an open-access article distributed under the terms of the Creative Commons Attribution License, which permits unrestricted use, distribution, and reproduction in any medium, provided the original author and source are credited.
Select your language of interest to view the total content in your interested language
Share This Article
Recommended Journals
Open Access Journals
Article Tools
Article Usage
- Total views: 15731
- [From(publication date): 2-2014 - Aug 16, 2025]
- Breakdown by view type
- HTML page views: 11107
- PDF downloads: 4624