Research Article Open Access
Research on Unsustainable Embodied Oil Leakage and Its InfluenceFactors in China's Export Trade
Keqiang Guo and Baosheng Zhang*
School of Business Administration, China University of Petroleum, China
- *Corresponding Author:
- Baosheng Zhang
School of Business Administration,
China University of Petroleum, Beijing, China
Tel: +86-010-8973-3792
E-mail: bshshysh@cup.edu.cn
Received Date: January 19, 2017; Accepted Date: January 28, 2017; Published Date: February 07, 2017
Citation: Guo K, Zhang B (2017) Research on Unsustainable Embodied Oil Leakage and Its Influence Factors in China’s Export Trade. Oil Gas Res 3:131. doi: 10.4172/2472-0518.1000131
Copyright: © 2017 Guo K, et al. This is an open-access article distributed under the terms of the Creative Commons Attribution License, which permits unrestricted use, distribution, and reproduction in any medium, provided the original author and source are credited.
Visit for more related articles at Oil & Gas Research
Abstract
Over the past few decades, China has “leaked out” massive oil resource through exporting different kinds of products, which intensified the county’s energy dilemma and obviously is unsustainable. The aim of this paper was to calculate the total and industrial amount of oil embodied in China’s export during 2002~2012 and to analyze its influence factors. An exported embodied oil model was built based on the Input Output Analysis, and the influence factors of embodied oil were decomposed into energy utilization technology, export structure and export scale on the basis of the Structure Decomposition Analysis. The results indicated that the direct and the complete oil consumption efficiency in 2012 are lower than that in 2002. The total exported embodied oil grows from 0.58 × 10⁸ tons in 2002 to 1.11 × 10⁴ tons in 2012, which accounts for a large percentage of the domestic oil consumption. The enlargement of export scale is the main positive promotion for embodied energy increase in exports during 2002~2007 and 2007~2012, and the energy utilization technology is the key factor for the part of negative influence in embodied energy decrease. Though the export structure factor doesn’t play a key role in embodied energy change in exports, comparing with the other two factors, it has substantial potential for decreasing the exported embodied oil. Finally, policy suggestions were proposed based on the results to improve the situation.
Keywords
Embodied oil flow; Export trade; Input-output; Structure decomposition analysis; China
Introduction
After the accession to the World Trade Organization (WTO), China’s integration with the global economy has contributed to sustained growth in international trade. Both its exports and imports have grown faster during the past dozen years, while China’s trade surplus increased dramatically. Although this trend was affected by the global financial crisis and the international political volatility, the Chinese government has made some plans recently to promote the economic prosperity, including “Silk Road Economic Belt and the 21st-Century Maritime Silk Road” [1] and “Made in China 2025” [2], and so forth. Under these background, China’s export trade will keep on developing predictably. On one hand, the huge trade surplus has brought China a great amount of foreign exchange reserve; on the other hand, it also cost China significant volumes of energy [3], because all goods and services produced in an economy are directly and/or indirectly associated with oil use [4].
The debate on the impacts of international trade on energy flow is not new. Many researchers have studied the embodied energy/carbon imports or exports for a number of countries and regions, such as Brazil [4], China [5], the United Kingdom [6], and the United States [7], and so on. These studies show that there are a lot of energy flow embodied in the international trade, which is not often considered and still not sufficiently clear. In China’s energy supply system, oil highly dependent on import, and the gap between its consumption and production has been increasing quickly. At the same time, with the continued growth of international trade, China are “leaking” a large number of oil through exporting different kinds of products, which is unsustainable. It is significant and urgent to answer the questions including, but are not limited to: How many embodied oil are exported? Which export industrial sectors are most oil-consuming? What is the major driving force factors of the increase for the embodied oil export? The aims of this paper focus on calculating the amount and the pathway of oil flow embodied in China’s export trade by using the Input Output Model and the Structure Decomposition Analysis. The study hopefully offers consultations for a sustainable development and management of China’s international trade.
Methodology and Data
Basic input output model
The Input-Output Analysis was firstly developed by Leontief in the 1930s, which has been widely used for analyzing the economic relationship of linkages between different sectors. The basic Input- Output Model can be expressed as equation (1):

Where, X and Y represent exogenous and endogenous accounts respectively, I is identity matrix, and A is the technical coefficient matrix that can be expressed as equation (2):

Where I = (1,n); j= (1,n); n is the count of sectors in an economy system; aij is the technical coefficient, also called as direct consumption coefficient, which can be expressed as equation (3):

Where, xij is marked as sector j’s use of products from sector i; and xj is marked as the total output of sector j. The matrix (I – A)-1 is often called Leontief Inverse Matrix. Another important conception in the basic Input Output Model is complete consumption coefficient, denoted by bij, which measures how much direct and indirect output from sector i will be used in sector j’s one unit worth of value of final output. It can be expressed as equation (4):

Where, k means the middle sector. If the complete consumption coefficient matrix is set as B, i.e. B= (bij)n×n , the equation (4) can be solved and transferred to equation (5):

Exported embodied oil model
Based on the basic Input Output Model, the model for calculating oil flow embodied in international trade can be established as equation (6):
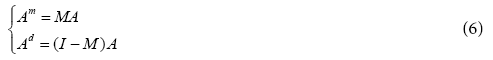
Where, EO is the amount of embodied oil in international trade; eoi is the amount of embodied oil in one unit worth of value of product i, i.e. embodied oil intensity; Vi is the total value of product i, in import or export trade. Before calculation the technical coefficient matrix A should be modified to eliminate the influence of the processing and manufacturing trade, for example, some products are made by imported semi-finished products and be exported again after assembled. Firstly, A can be distinguished to two parts: the imported middle products part Am and the domestic middle products part Ad, i.e., A = Am + Ad. Secondly, the import coefficient matrix M is set to establish equation (7):
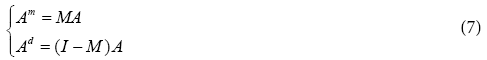
Where, M is a diagonal matrix that can measures the dependence of sector i on the imported middle products, and the element of the diagonal matrix, marked as mii, can be expressed as equation (8):

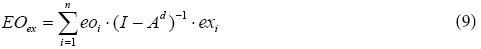
Where, Xi is the total output value of sector i, imi is the total import value of sector i and exi is the total export value of sector i. It is assumed in this analysis that the share of imported products in every sector are same. Finally, the model of calculating exported oil flow embodied in international trade can be expressed as equation (9):
Structure decomposition analysis
Based on the exported embodied oil model, the Structure Decomposition Analysis can be continued: firstly, set gi = eoi ( I − Ad)−1 , which is complete oil consumption of sector i; secondly, set si = exi / EX, where exi is the total export value of sector i as mentioned above, EX is the total export value of the country, and, so, si is the share of sector i’s export value on the total export of the country. Then, the exported embodied oil of sector i can be transferred to equation (10):

The amount of exported embodied oil are divided by this equation into three parts: the complete oil consumption coefficient, the structure of export and the scale of export, which are called the technology effect, the structure effect and the scale effect. The change of the exported embodied oil from time t1 to time t1 can be expressed as equation (11):

Equation (11) can be solved by using the Logarithmic Mean Divisia Index (LMDI) method. The solution are shown as equation (12):
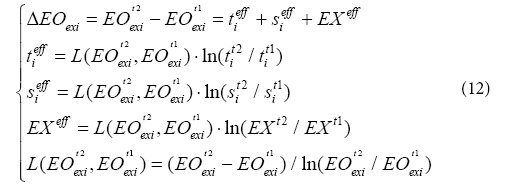
Where, represent the influence effects of the export embodied oil changes caused by technology, the structure of export and the scale of export.
Data
The oil consumption, the total output value of every industry, the technical coefficient matrix A between all industries and the import/ export value of every industry are needed to calculate the embodied oil flow. All of the data above are available from China’s statistical yearbooks and China’s Input Output tables that both released by the National Bureau of Statistics of China [8]. Classification of industries are different between the two data sources, so it should be modified for consistency. Twenty-eight industry sectors are used in this study, as shown in Table 1. It is worth noting that production values in different years are not directly comparable because of the fluctuations in prices. To solve this problem, all values in every year are converted based on 2002’s industrial constant prices.
NO. |
Industry Sectors |
|---|---|
| S1 | Agriculture, Forestry, Animal Husbandry, Fishery |
| S2 | Mining and Washing of Coal |
| S3 | Extraction of Petroleum and Natural Gas |
| S4 | Mining and Processing of Metal Ores |
| S5 | Mining and Processing of Non-Metal Ores, other Mining and Quarrying |
| S6 | Manufacture of food, beverages and tobacco |
| S7 | Manufacture of Textile |
| S8 | Manufacture of Apparel, Leather, Fur, Feather and Related Products |
| S9 | Processing of Wood and Manufacture of Furniture |
| S10 | Manufacture of Paper, Printing, Manufacture of Articles |
| S11 | Processing of Petroleum, Coking and Processing of Nuclear Fuel |
| S12 | Manufacture of Raw Chemical Materials and Chemical Products |
| S13 | Manufacture of Non-metallic Mineral Products |
| S14 | Smelting and Pressing of Metals |
| S15 | Manufacture of Metal Products |
| S16 | Manufacture of General and Special Purpose Machinery |
| S17 | Manufacture of Transport Equipments |
| S18 | Manufacture of Electrical Machinery and Apparatus |
| S19 | Manufacture of Computers, Communication and Other Electronic Equipment |
| S20 | Manufacture of Measuring Instruments and Machinery |
| S21 | Other Manufacture |
| S22 | Production and Supply of Electric Power and Heat Power |
| S23 | Production and Supply of Gas |
| S24 | Production and Supply of Water |
| S25 | Construction |
| S26 | Transportation, Postal, Telecommunication services |
| S27 | Wholesale, Retail Trade and Hotel ,Restaurants |
| S28 | Others |
Table 1: Modified industry sectors of China.
Results and Analysis
Crude oil utilization efficiency
The oil utilization efficiency, i.e. oil intensity, is indicated by two indicators in this paper: the direct oil consumption coefficient and the complete oil consumption coefficient. The results of the oil utilization efficiency in 2002, 2007 and 2012 are shown in Table 2. As for the direct coefficient, most sectors have sustained downward trend from 2002 to 2012 except a few industries, such as sector No. 11 (Processing of Petroleum, Coking and Processing of Nuclear Fuel). The direct coefficient of sector No.11 grown from 2.68 × 10⁴ to 2.72 × 10⁴ tons per 108 CNY during 2002~2007. As for the complete coefficient, the values are larger than their corresponding direct coefficients, because it calculates the total oil used in the whole industrial chain. The trends of changes are similar with the direct coefficient, but there are also a few exceptions, such as sector No. 26.
| Sector Number |
Direct Coefficient | Complete Coefficient | ||||
|---|---|---|---|---|---|---|
| 2002 | 2007 | 2012 | 2002 | 2007 | 2012 | |
| S1 | 0 | 0 | 0 | 876.98 | 731.36 | 940.81 |
| S2 | 2.94 | 0 | 0 | 1 018.15 | 1 357.45 | 980.19 |
| S3 | 10 350.52 | 2 907.41 | 2 283.31 | 11 463.62 | 5 270.57 | 4 071.06 |
| S4 | 0 | 0 | 0.02 | 2 995.97 | 3 429.23 | 2 302.63 |
| S5 | 0 | 0 | 59.43 | 1 938.73 | 1 766.66 | 1 808.97 |
| S6 | 0.91 | 0.17 | 0.01 | 807.29 | 654.99 | 531.07 |
| S7 | 0.06 | 0.08 | 0 | 1 105.04 | 968.60 | 706.57 |
| S8 | 0.18 | 0.17 | 0.06 | 975.88 | 852.41 | 584.17 |
| S9 | 0 | 0.17 | 0.11 | 1 361.65 | 964.34 | 744.82 |
| S10 | 0.84 | 0.41 | 0.05 | 1 177.95 | 964.04 | 733.98 |
| S11 | 26 818.31 | 27 163.25 | 26 297.79 | 33 276.90 | 30 798.34 | 29 569.79 |
| S12 | 1 169.96 | 474.00 | 357.31 | 4 009.03 | 3 315.91 | 2 643.19 |
| S13 | 85.47 | 6.84 | 2.07 | 2 099.47 | 1 487.32 | 1 375.23 |
| S14 | 9.42 | 0.11 | 0.04 | 2 491.50 | 2 839.04 | 1 908.99 |
| S15 | 0.07 | 0 | 0 | 1 741.09 | 1 417.36 | 1 052.81 |
| S16 | 0.26 | 0.09 | 0.01 | 1 390.96 | 1 110.15 | 754.03 |
| S17 | 0.05 | 0.03 | 0.01 | 1 240.12 | 872.58 | 619.40 |
| S18 | 0.70 | 0.10 | 0.02 | 1 575.27 | 1 309.36 | 941.29 |
| S19 | 0 | 0.08 | 0 | 874.19 | 502.18 | 331.81 |
| S20 | 0 | 0.07 | 0 | 1 136.17 | 691.68 | 471.15 |
| S21 | 1.52 | 0 | 0 | 997.43 | 862.44 | 671.58 |
| S22 | 87.55 | 3.02 | 0.63 | 1 981.67 | 1 602.80 | 1 164.38 |
| S23 | 0 | 2.83 | 0 | 4 571.51 | 1 671.34 | 1 044.66 |
| S24 | 0 | 0 | 0 | 912.96 | 971.64 | 654.66 |
| S25 | 1.49 | 0 | 0 | 2 019.23 | 1 711.40 | 1 347.90 |
| S26 | 88.44 | 45.22 | 18.62 | 2 415.59 | 3 039.84 | 2 149.65 |
| S27 | 0.05 | 0 | 0 | 903.36 | 605.31 | 359.93 |
| S28 | 0.26 | 0 | 0 | 804.36 | 884.12 | 824.91 |
| Average | 719.17 | 495.32 | 406.61 | - | - | - |
Note: based on 2002 price; unit is ton per 108 CNY.
Table 2: The direct and the complete oil utilization efficiency.
Amount of exported embodied oil
According to the model built above and annual data, the amount of oil embodied in China’s export trade of all industry sectors are calculated as shown in Table 3. The total domestic oil consumption in China and the proportion of exported embodied oil on the domestic consumption are also displayed in Table 3. With the rapid development of China’s export, export of “Made in China” especially, the amount of exported embodied oil is also grown. It can be seen from Table 3 that both the total domestic consumption of oil and exported embodied oil have massive growth from 2002 to 2012. The growth rate of exported embodied oil is 110%, which approximately equals that of domestic consumption (107%). In 2007, the percentage of exported embodied oil is around 34%, which means there are about 34% of China’s oil consumption are contributed to other countries through international trade. But the trend has revealed a clear decline trend after 2007. The main reasons include but not limit to: implement of China’s Energy Saving and Waste Reduction Plans made the energy use per unit GDP decline, the Global Economic Crisis affected China’s export trade scale, and China’s export structure were improved in recent years (Table 3). From the perspective of individual industry sector, the contributions of exported embodied oil vary widely, as shown in Table 4. Four sectors, No. 11 (Processing of Petroleum, Coking and Processing of Nuclear Fuel), No. 12 (Manufacture of Raw Chemical Materials and Chemical Products), No. 19 (Manufacture of Computers, Communication and Other Electronic Equipment) and No. 26 (Transportation, Postal, Telecommunication services) are the first four largest sources of exported embodied oil in 2002, 2007 and 2012, and their contributions account for 48%, 49% and 51% respectively (Table 4).
| 2002 | 2007 | 2012 | |
|---|---|---|---|
| Embodied Oil in Export�?104 tons�? | 5 289 | 11 635 | 11 129 |
| Domestic Oil Consumption�?104 tons�? | 22 541 | 34 032 | 46 679 |
| Share | 23.46% | 34.19% | 23.84% |
Table 3: China’s exported embodied oil and the share on domestic consumption.
| No. | 2002 | 2007 | 2012 | No. | 2002 | 2007 | 2012 |
|---|---|---|---|---|---|---|---|
| S1 | 41.59 | 35.14 | 37.10 | S15 | 185.57 | 433.95 | 359.89 |
| S2 | 16.05 | 19.48 | 3.70 | S16 | 181.84 | 600.02 | 709.36 |
| S3 | 138.70 | 39.73 | 28.61 | S17 | 81.04 | 302.42 | 368.51 |
| S4 | 5.60 | 13.87 | 6.03 | S18 | 320.23 | 766.22 | 850.63 |
| S5 | 29.30 | 21.68 | 14.56 | S19 | 434.27 | 1343.05 | 1315.95 |
| S6 | 72.13 | 112.22 | 114.15 | S20 | 168.55 | 241.26 | 88.60 |
| S7 | 300.56 | 724.61 | 291.83 | S21 | 42.57 | 86.60 | 26.42 |
| S8 | 270.83 | 463.34 | 547.32 | S22 | 10.16 | 9.23 | 7.22 |
| S9 | 90.74 | 217.15 | 225.47 | S23 | 0 | 0 | 0 |
| S10 | 116.27 | 214.11 | 371.49 | S24 | 0 | 0 | 0 |
| S11 | 875.19 | 1252.08 | 1399.78 | S25 | 21.12 | 56.63 | 64.74 |
| S12 | 872.52 | 1901.23 | 1849.49 | S26 | 381.97 | 1160.33 | 1059.75 |
| S13 | 87.70 | 207.30 | 296.25 | S27 | 260.88 | 259.33 | 299.14 |
| S14 | 114.91 | 873.14 | 528.00 | S28 | 168.83 | 281.28 | 264.72 |
Table 4: China’s industrial exported embodied oil in 2002, 2007 and 2012.
Influence factors of embodied oil
The change on the amount of embodied oil in international trade are derived from combined action of three effects (technology, structure and scale) by using the Structure Decomposition Analysis method.
The results of the analysis on embodied oil between 2002~2007 and 2007~2012 are displayed in Table 5. It can be seen from Table 5 that China’s exported embodied oil increased 6 346 × 104 tons from 2002 to 2007, while the increasing trend was restrained during 2007~2012 (decreased 507 × 104 tons). The scale effect is positive, while the technology effect and the structure effect are negative (Table 5). The industrial distributions of China’s exported embodied oil during 2002~2007 and 2007~2012 are also analyzed, as shown in Figures 1 and 2 respectively. It can be seen from Figures 1 and 2 that the export scale effect is always the major part of positive promotion, while the technology effect is the major part of negative influence. The export structure has lesser impacts, comparing with the other two effects. The industry sectors of No.S1~No.S6, No.S22, and No.S23 export pretty small amount of oil embodied in international trade. The reason is all of these sectors are low energy consuming or have very small value of exports due to their own industrial characteristics. The scale effect of sector No.S12 Manufacture of Raw Chemical Materials and Chemical Products is the largest source for the increment of exported embodied oil, even its technology contributes a large negative effect.
| Unit: 104 tons | 2002~2007 | 2007~2012 | 2002~2012 |
|---|---|---|---|
| Changes of Embodied Oil | 6346 | -507 | 5840 |
| Technology Effect | -917 | -3024 | -2893 |
| Structure Effect | -948 | -757 | -1484 |
| Scale Effect | 8211 | 3274 | 10216 |
Table 5: Influence factors of embodied oil in China’s export during 2002~2007, 2007~2012 and 2002~2012.

Figure 1: Influence factors of the change on exported embodied oil during 2002~2007.

Figure 2: Influence factors of the change on exported embodied oil during 2007~2012.
Conclusions
The amount and the pathway of oil flow embodied in China’s export trade during 2002~2012 are calculated by using the Input Output Model, the Structure Decomposition Analysis and China’s public annual data. The results show that, the total exported embodied oil has grown from 0.58 × 10⁸ tons in 2002 to 1.11 × 10⁸ tons in 2012, which account for a large percent of China’s domestic oil consumption. Four sectors (Processing of Petroleum, Coking and Processing of Nuclear Fuel; Manufacture of Raw Chemical Materials and Chemical Products; Manufacture of Computers, Communication and Other Electronic Equipment; Transportation, Postal, Telecommunication services) are the top largest sources of exported embodied oil in 2002, 2007 and 2012, and their total contributions account for 48%, 49% and 51% respectively. The export scale effect is always the major part of positive promotion, while the technology effect is the major part of negative influence. The export structure has lesser impacts, comparing with the other two effects. The oil flow embodied in international trade and its influence factors should be considered during the development and management in the future.
Acknowledgments
The authors would like to give many thanks to the National Social Science Foundation of China (Grant No. 13 & ZD159) for sponsoring this research.
References
- The National Development and Reform Commission (2015) Ministry of Foreign Affairs, and Ministry of Commerce, Vision and Actions on Jointly Building Silk Road Economic Belt and 21st-Century Maritime Silk Road.
- The State Council of China (2015) “Made in China 2025.
- Tang X, Zhang B, Feng L, Snowden S, Hook M, et al. (2012) Net oil exports embodied in China’s international trade: An input–output analysis, J Energy 48: 464-471.
- Machado G, Schaeffer R, Worrell E (2001) Energy and carbon embodied in the international trade of Brazil: an input–output approach, Ecol and Econ Journal 39: 409-424.
- Hong L, Pei Z, Dong H, Chunyu X, Gang W, et al. (2007) Evaluating the effects of embodied energy in international trade on ecological footprint in China, Ecol and Econ Journal 62: 136-148.
- Tang X, Snowden S, Hook M (2013) Analysis of energy embodied in the international trade of UK,” Energy Policy 57: 418-428.
- Yang R, Long R, Yue T, Shi H (2014) Calculation of embodied energy in Sino-USA trade: 1997–2011,” Energy Policy 72: 110-119.
- National Bureau of Statistics of China (2016).
Relevant Topics
Recommended Journals
- Oil & Gas Research Journal
- Renewable Energy and Applications Journal
- Oceanography Journal
- Industrial Pollution Control Journal
- Coastal Zone Management Journal
- Climatology & Weather Forecasting Journal
- Geoinformatics & Geostatistics Journal
- Engineering and Technology Journal
- Petroleum & Environmental Biotechnology Journal
- Polymer Sciences Journal
Article Tools
Article Usage
- Total views: 3150
- [From(publication date):
March-2017 - Aug 18, 2025] - Breakdown by view type
- HTML page views : 2277
- PDF downloads : 873