Reservoir Simulation to Diagnose the Causes of Reduced Well Production Efficiency in Coal Bed Methane
Received: 30-Oct-2014 / Accepted Date: 31-Dec-2014 / Published Date: 10-Jan-2015 DOI: 10.4172/2157-7617.1000248
Abstract
This paper gives a detailed description of Coalbed Methane reservoirs and also few case studies have been presented highlighting the physical aspects of the reservoir. A generalized material balanced equation that accounts for and incorporates the Langmuir isotherm, initial free gas, water expansion and formation compaction. This particular form of material balancing can be used to estimate the original gas in place and unlike other methods does not require an iterative process to solve the equations. Also this report documents the practical application of the proposed material balanced equation. This report also shares case histories and best practices developed from designing and placing the cement successfully in Coalbed methane wells in India. These case histories include cement design considerations and special cement placement techniques. Reservoir models that incorporate the unique flow and storage characteristics of CBM reservoirs have been developed to study the production and decline characteristics of the reservoir. Further production facilities described include artificial lift, wellhead separation, gathering systems, compression, gas treating and water disposal. Finally we conclude the report by use of reservoir simulation to diagnose the causes of reduced well production efficiency.
Keywords: Coalbed methane reservoirs; Material balance equation; Spacer system design
6993Introduction
Coalbed Methane is in its second wave of development throughout the world. Twenty years ago it was an unconventional gas play most operators stayed away from. The development of coal gas fields has come as a result of favorable economic conditions, due to strong cooperative efforts among industry and research and development organizations in sharing technical information and experience. The presence of large amount of free gas accumulations in abandoned coalmines have motivated numerous operators to drill and produce coal gas from abandoned coalmines. Roughly 100 coalmines have been drilled in the past few decades and although not all have produced, apparently enough gas is being produced to provide energy for small scale usage.
The term “coal” refers to sedimentary rocks that contain more than 50% by weight and more than 70% by volume of organic materials consisting mainly of carbon, hydrogen, and oxygen in addition to inherent moisture. Coals generate an extensive suite of hydrocarbons and non-hydrocarbon components. Although the term “methane” is used frequently in the industry, in reality the produced gas is typically a mixture of C1, C2, traces of C3 and heavier, N2 and CO2. Methane, is of special interest because, it is usually present in high concentration, in coal, depending on composition, temperature, pressure, and other factors and of the many molecular species entrapped within coal, methane can be easily liberated by simply reducing the pressure in the bed.
Coalmine wells are located where underground mining has occurred at depth. Targeted mine void generally are 200ft to 500ft deep and range from 5-15ft in thickness, depending upon the seam thickness. The amount of gas produced from the coalmine wells is variable because gas production volumes are not reported to state, specific details are not available. Also the composition of the mine gas is variable and in addition to methane includes nitrogen, oxygen, butane, propane, ethane and carbon-di-oxide in varying amounts. The heating value varies with gas composition and is generally lower than 900 BTU. Moisture content is high causing condensation in lines. Reservoir pressure in abandoned mines is low, averaging 4-5psig and fluctuates with changes in biometric pressure.
Sensitivity studies showed that most important parameters for establishing production are permeability, initial desorption pressure and drainage area. Production of Coalbed methane is wide spread in United States of America.
Cleat system
The major difference between a conventional and a Coalbed reservoir is the cleat system. Cleats are the natural fractures in Coalbed reservoirs, providing the majority of permeability and porosity from these reservoirs (Figure 1).
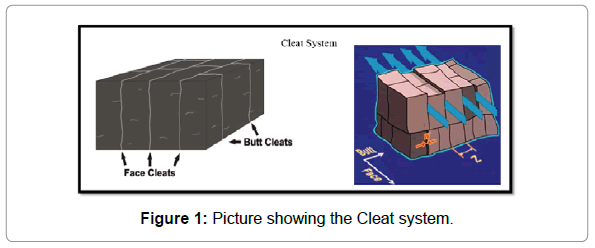
Figure 1: Picture showing the Cleat system.
Cleats are of two types: face cleats and butt cleats. Face cleats are those fractures providing openings nearly parallel to the surface tangent. Butt cleats are fracture openings perpendicular to the face. The cleat system forms a drainage mechanism for the methane gas, which is helpful while producing but challenging while drilling or cementing through these systems.
Coal has a unique and complicated reservoir characteristic. It is a heterogeneous and anisotropic porous medium which is characterized by two (dual) distinct porosity systems, micropores and macropores, these are:
Primary porosity system: The matrix primary porosity system in these reservoirs is composed of very fine pores “micropores” with extremely low permeability. These micropores contain a large internal surface area on which substantial quantities of gas may be adsorbed. With such low permeability, the primary porosity is both impermeable to gas and inaccessible to water. However, the desorbed gas can flow (transport) through the primary-porosity system by the diffusion process. These micropores are essentially responsible for most of the porosity in coal.
Secondary porosity system: The secondary porosity system (macropores) of coal seams consists of the natural-fracture network of cracks and fissures inherent in all coals. The macropores, known as cleat, act as a sink to the primary porosity system that provide the permeability for fluid flow.
The gas production in a coalbed methane reservoir
? Removal of water from the coal cleats and lowering the reservoir pressure to that of the gas desorption pressure. This process is called dewatering the reservoir.
? Desorption of gas from the coal internal surface area
? Diffusion of the desorbed gas to the coal cleat system
? Flow of the gas through fractures to the wellbore.
A Generalized Material Balance Equation For Coalbed Methane Reservoirs
A generalized Material Balance Equation (MBE) that accounts for and incorporates the Langmuir isotherm, initial free gas, water expansion, and formation compaction. This particular form of material balancing can be used to estimate the original gas-in-place and, unlike other methods, does not require an iterative process to solve the equations involved [1].
The Material-Balance Equation “MBE” is a fundamental tool for estimating the original gas-in-place “G” and predicting the recovery performance of conventional gas reservoirs. For conventional gas reservoirs, the MBE is expressed by the following linear equation:
 (1)
(1)
The material balance equation for the Coalbed methane can be expressed in the following generalized form
 (1.1)
(1.1)
For Saturated Coalbed methane reservoir
Gas originally adsorbed ‘G’
 with no water influx
 (1.2)
(1.2)
Original free gas GF
 (1.3)
(1.3)
 (1.4)
(1.4)
Gas currently adsorbed GA
It is expressed with the adsorption isotherm or mathematically by langmuir’s equation
 (1.5)
(1.5)
 (1.6)
(1.6)
Remaining free gas GR
During the dewatering phase of the reservoir, formation compaction (matrix shrinkage) and water expansion will significantly affect water production. Some of the desorbed gas remains in the coalcleat system and occupies a pore volume that will be available with water production.
 (1.7)
(1.7)
 (1.8)
(1.8)
Substituting all (1.2) to (1.7) in (1.1)
General Material balance equation for Coalbed methane reservoirs:
Neglecting compressibility we get

Case study on Material balance equation
The data was taken ANADARKO PETROLEUM CORP and shown in Tables 1 and 2 and Figure 2.
| Quantity | value | units |
|---|---|---|
| langmuir pressure constant, b | 0.00276 | 1/psi |
| langmuir volume constant, Vm | 428.5 | scf/ton |
| bulk density, ρ | 1.7 | gm/cc |
| thickness, h | 50 | ft |
| initial water saturation Swi | 0.95 | |
| drainage area, A | 320 | acres |
| initial pressure Pi | 1500 | psi |
| critical desorption pressure Pd | 1500 | psi |
| temperature T | 105 | ft |
| initial gas content Gc | 345 | scf/ton |
| formation volume factor Bw | 1 | bbl/STB |
| porosity Φ | 0.01 | |
| water compressibility Cw | 0.000003 | 1/psi |
| formation compressibility Cf | 0.000006 | 1/psi |
Table 1: Data for Material Balance Equation collected from Anadarko Petroleum Corp.
| P | V (1.18266p/1+0.00276p) | Gp | Wp | Eg | Gp+Wp*Eg | 2322.66*(345.1-V)-3.879*Eg |
|---|---|---|---|---|---|---|
| Psi | scf/ton | MMscf | MM STB | scf/bbl | MM scf | |
| 1500 | 345.1342412 | 0 | 0 | 599.21 | 0 | 0 |
| 1315 | 335.939409 | 265.086 | 0.157 | 526.87 | 347.80459 | 19312.74024 |
| 1021 | 316.2672893 | 968.41 | 0.290238 | 399.04 | 1084.226572 | 65500.23825 |
| 814.4 | 296.5622611 | 1704.033 | 0.368292 | 312.11 | 1818.980616 | 111605.5207 |
| 664.9 | 277.3602262 | 2423.4 | 0.425473 | 251.04 | 2530.210742 | 156442.2095 |
| 571.1 | 262.1720704 | 2992.901 | 0.464361 | 213.57 | 3092.074579 | 191864.4776 |
Table 2: Values showing the Material balance equation for coalbed methane reservoirs.
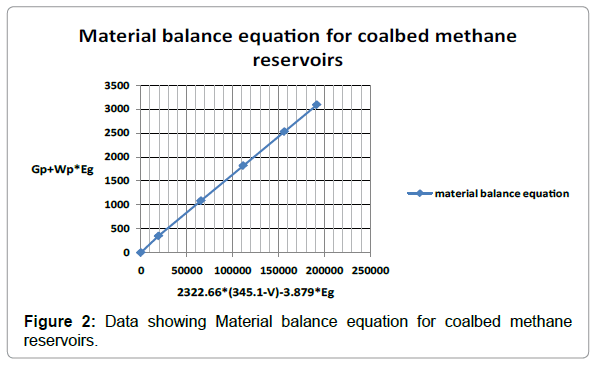
Figure 2: Data showing Material balance equation for coalbed methane reservoirs.
Best Cementing Practices Of Coalbed Methane
Cement is placed as a sheath across coal seams in Coalbed methane wells primarily for hydraulic isolation and to support the casing. Designing a cement job for coal seam wells requires contemplating factors beyond those considered in cementing conventional oil and gas wells. This topic deals with best practices developed in designing the cement in Coalbed. These case histories include cement design considerations [2].
Generally the Coalbed methane wells are drilled by air and removing the cuttings before or during the cement jobs pose challenges. After landing the casing at true depth, the cement job starts by circulating water or spacer. The primary job of this spacer is to bring the cuttings back.
Cement system design
The cement designs vary according to the fracture gradient inside the well.
i) Fracture gradient more than 0.7psi/ft
A 14.5 ppg cement system with fluid loss control material will be effective and this category cement designs are least challenging and objectives are achieved economically.
ii) Fracture gradient between 0.65 psi/ft to 0.7psi/ft
Designing suitable cement becomes challenging. If the fracture gradient is near 0.65 psi/ft, the conventional 14.5-ppg cement induces fractures and results in cement invasion in the cleat matrix with lost circulation even when lost-circulation material is used. To overcome these challenges, lightweight cement systems and mechanical aids were used. The lightweight cement systems included hollow ceramic spheres, which both reduced the density of the slurry and also helped to bridge off the entrance of the cleats due to their particle size distribution.
When the well’s fracture gradient approaches 0.68 psi/ft, 11.5-ppg cement could be used successfully, but 12.5 ppg cement invaded the cleats. However, the 11.5-ppg cement was found in most cases to have inadequate compressive strength and poor bond with the casing as shown in Figure 3. The 12.5-ppg cement had good bonding but entered the cleat faces, and unexpected pressure rise was observed, indicated fracturing was occurring by the cement system.
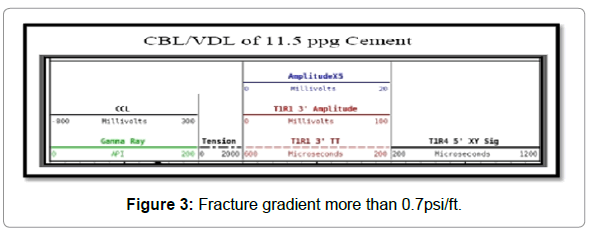
Figure 3: Fracture gradient more than 0.7psi/ft.
iii) Fracture gradient of 0.6 to 0.65 psi/ft
The third category, in which fracture gradient is between 0.60 and 0.65 psi/ft, requires a 10.5- to 11.0-ppg cement system. These systems require almost 50% (by weight of cement lightweight materials and hence impact the CBM economics substantially. These systems tend to have lesser compressive strength, and the bond between the cement and casing may not be as good as the other cases. These cement systems also do not exhibit good tensile strength, which may adversely affect hydro-fracturing operations. All the above cement systems also require good fluid loss control to minimize the cement filtrate loss into the cleat matrix, and zero free water.
Spacer System Design
As the Coalbed Methane wells are drilled using air, there is no drilling mud used, and hence the cement spacer system does not have to remove mud filter cake from the annulus or inside the casing. The disadvantage is that formation cuttings and debris created during running of the casing remain at the bottom of the well. When the spacer is pumped, these materials start to float together and tend to bridge off the annulus at any restricted area.
A simple spacer can be designed for these wells using water with or without surfactants. However, any cuttings or debris that is not lifted by the spacer may be entrained in the cement and pack off the annulus at restricted areas. Instead, a weighted spacer will lift the cuttings, and the weight of the spacer can be designed so that the cuttings are dispersed in the system during lifting, minimizing risks of bridging or packing off the flow path.
The volume of the spacer should be adequate to reach the float equipment before cement pumping begins; this will ensure that the float equipment is not plugged off by debris/cuttings. This volume could be the total of water and weighted spacer plus some extra 5 bbl to ensure that the spacer passes the float equipment before the cement is pumped.
Case history No. 1
The wells are located in the Raniganj block of West Bengal, East India, where a 15-well drilling campaign was planned. Five production casing cement jobs were pumped using a 11.5-ppg lightweight slurry design. Static temperatures ranged from 130 to 143 deg F at depths from 2297 to 3363 ft. Holes were vertically drilled with air (water & foam mixture). Since lightweight, high strength slurries were used rather than conventional cement, the CBL/VDL were expected to be good, but they did not meet expectations (Figure 3). To improve the CBL/VDL, a slurry designed at 12.5-ppg with the same lightweight additive was pumped in two wells, achieving better CBL/VDL results (Figure 4). Based on these results, the 12.5-ppg slurry was pumped in six more wells. Meanwhile, the operating company started the well completion campaign and started fracturing the wells where the 12.5- ppg cement system was pumped. Stimulation was hindered difficulty with perforating and then fracturing the wells, as the fracture initiation pressures were abnormally high. The operator concluded that the cement had invaded the cleat matrix.
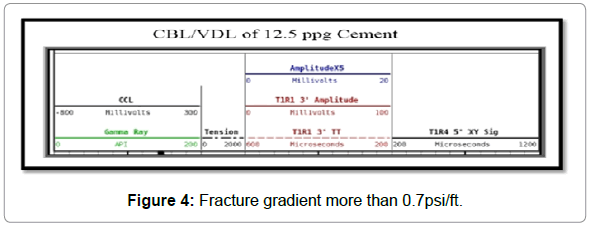
Figure 4: Fracture gradient more than 0.7psi/ft.
Case history No. 2
A four-well campaign was about to start in the Barmer Sanchor basin of Rajasthan, West India. The operating company was concerned about the cement job because of the very soft formations, which could lead to large openhole washouts. Engineers recommended pumping a special type of a pre-flush called reactive pre-flush, which could clean the washout sections better and prepare both casing and formation for better cement bonding. The reactive pre-flush consisted of sodium silicate and was pumped in the following order: 2% KCl solution –>2% CaCl2 –>2% KCl solution –>Na2SiO3 solution –>2% KCl solution. The 2% KCl solution was included to prevent contact between CaCl2 and Na2SiO2 as they can react to form solids if they mix. The pre-flush and subsequent cementing operations were executed successfully.
Coalbed methane production facilities: This describes the case study on production facilities; ARCO has recently installed to develop reserves on approximately fifty sections of land in the La Plata County, Colorado area of the San Juan Basin for producing methane gas from coal beds in the Cretaceous Fruitland formation. The project involves 107 wells and is expected to reach a peak rate of 85 MMCFD (2.4 E+06 m 3/dL The facilities described include artificial Lift, wellhead separation, gathering systems, compression, gas treating, water disposal, field automation and corrosion protection.
Completions
The typical Fruitland producing well is a straight hole 3550' (1080 m) deep. The 8-5/8" (219 mm) surface casing is set at 500' (150 m) and cemented to the surface to protect shallow water sands. The 5-1/2" (140 mm) production casing is set and cemented from TD to the surface. After the production casing is set, approximately 50' (15 m) of the coal interval is perforated and then fractured with 200,000 gallons (760 m3) of cross linked gel carrying 600,000 Ibs (272000 Kg) of sand. After stimulation and cleanup, gas lift equipment is run on 2-7/8" (73 mm) production tubing and a 3000 psi (20800 kPa) wellhead is installed.
Artificial lift
In order to maintain low bottom hole producing pressures and because of the lack of electric power in the project area and the expectation of coal fines in the produced water, only sucker rod pump systems and the gas lift systems are an ideal choice. A significant factor in this evaluation is the requirement to compress all gas to 550 psi (3900 kPa) for sales purposes. With the need for compression equipment already justified by sales, the expansion to include volumes for gas lift recycling was considerably less expensive than stand-alone gas lift compression. Another significant factor in this selection was the expected production rate.
The limited range of individual pumping units was a negative to the sucker rod system. The primary advantage of the sucker rod system was it could possibly provide a 10 to 15% better bottomhole drawdown than gas lift. Offsetting this advantage was the expectation of the pump being plugged frequently due to coal fines. Frequent workovers were anticipated to overcome this situation. The poor accessibility to well sites six months of the year made the sucker rod option considerably more expensive to operate than gas lift. Also, the difficulty in monitoring flowing bottomhole pressures is seen as a negative. Because of these factors gas lift was chosen as the means of artificial lift.
Once when the water rate declines and if fines have stabilized certain wells may be lifted with sucker rod pumps to achieve lower bottom hole pressure. Likewise, some wells may ultimately be more suited to intermittent gas lift, plunger lift or simply natural flow. In order to meet the initial design production rates, the typical well requires 200 MCFD (5700 m3/d) of 600 psi (4230 kPa) gas at the casing head to maintain less than a 250 psig (1830 kPa) bottomhole pressure. For kick off purposes, 700 psig (4930 kPa) gas is required. Two to three wireline retrievable pressure operated kickoff valves with 5/64 inch orifice (0.20 cm) are installed in side pocket mandrels to unload the well. The operating valve is an orifice type sized between 10/64 to 15/64 inch (4 to 6 mm).
Typical Well Site Equipment Of A Coalbed Methane Reservoir
Each well site is equipped with a production separator, a water handling system and a meter skid figure below illustrates the typical well site process flow diagram (Figure 5).
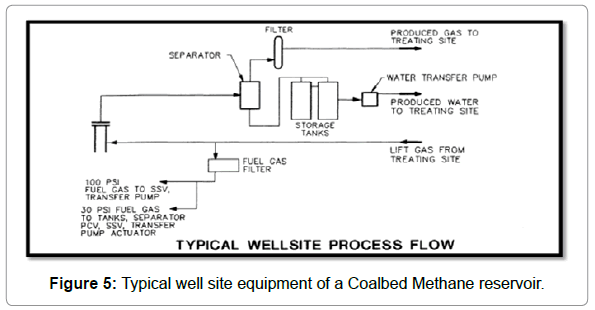
Figure 5: Typical well site equipment of a Coalbed Methane reservoir.
Curves for coalbed methane production prediction
Gas production from CBM reservoirs is governed by complex interaction of single-phase gas diffusion through micro-pore system (primary porosity) and two-phase gas and water flow through cleat system (secondary porosity) that are coupled through desorption process. In order to effectively evaluate CBM resources, it’s necessary to utilize reservoir models that incorporate the unique flow and storage characteristics of CBM reservoirs [3,4] (Figure 6).
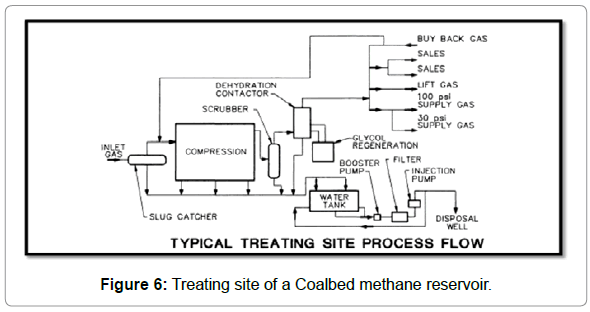
Figure 6: Treating site of a Coalbed methane reservoir.
Reservoir model description
A two-dimensional Cartesian (CBM base) model is developed for an under-saturated CBM reservoir with a well located at the center of the drainage area shale gas reservoirs. GEM includes options for gas sorption in the matrix, gas diffusion through. The reservoir simulation software used in this study was GEM4. GEM is CMGs advanced general equation of state, compositional, dual porosity reservoir simulator. Capable of modeling both coal and the matrix, two phase flow through the natural fracture system. The reservoir parameters used to develop the base model are summarized in Table 1. A set of published relative permeability5 was used in the model. The simulation runs were made by varying several of the key parameters over the ranges provided in Table 3.
| Parameters | Base Model Value | Range |
| Model | Dual Porosity | - |
| Shape Factor Formulationc | Gilman-Kazemi | - |
| Matrix-Fracture Transfer Model | Psuedo-capillary Pressure with Correction | - |
| Model Geometry | 2D-Cartesian | - |
| Grid Size | 100ft ×100ft | - |
| Reservoir Area | 40 acres | 40, 80, 160 acres |
| Thickness | 10ft | 5-15 ft |
| Matrix Porosity | 0.50% | - |
| Fracture Porosity | 2% | 1-5% |
| Matrix Water Saturation | 0.50% | - |
| Initial Fracture Water Saturation | 100% | 70-100% |
| Matrix Permeability | 0.01 md | - |
| Fracture Permeability | 10 md | 5-20 md |
| Fracture Spacing | 0.2 ft | 0.1- 1 ft |
| Initial Pressure | 600 psia | 300-600 psia |
| Temperature | 113 °F | - |
| Langmuir Pressure (PL) | 675.6 psia | |
| Langmuir Volume (VL) | 475 SCF/ton | |
| Coal Sorption Time | 50 days | 10-300 |
| Critical Desorption Pressure | 300 psia | 300-600 psia |
| Rock Density | 89.63 lb/ft3 | - |
| Skin Factor | 0 | -4 to +4 |
| Bottom Hole Pressure (Constant) | 50 psia | 50, 75, 100 psia |
Table 3: Values of parameters used in the Coalbed methane base model
Type curve development
In order to develop type curves, two set of dimensionless rate and time were defined for gas and water. The gas dimensionless terms are as follows:
 (2)
(2)
 (2.1)
(2.1)
these definitions are based on those used for gas production adjustment.
 (2.2)
(2.2)
Similarly water dimesionless rate and time were defined
 (2.3)
(2.3)
 (2.4)
(2.4)
 (2.5)
(2.5)
The base model is then converted to dimensionless rate and time using above definitions and results were plotted as shown in Figures 7 and 8.
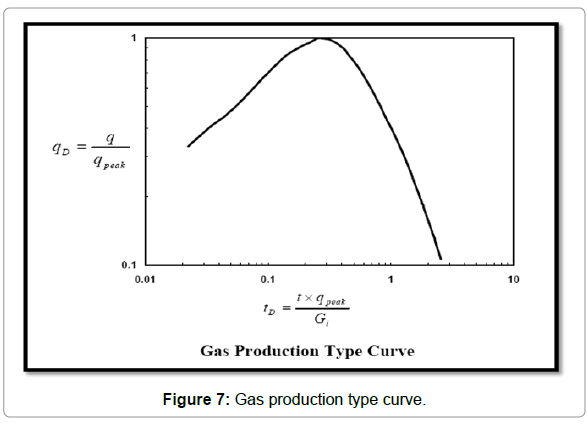
Figure 7: Gas production type curve.
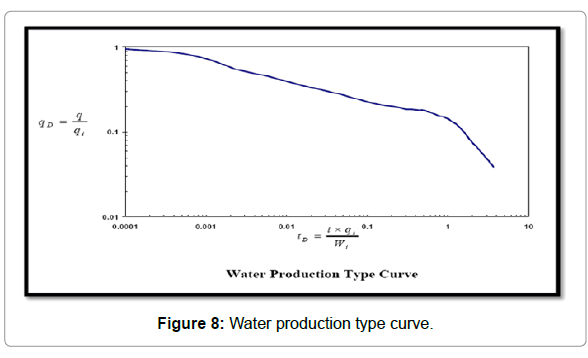
Figure 8: Water production type curve.
In order to establish the uniqueness of this curves the impact of the key reservoir parameters were investigated. Below figure illustrates the gas type curves generated for various flowing bottomhole pressures. The impact of flowing bottomhole pressure on water type curve, in the range considered from 50psia to 100psia is negligible (Figure 9).
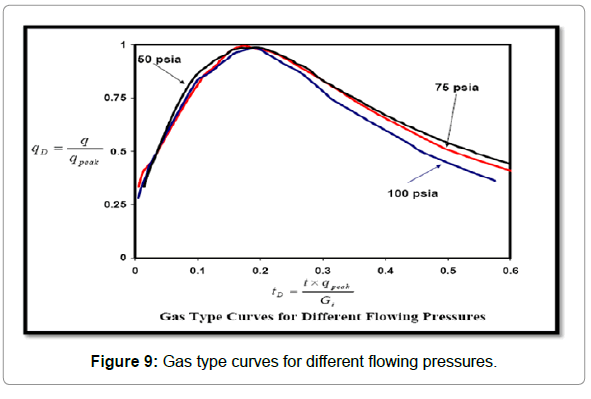
Figure 9: Gas type curves for different flowing pressures.
Relative permeability characteristic have significant impact on gas and water production from a coal reservoir because of the two phase flow condition particularly at early stages of production (Figures 10 and 11).
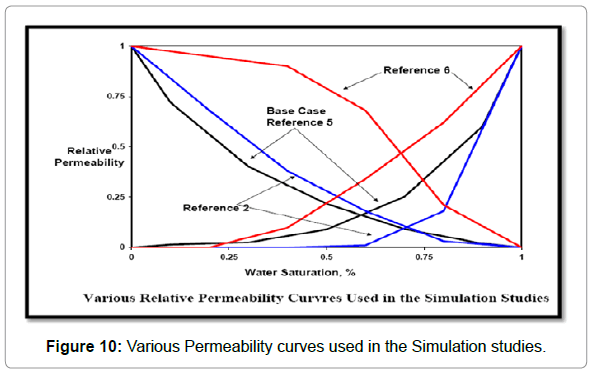
Figure 10: Various Permeability curves used in the Simulation studies.
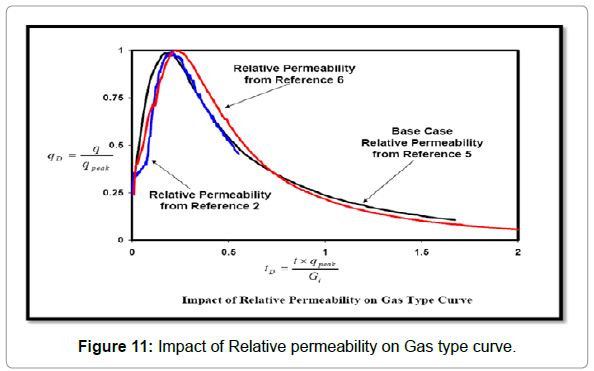
Figure 11: Impact of Relative permeability on Gas type curve.
Use of Reservoir Simulation for Diagnosing Causes of Production Problems
The diagnosis of reservoir, near-wellbore, and wellbore conditions that impair production is enhanced with the use of reservoir simulation. In the case of modeling CBM wells, a simulator used for such purpose must be able to model the physics of Coalbed methane desorption and diffusion flow through the coal matrix. It must also be able to calculate original-gas-in-place using the Langmuir isotherm. In constructing a single-well model for a well, the known data we normally have are coal thickness, coal density, produced gas composition and initial reservoir pressure, from which initial gas content values and OGIP per acre are determined. Production history data include daily gas and water rates and wellhead flowing pressures. Where we have a nearby pressure monitoring well, we also have a record of the reservoir pressure history at the monitoring well’s location. We use the model in history match mode to solve for drainage area, initial permeability, the pressuredependent permeability function (PdP), and the initial cleat porosity and water saturation. In conjunction with the simulator solution, we use the Production Data Analysis (PDA) method [5,6]. This method uses production rate, reservoir pressure and flowing pressure data to solve for the effective permeability to gas (Kg) as a function of reservoir pressure using the pseudosteady-state radial flow equation from Darcy’s Law:
 (3)
(3)
Using equation (3), we construct a plot of kg versus reservoir pressure, from which the pressure-dependent permeability function (PdP) function to be used in the simulator is determined. The PDA method assumes that reservoir pressure, drainage area, skin and thickness are known or may be independently obtained (and that the Dqg term is a constant). Because drainage area and therefore OGIP and reservoir pressure, as a function of cumulative production, are usually not known before modeling a well, the PDA analysis must be done in iteration with the reservoir simulator to arrive at a final reservoir characterization that satisfies all the data. A plot of kg versus reservoir pressure for San Juan Fairway wells, Well001 is shown in Figure 12.
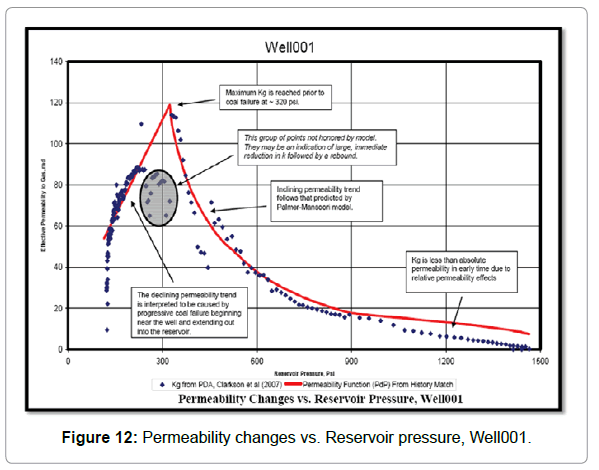
Figure 12: Permeability changes vs. Reservoir pressure, Well001.
Figure 12 shows an increasing permeability trend as a function of declining reservoir pressure from the initial reservoir pressure of 1466 psi down to 320 psi. The kg values calculated below 320 psi show an opposite, downward trend in permeability. We therefore calculated the pressure-dependent permeability (PdP) function in two parts for use in the model. The increasing segment, from initial reservoir pressure of 1466 psi down to 320 psi, was matched using the Palmer-Mansoori equation [7]. The segment below 320 psi was matched using a linear line fit to the kg data extrapolated to a value of 15 md at 0 psi reservoir pressure. The overall PdP function that we used to achieve the history match is depicted by the red line in Figure 12. Based on the history match, we estimate that the initial permeability was 7.5 md, that it peaked in 1997 at 117 md, and that it has declined from its peak to a current 54 md. Once the history match is achieved, it is possible to use the simulator to calculate the theoretical maximum reservoir flow capacity. We do this by running the model on flowing bottomhole pressure control and using a minimum flowing bottomhole pressure such as 25 psia. The curve representing the theoretical maximum flow is then plotted on the production history chart and compared to actual production. This is depicted in figure shown below in Figure 13.
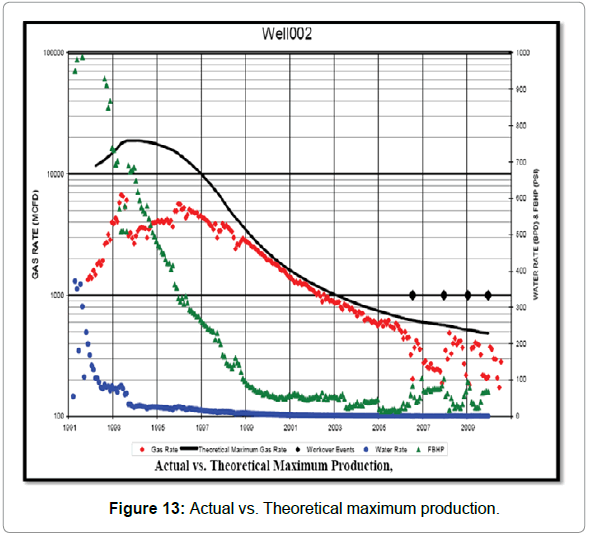
Figure 13: Actual vs. Theoretical maximum production.
We then compare actual production rates with the theoretical maximum production rate determined by the simulator and investigate causes for where they differ. In the case of Well001 prior to 1999, the well had high water rates and consequently high flowing bottom hole pressures (FBHPs), which is why it did not produce up to its maximum capacity in these early years. When the well de-watered and a low FBHP was achieved in 1999, gas production was close to the theoretical maximum for about four years. Then, beginning in 2003, gas rates started to fall below the theoretical maximum despite low FBHPs. This loss in production efficiency was caused by coal fines and paraffin plugging of the near-wellbore region, creating a progressively greater skin. The well began to experience significant production losses in 2006, when the first of four cleanout operations was conducted. These cleanouts were directed at cleaning out fill and removing paraffin from inside the liner. Following each cleanout, the well’s gas rates improved significantly but not quite up to the theoretical maximum. This is because the cleanouts were unable to significantly reduce the wellbore skin.
Conclusion
Development of gas reservoirs contained within the Coalbed requires no new technology in terms of surface facilities. Coalbed reservoirs need low flowing tubing head pressures to maximize recovery.
? The MBE can provide an independent source of validation for numerical simulators.
? The MBE method eliminates the iterative solution of king’s method
? This material balance equation is applicable to any coal which behaves according to the Langmuir isotherm equation.
? Cement designs for Coalbed methane require additional considerations compared to conventional oil and gas well cementing because of Coalbed methane economics, fracture gradient, cement invasion in cleats, cement strengths, fluid loss control and use of lost circulation material.
? Study of the Coalbed methane cleat system is critical for proper cement design.
? Reducing slurry density is useful if the fracture gradient is low, but the cement must still have good compressive and tensile strength.
? Large diameter piping vessels combined with substantial amount of compression is required to bring the gas to marketable position.
Nomenclature
Gp=cumulative gas produced, SCF
G=gas originally adsorbed, SCF
GF=original free gas, SCF
GA=gas currently adsorbed, SCF
GR=remaining free, SCF
A=drainage area, acres
ρB= bulk density of coal, gm/cm3
Gc= gas content, SCF/ton
h= average thickness, ft
Pd=Desorption pressure
Swi= Initial water saturation
Φ=Porosity
Egi= Gas expansion factor at Pi, SCF/BBl
V=Volume of the gas currently adsorbed at P, SCF/ton
Vm=Langmuir isotherm constant, SCF/TON
b=Langmuir pressure constant, psi-1
p= Pressure, psi
Pi=Initial pressure, psi
Wp=Cumulative water produced, STB
Bw= Water formation volume factor bbl/STB
Cw= Isothermal compressibility of the water, psi-1
Cf=Isothermal compressibility of the water, psi-1
D=inertial or turbulent flow factor, D/Mscf
h=formation thickness, ft
kg=effective permeability to gas, md
m(p)=pseudopressure, psi2/cp
pR=volumteric average reservoir pressure, psia
pwf=flowing bottomhole pressure, psia
qg=gas surface flow rate, Mscf/D
re=drainage radius, ft
rw=wellbore radius, ft
s=skin factor, dimensionless
T=temperature, oR
(qpeak)g=maximum peak rate
Gi=initial gas in place
Gc= gas content of the coal SCF/ton
ρc=coal bulk density
qiw= initial maximum water rate
Wi=initial water in the cleat system
ØF=cleat system porosity
References
- Ahmed T, Centilmen A, Roux B (2006) A Generalized Material Balance Equation for Coalbed Methane ReservoirsSPE Annual Technical Conference, San Antonio, Texas USA.
- Mohammad HSG, Shaikh S(2010) Coalbed Methane Cementing Best Practices-Indian Case History, CPS/SPE International Oil & Gas Conference, Beijing, China.
- Okotie VU, Moore RL(2010) Well Production Challenges and Solutions in a Mature, Very Low Pressure Coalbed Methane Reservoir,Canadian & International Petroleum Conference, Calgary, Alberta Canada.
- Aminian K, Ameri S, Bhavsar A, Sanchez M, Garcia A (2004) Type Curves for Coalbed Methane Production Prediction, SPE Eastern Regional Meeting, Charleston, West Virginia.
- D W Moore (1990)Coalbed methane production facilities a Case history, SPE 65th Annual Technical Conference & Exhibition, New Orleans, LA.
- Ahmed T, Meehan N (2011) Advanced Reservoir Management and Engineering. [2ndEdn] Gulf professional Publishing, USA.
- Palmer I, Mansoori J (1998) How Permeability Depends on Stress and Pore Pressure in Coalbeds: A New Model paper SPE 52607, SPEREE 539-544.
Citation: Ismail Iqbal Md, Gupta DK (2015) Reservoir Simulation to Diagnose the Causes of Reduced Well Production Efficiency in Coal Bed Methane. J Earth Sci Clim Change 6: 248. DOI: 10.4172/2157-7617.1000248
Copyright: © 2015 Ismail Iqbal Md, et al. This is an open-access article distributed under the terms of the Creative Commons Attribution License, which permits unrestricted use, distribution, and reproduction in any medium, provided the original author and source are credited.
Select your language of interest to view the total content in your interested language
Share This Article
Recommended Journals
Open Access Journals
Article Tools
Article Usage
- Total views: 22572
- [From(publication date): 1-2015 - Aug 17, 2025]
- Breakdown by view type
- HTML page views: 17846
- PDF downloads: 4726