Response of Improved Lentil (Lens Culinaris Medik) Varieties to Phosphorus Nutrition on Vertisols of West Showa, Central Highlands of Ethiopia
Received: 04-Oct-2017 / Accepted Date: 24-Oct-2017 / Published Date: 27-Oct-2017 DOI: 10.4172/2329-8863.1000315
Abstract
Identification of appropriate varieties and rates of phosphorus fertilizer for different sites are important agronomic practices to increase the productivity of lentil. A field experiment was conducted during the 2016 main cropping season to evaluate the performance of lentil varieties and their response to phosphorus application on vertisols of Ambo. Four Lentil varieties (Gudo, Alemtena, Teshale and EL-142) with four rates of phosphorus (0, 10, 20 and 30 kg/ha) were combined factorialy in randomized complete block design with three replications. Varieties were significantly varied in days to 50% flowering and 95% maturity, number of nodules, plant height and biological yields. Application of phosphorus rate was significantly affected days to emergency, days to 50% flowering, days to maturity, number of nodule per plant, nodule dry weight, nodule volume, number of primary and secondary branches, number of pods per plant, number of seeds per pod, thousand-seed weight, plant height, grain yield, biological yields and harvest index of lentil varieties. Significant interaction effects of varieties and Phosphorus rate was observed with respect to 50% flowering, biological yields, number of nodules per plant and plant height of lentil varieties. All varieties showed better performance on various growth and phenological characters in response to phosphorus application. Application of 20 kg P ha-1 was gave better yield and yield components of lentil. The highest net benefit of 72240 EB ha-1 with marginal rate of return of 1177% was obtained from application of 20 kg P ha-1, which was followed by 62706 and 55188 EB ha-1, and marginal rate of return 1445 and 243 % with application of 10 and 30 kg P ha-1, respectively. Therefore, application of 20 kg P ha-1 is recommended to sustain lentil production in vertisols of Ambo areas in central highlands of Ethiopia.
Keywords: Variety; Phosphorus rates; Agronomic efficiency; Seed yield
Introduction
Lentil (Lens culinaris Medik) is one of the most ancient annual food crops that have been grown as an important food source for over 8,000 years [1]. Lentil is an important pulse crop grown widely throughout the Indian Subcontinent, Middle East, Northern Africa, Southern Europe, North and South America, Australia and West Asia [2]. Ethiopia is amongst the centers of diversity for lentil [3].
Ethiopia is one of the major lentils producing country in the world and the first in Africa [4]. According to [5] in Ethiopia, 1,652,844.19 hectares of land are allocated for pulse crops production with total production 27,692,743.11quintals; out of which 100,692.74 hectares is cultivated with lentil, which accounts for 1,339,336.41quintals of yield. In West Showa Zone, lentil accounts from 54,636.28 hectare of land for total pulse cultivation, 1,842.99 hectare area cultivated for lentil producing 27,204.57 quintals [5] with average seed yield of 14.76 quintal ha-1.
Lentil is grown for human consumption it`s seed contains 1-2% fat, 24-32% proteins and minerals and vitamins [6] and therefore, may correct important amino acid deficiencies of cereals when used in mixture with cereal crops. Abraham [7] reported that the crop is important export and cash crop that has highest price in domestic market compared to all other food legumes and cereals. Moreover, Lentil can fix atmospheric nitrogen through root nodules in association with Rhizobium bacteria. This improves the physical, chemical and biological properties of soil and may in addition reduce the pressure of nitrogenous fertilizer application to the crop [8].
Despite its importance, production of lentil in Ethiopia is characterized by a low mean yield of 1.39 t·ha-1 [9]. This low seed yield has been attributed to inadequate agronomic management practices, use of local variety, planting on marginal lands without any fertilizer application and lack of indigenous rhizobial symbionts of lentil in the soil as a result of continuous cereal mono-cropping system [10]. The susceptibility of the landraces to diseases, the inherently low yield potential of landraces and poor agronomic practices [11].
Phosphorus (P) is major nutrient elements for grain legumes. Phosphorus has very positive effects on nodule formation and nitrogen fixation in legume crops [12]. Phosphorus is a constituent of nucleic acids, phospholipids and ATP [13]. Even though addition of P fertilizer increases grain yield in many crops such as common bean [14] and soybean [15], Faba bean [16], chickpea [17], cowpea [18]. The application of excess P fertilizer has been associated with environmental pollution [19].
Despite the presence of a large P pool, Africa is suffering from shortage of available P, which remains a yield limiting factor [20]. Available P is often a limiting element in crop production in central Ethiopian highlands [21] with 70 to 75% of the agricultural soils deficient in phosphorus [22]. According to Kumar [23] reported the increment in number of branches per plant might be role of P in cell division activity, leading to the increase of plant height and number of branches and consequently increased the plant dry weight. Application of small amounts of P fertilizer dramatically increased nodulation, N accumulation and seed yields of haricot bean and common bean [24].
According to Sarker [25] lentil yields at the farm level are far below the genetic potential of its cultivars. Unavailability of the tested sitespecific lentil cultivars and imbalanced use of fertilizers could be the contributing factors towards these lower yields. Most of the soils under lentil cultivation are low-to-medium in available phosphorus, therefore they respond positively to P-fertilizer application [26]. Further, improvement in the genotypes would be helpful to get the highest response from lower-P soils. The differences in genotypes to grow in P limited soils have been reported in several crops such as common bean [27], haricot bean [21] and faba bean [16] which may be due to differences in changing rhizosphere pH, release of organic compounds, root surface area [28], production and secretion of phosphatase enzymes by the roots [29] and use of acquired P in dry matter production [30].
Phosphorus contributes substantially to increased yield of legumes by enhancing the physiological functions of the crop plants, root development, and nodulation [31]. Phosphorus application not only increases the dry matter and seed yield of lentil but also enhances the N and P content of the seed by increasing nodulation and root development [32]. However, no studies have been conducted on response of improved lentil varieties to phosphorus fertilizer application in the Ambo area. In general, blanket recommendations, regardless of considering the physical and chemical properties of the soil would not lead to increase the crop productivity in the country. Hence, the yield potentials of newly developed lentil varieties with different phosphorus rates is needed in order to explore the varietals potential in maximizing lentil yield in the area and to identify better yielding lentil varieties for the area. This apart, there is scanty information on the optimum phosphorus level for lentil production in the area. Therefore, the objective is to evaluate the performance of lentil varieties to phosphorus rates in terms of growth parameters, yield and its components and nodulation under rain-fed vertisol conditions of Ethiopia.
Materials and Methods
Description of experimental site
The experiment was conducted in 2016 cropping season at Ambo University main campus research farm which located at a latitude 9°11'0" North and longitude 38°20'0" East with an altitude of 1980 m.a.s.l. The mean annual rainfall was 942 mm with unimodal distribution. The mean annual minimum and maximum temperatures were 8.25 and 23.4°C, respectively.
Experimental treatments and procedures
The field experiment comprised three improved lentil varieties [Teshale (FLIP 96-46L), Alemtena (FLIP 96-49L), Gudo (Flip 84-78L) and one local variety (EL-142)] and four levels of phosphorus rates (0, 10, 20 and 30 kg P ha-1) were used. The design of the experiment was randomized complete block design in 4 × 4 factorial arrangements with three replications. Four lentil varieties were used as Factor A and four phosphorus rates as Factor B.
Soil sampling and analysis
Pre-planting and post-harvest soil samples (0-20 cm depth) were collected from five spots diagonally and composited. Composited soil sample was prepared following standard procedures and analyzed for soil pH, organic matter, total nitrogen, available phosphorus and cation exchange capacity (CEC). After harvest, soil samples were also collected from each plot and composited treatment wise for the determination of phosphorus. Particle size distribution determination was following [33] procedure.
Soil pH was determined at 1:2.5 soils to water ratio using a glass electrode attached to a digital pH meter. Based on the oxidation of organic carbon with acid potassium dichromate, organic matter was determined using wet digestion method and total nitrogen using Kjeldhal method as described by Olsen [34]. Besides, available phosphorus was determined according to Olsen method [35]. CEC was determined by measuring the total amount of cation needed to replace all the cation from the soil exchange site and expressed in Cent mole per 100-gram soil (Cmol/100 g soil) [36].
Experimental procedures
Cleaned seeds of lentil varieties were used for planting. The field was prepared with conventional methods using oxen plough. Planting of lentil varieties were done in last week of July 2016 cropping season. The phosphorus fertilizer rate was calculated and applied per plots. The recommended nitrogen fertilizer rate (18 kg N ha-1) as starter was applied once at planting for the area. The source of nitrogen and phosphorus was urea and TSP. The recommended seed rate 100 kg ha-1 was used.
Improved agronomic management practices were applied to lentil varieties as per research recommendations. The plot size was 2.1 m × 3 m=6.3 m2 accommodating seven rows of plants spaced at 30 cm between rows and 10 cm between plants. Lentil varieties were harvested at maturity. The harvested plants were sun dried for 7-10 days and then hand shelled. All necessary agronomic practices as required by the crop were carried out as per the research recommendation for lentil production.
Plant tissue and seed collection and analysis
After maturity of lentil, net plot was harvested at ground level and air dried and partitioned in to straw and grain. The straw and grain samples were analyzed for P concentrations from which P uptake in straw and grain were calculated by multiplying P content with respective straw and grain yield/ha. Total P uptake, by whole biomass was obtained by summing up the P uptakes by grains and straw
Total P analysis of grain and straw at maturity were carried out on the plant sampled for grain and biological yield determination at harvest [37]. Plant samples were composited treatment-wise from three replications. Phosphorus contents in lentil grain and straw were determined by taking 1.0 g of dried ground sample in a digestion tube. Concentrated HNO3 (10 mL) was added to the tube followed by the addition of 5 mL of concentrated HClO4 (70%). The ingredients were digested in a digester until the colors cleared up. The digested material was diluted to 25 mL volume using distilled-deionized water [38]. For P estimation, 1.0 ml of digested material was taken into a 10 mL tube. Aqueous 2M HNO3 solution (2 mL) was added and the mixture was diluted to 8 mL with distilled water. Thereafter, 1 ml of ammonium molybdate-ammonium vanadate solution was added and the volume was made to 10 mL with distilled water. The tube was shaken and allowed to stand for 30 minutes. The absorbance was measured by colorimeter at 430 nm and was compared with the absorbance of standard phosphorus curve. Phosphorus content in the plant tissue was determined colorimetricaly by vanado-molybdate method [36].
Plant P uptake and use efficiencies
Nutrient use efficiency (NUE) is a measure of how well plants use the available mineral nutrients. It can be defined as yield (biomass) per unit input (fertilizer, nutrient content). Improvement of NUE is an essential pre-requisite for expansion of crop production into marginal lands with low nutrient availability but also a way to reduce use of inorganic fertilizer. Usually P use efficiency of various crops is known to be low and recovery in the year of application varying between 15-25% [39] because of high fixation capacity of the soil. The various reactions of applied P in the soil resulting in formation of compounds that become less available to plants are considered as one of the factors attributing to low P recovery [40]. Because of the substantial residual effect of P fertilization on the P nutrition of future crops, first year recovery of P by the crop will usually greatly underestimate P use efficiency [41]. Total P uptake, by above ground biomass was calculated by summing up the P uptake by grains and straw.
Apparent fertilizer P recovery was calculated as described by [42]:

Where, AFR=apparent fertilizer recovery; Un=nutrient uptake at "n" rate of fertilizer and Uo=nutrient uptake by control (no fertilizer nutrient).
Agronomic and physiological P use efficiencies were calculated by using procedures described by [43] as:

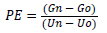
Where, AE=agronomic efficiency; PE=physiological efficiency; Gn and Go stand for grain yield of the plots fertilized at "n" rates of fertilizer and grain yield of unfertilized, respectively. Un and Uo stand for nutrient uptake at "n" rate of fertilizer and uptake at control, respectively.
P uptake of seed=P concentration of seed/ 100*seed yield (kg/ha)
P uptake of straw=P concentration of straw/ 100*straw yield (kg/ha)
TPU=P uptake of grain+P uptake of straw, where TPU, total phosphorus uptake
Data collected
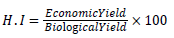
All important growth and yield parameters were collected following the standard procedure for the crop such as days to 50% emergency, days to 50% flowering, number of nodules/plant, volume of the nodules, Nodule dry weight (gm/plot), days to 95% maturity, plant height (cm), primary branches per plant, secondary branches per, plant, pods per plant, seed per pod, thousand seed weight, grain yield, dry biomass yields and harvest index; which was determined by the following formula and expressed in percentage (%):
Statistical analysis
The collected data were subjected to the analysis of variance (ANOVA) using statistical computer software SAS 9.0 [44]. Mean separation was done using least significance difference (LSD) procedure at 5 % probability level
Economic analysis
For partial budget and marginal rate of return analysis, lentil grain yield was valued at an average open market price of EB 35 kg-1 and Triple superphosphate (TSP) fertilizer cost was EB 21 kg-1. Seed yield was down adjusted at 10 % [45].
Results And Discussion
Physical and chemical properties of soil in the experimental site
The particle size distribution of the soil is clay with (3% sand, 10% silt and 87% clay). The soil pH was 7.4-7.8 which is slightly alkaline [46]. Lentil has been found to do well at pH values of 7.61 however; lentils grow best at a soil pH of 6.0 to 8.0 so that the soil pH is ideal for lentil production. The soil organic carbon content was 1.53%. Similarly, total nitrogen of 0.04%, CEC of 26.67 cmol (+) kg-1and total available phosphorus of 45.31 ppm (Table 1). The soil of the experimental site has high organic carbon content, very low total N, medium CEC and high in available P [46] and [47] (Table 1).
| pH (H2O) (1:2.5) | OC (%) | TN (%) | CEC(cmol(+)/kg) | TAP (ppm) | Texture |
|---|---|---|---|---|---|
| 7.61 | 1.53 | 0.04 | 26.67 | 45.31 | |
| Slightly alkaline | High | Very low | Medium | High | Clay |
OM=Organic Matter; TN=Total Nitrogen; TAP=Total Available Phosphorus; CEC=Cation Exchange Capacity.
Table 1: Pre-planting soil physicochemical analysis result of the study area.
Phenological and nodule parameters of lentil
The mean days to 50% emergence is indicated in Table 2. The main effect of Phosphorus application rates was significant (P<0.05) affected days to emergence of lentil, while the main effect of varieties and their interaction were not significant (Table 2). The days to 50 % emergence were 5 for all lentil varieties. In contrary, Number of days to emergence was significantly affected by different in common bean varieties [48] and also among chick pea varieties [49]. The number of days to 50% emergence varied from 4.42 to 5.0 among applied phosphorus rates. Similarly, result was reported by [50]. The probable reason might be that applied phosphorus supply played an essential role in plant emergence.
| Varieties | Days to emergency | Days to maturity | Nodule volume(ml) | Nodule dry weight (g) | Number of primary branches | Number of secondary branches |
|---|---|---|---|---|---|---|
| Gudo | 4.83 | 121a | 0.195 | 0.079 | 8 | 11 |
| Alemtena | 4.67 | 120a | 0.216 | 0.093 | 9 | 11 |
| Teshale | 4.5 | 116b | 0.225 | 0.087 | 9 | 12 |
| EL-142 | 4.58 | 114b | 0.226 | 0.088 | 9 | 13 |
| LSD (0.05) | Ns | 4.08 | Ns | Ns | Ns | Ns |
| Phosphorus rates (P kg ha-1) | ||||||
| 0 | 5.00a | 135a | 0.104c | 0.048b | 7c | 8c |
| 10 | 4.67a | 118b | 0.187b | 0.09a | 8cb | 11b |
| 20 | 4.50b | 114b | 0.269a | 0.103a | 9b | 13a |
| 30 | 4.42b | 104c | 0.304a | 0.105a | 11a | 14a |
| LSD (0.05) | 0.34 | 4.08 | 0.046 | 0.022 | 1.25 | 1.52 |
| CV (%) | 8.78 | 4.18 | 25.75 | 30.6 | 17.06 | 15.72 |
Ns=Non-significant difference at 5% probability level; LSD: Least Significant Difference; CV: Coefficient of Variation. Means within the same column followed by the same letter are not significantly different at 5 % probability level, Ns=non-significant difference at 5% probability level.
Table 2: The main effect of varieties and phosphorus rates on days to emergency, days to maturity, nodule volume and dry weight and growth parameters of lentil.
The physiological maturity of lentil was highly significant (P<0.01) due to by the main effect of lentil varieties and phosphorus rates, while their interaction effect was not significant (Table 2). Variety Gudo (121) and Alemtena (120) matured late as compared to other varieties (Table 2). This might be due to the inherent genetic difference among the varieties of lentil and variability in phenological characteristics. Similarly, [51] reported that high variability was observed among genotypes tested for days to flowering, maturity and grain filling period.
The shortest days (104) to physiological maturity was obtained with application of 30 kg ha-1 and the longest days (135) obtained from control plots. The probable reason might be that phosphorus hastens maturity of plant. Similarly, Brady [52] reported that phosphorus application could possibly shorten maturity since it promotes rapid cell division. Likewise, Onasanya [53] reported that phosphorus plays an important role in many physiological processes that occur within a developing and maturing plant, it is involve in enzymatic reactions in the plant and it is also hastens the ripening of fruits thus counteracting the effect of excess nitrogen application to the soil.
The days to 50% flowering of lentil was highly significant (P<0.01) due to the main effect of varieties of lentil, phosphorus rates, and their interaction effect (Table 2). The longest numbers of days to 50% flowering (68) were recorded at control for all varieties and the shortest number of days to flowering (51) were recorded at 20 kg P ha-1 for all variety (Table 2). Application of P rates were varied the number of days to flowering between 51 and 68 on lentil varieties.
Nodule volume and nodule dry weight
The nodule volume and nodule dry weight was highly significantly (P<0.01) the main effect of phosphorus rates while the main effect of varieties and their interaction effect were not significant (Table 2).
Significantly higher nodule volume (0.304 ml) was recorded with application of 30 kg P ha-1 followed by 20 kg P ha-1 (0.269 ml) while the lowest nodule volume (0.104 ml) was recorded from control. Increasing P levels from 0 to 30 kg P ha-1 significantly increased nodule volume by about 192 % and showed consistent increment. When the rate of phosphorus was increased from 0 to 10 kg P ha-1, the nodule volume was increased by 63%, 44 % with increased phosphorus from 10 to 20 kg P ha-1 and 13 % from 20 to 30 kg P ha-1, which indicates beyond the optimum phosphorus rate decreasing of nodule volume (Table 2).
The result was consistent with the findings [54] nodule volume can be increased by treating phosphorous deficient soils with fertilizer phosphorous.
Significantly higher mean nodule dry weights (0.105 g) was recorded from the application of 30 kg P ha-1 and the lowest nodule dry weights (0.048) was from the control treatment (Table 2). Nodule dry weight was increased by 115% and 119% due to application of 20 and 30 kg P ha-1 as compared to the control treatments, respectively. Consistent increment of nodule dry weights was recorded as P rate increased from 0 to 30 kg P ha-1, the possible reason for higher nodule dry weights at the highest phosphorus rate could be due to increased root nodule production which resulted on more nodule dry weights. Similarly, Nkaa [55] who reported that phosphorus fertilizer application significantly enhanced nodule dry weight of cowpea.
Growth parameters
The numbers of primary and secondary branches per plant was significant (P<0.01) due to the main effect of phosphorus rates while the main effects of varieties and the interaction effect were nonsignificant (Table 2). Similarly, Zahan [56] indicated that lentil varieties did not show significant difference for number of branches. In contrary, Sarker [57] reported that high variability in the number of branches in lentil cultivars.
Significantly lower (7) and higher (11) number of primary branches per plant were recorded in control and application of 20 kg P ha-1(Table 2). The mean number of primary branches per plant was increased by 14%, 22% and 44% for 10, 20 and 30 kg P ha-1, respectively as compared control (Table 2). This may probably be due to the effect of phosphorus on the processes of cell division and balanced nutrition. Similarly, Haque [58] reported that the number of primary and secondary branches per plant was increased with increasing the level of nutrient.
Number of secondary branches per plant was significantly increased with the increase in applied phosphorus rates from control to 30 kg P ha-1 (Table 2). The highest number of secondary branches per plant (14) was recorded with application of 30 kg P ha-1 and the lowest number of secondary branches per plant (8) was recorded from the control. The mean secondary branches were increased by 42%, 62% and 79% under 10, 20 and 30 kg P ha-1, respectively as compared to control (Table 2). This may probably be due to the effect of phosphorus on the processes of cell division and balanced nutrition. Similarly, Guriqbal et al. [58] reported that secondary branches per plants were increasing with increasing the level of nutrient. In contrary, Azmera [21] reported the number of branches per plant decreased with increasing phosphorus doses. The highest number of branches per plant was recorded from control.
Generally, the trend was uniform for all the varieties. This probable due to applied phosphorus played an essential role in hastening plant growth and development. Similarly, Tesfahun Woldesellasie [59] who reported that fertilized lentil plants flowered five days earlier than those that were not fertilized. Likewise, phosphorus application could possibly shorten flowering days since it promotes rapid cell division reported by Tessema Tesfaye and Alemayehu Balcha [60].
Nodule number
The number nodule plant-1 of lentil was indicated in Table 3A. The main effect of varieties, phosphorus rates and their interaction were significantly (P<0.05) affected number of nodule per plant (Table 3A). The highest number of nodules per plant (48) was recorded with application of 20 kg P ha-1 on Gudo variety and least number of nodules per plant (19) was also on Gudo variety with no phosphorus application (Table 3B). The numbers of nodule per plant increased as phosphorus rate increases for all varieties. This might be due to application of phosphorus rate to plants enhanced the availability of essential elements for plant nutrition.
| Phosphorus rate (PR) kg ha-1 | Varieties (V) | ||||
|---|---|---|---|---|---|
| Gudo | Alemtena | Teshale | EL-142 | Mean | |
| 0 | 68a | 68a | 68a | 68a | 68 |
| 10 | 53c | 54c | 53c | 62b | 56 |
| 20 | 51c | 51c | 51c | 51c | 51 |
| 30 | 62b | 62b | 62b | 68a | 64 |
| Mean | 59 | 59 | 59 | 62 | |
LSD (0.05); V*PR=4.23; Variety=0.668; Phosphorus rate=0.668; CV (%)=4.39; LSD: Least Significant Difference; CV: Coefficient of Variation. Means within the same column followed by the same letter are not significantly different at 5% probability level.
Table 3A: Interaction effect of varieties and phosphorus rates and on days to 50% flowering of lentil at Ambo 2016.
| Phosphorus Rate (PR) (kg ha-1) | Varieties (V) | ||||
|---|---|---|---|---|---|
| Gudo | Alemtena | Teshale | EL-142 | Mean | |
| 0 | 19h | 21gh | 23ghef | 24ghefd | 22 |
| 10 | 22ghf | 25ghefd | 27 gcefd | 29cefd | 26 |
| 20 | 48a | 29cebd | 32cb | 36b | 36 |
| 30 | 29cebd | 24ghef | 31cbd | 25ghefd | 27 |
| Mean | 30 | 25 | 28 | 28 | |
LSD (0.05) PR XV=6.68; Variety=18.06; Phosphorus rate=3.56; CV (%) 14.45; LSD: Least Significant Difference; CV: Coefficient of Variation. Means within the same column followed by the same letter are not significantly different at 5% probability level.
Table 3B: Interaction effect of phosphorus rates and varieties on number of nodules per plant of lentil at Ambo in 2016.
The application of phosphorus rates beyond 20 kg P ha-1 resulted in decreased number of nodule per plant for all the varieties. Similarly, Taylor [61] reported increased number of nodules per plant due to phosphorus application. During nodulation, P is an essential ingredient for Rhizobium bacteria to convert atmospheric N2 into an ammonium (NH4+) form usable by plants. Inadequate phosphorus restricts root growth, the process of photosynthesis, translocation of sugars and other such functions which directly influence N fixation by legume plants. Similarly, phosphorus fertilizer application was reported to significantly enhanced nodule number in cowpea [55]. Rahman [62] also reported that varieties significantly affect the growth, development and yield of lentil.
Plant height
The plant height of lentil was significantly (P<0.01) affected by the interaction effects of varieties and phosphorus rates (Table 4). Significantly taller plant height (49 cm) was obtained on Teshale variety with the application of 20 kg P ha-1, while the shorter plant (35) was recorded on variety Gudo without Phosphorus application (Table 4). Plant height was increased as rate of P applied increased from the control consistently up to the maximum rate. The application of 20 kg P ha-1 gave significantly taller plants to other P rates for all the varieties (Table 4). Increased in plant height with the increase in rate of P might be due to phosphorus fertilizer contribution to availability of soil nutrients which increases their uptake by plants. Likewise, Tekle [16] described that phosphorus application that facilitated better absorption of soil moisture and nutrients resulting in taller plant height of faba bean in comparison with no phosphorus application.
| Phosphorus rate (PR) kg ha-1 | Varieties(V) | ||||
|---|---|---|---|---|---|
| Gudo | Alemtena | Teshale | EL-142 | Mean | |
| 0 | 35g | 41edc | 37efg | 36efg | 37 |
| 10 | 38efg | 45bac | 43bcd | 39efdg | 42 |
| 20 | 41efdc | 47ba | 49a | 48ba | 46 |
| 30 | 36fg | 38efg | 45bac | 45bac | 41 |
| Mean | 37 | 48 | 44 | 42 | |
LSD (0.05) PRs × V=4.88; Variety=2.40; Phosphorus rate=2.40; CV (%) 7.06; LSD: Least Significant Difference; CV: Coefficient of Variation; Means within the same column followed by the same letter are not significantly different at 5% probability level.
Table 4: Interaction effect of phosphorus rates and varieties on plant height of Lentil at Ambo in 2016.
Increase in plant height of lentil varieties as increases phosphorus rates. Similarly, [63] reported that plant height was linearly increased with increasing level of fertilizer. Ullah [17] reported that difference in plant height could be due to variation in genetic make-up or the hormonal balance and cell division rate that result in changes in the plant height of the different varieties.
Yield and yield components
The number of pods per plant and number of seeds per pod were non-significantly (P<0.01) affected by the main effect of varieties of lentil, while the number of pods per plant and seeds per pod was affected by the main effect of phosphorus rates (Table 5). Teshale variety recorded the maximum (124) pods per plant and the minimum (102) pod per plant was obtained from Gudo Variety. Teshale, Alemtena and EL 142 Varieties were not statistically different from each other. Genotypic variation played significant role in producing pods per plant. Similarly Mohammadjanloo [64] and Rahman [65] reported that variation for number of pods per plant among various lentil varieties.
| Treatments | Number pods per plant | Number of seeds per pod | Seed yield (kg ha-1) | Thousand seed weights(g) | Harvest index (%) |
|---|---|---|---|---|---|
| Varieties | |||||
| Gudo | 102 | 1 | 1925 | 29b | 45ba |
| Alemtena | 112 | 1.5 | 2024 | 31ba | 47a |
| Teshale | 124 | 1.42 | 1907 | 32a | 46ba |
| EL-142 | 110 | 1.42 | 1908 | 30ba | 42b |
| LSD (0.05) | Ns | Ns | Ns | 2.44 | 4.44 |
| Phosphorus Rates (kg ha-1) | |||||
| 0 | 66d | 1c | 1509c | 29c | 42b |
| 10 | 101c | 1c | 2044ba | 34b | 45b |
| 20 | 130b | 2a | 2360a | 37a | 42b |
| 30 | 150a | 2a | 1852b | 24d | 51a |
| LSD (0.05) | 18.06 | 0.317 | 336 | 2.44 | 4.44 |
| CV (%) | 19.44 | 26.56 | 20.81 | 9.54 | 11.77 |
Ns=Non-significant difference; CV: Coefficient of Variation. Means within the same column followed by the same letter are not significantly different at 5% probability level.
Table 5: The effect of lentil varieties and phosphorous rates on number of pod per plant, seed per pod, grain yield, thousand seed weights and harvest index of lentil at Ambo in 2016. Means within the same column followed by the same letter are not significantly different at 5% probability level, NS=non-significant difference.
The number of pods per plant was significantly (P<0.05) affected by application different rates of phosphorus. Significantly lower number of pods 66 was found from control. Significantly higher number of pods per plant (150) was recorded with the application of 30 kg P ha-1. When compared to the control, the mean number of pods per plant was increased by 129% (Table 5). The trend indicated consistent increment in number of pods per plant with increment of phosphorus fertilizer application rates from control to 30 kg P ha-1. This could be attributed to the role of P fertilizer in ensuring availability of other plant nutrients which stimulated the plants to produce more pods per plant as phosphorus encourages flowering and fruiting. Likewise, Ullah [17]; Chiezey reported that increasing the rate of phosphorus increased the number of pods per plant and number of seed per pod. It appears that the availability of nutrient by increasing the level of phosphorus increased the number of seeds. Higher doses of chemical fertilizer were effective on mature pods plant-1 and number of seed pod-1 [66].
The number of seeds per pod was non-significantly different among the three varieties (Table 5). The highest (1.5) number of seed per pod was recorded with Alemtena. This might be due to the genetic makeup of the varieties. In contrary, Sharar [67] who had reported significant genotypic variation in the varieties of lentil for production of seeds per pod and number of pod per plant. Number of seed per pod was significantly affected by different rate of P applications.
Significantly higher (2) number of seeds per pod was recorded from application of 30 kg P ha-1. Similarly, Shubhashree [68] reported application nutrient to permit development of more number of pods per plant and seeds per pod of lentils. Likewise, Ziedan [69] reported that increasing the rate of phosphorus increased the number of seeds per pod. It appears that the availability of nutrient by increasing the level of phosphorus increased the number of seeds. This result is in line with Sardar [66] who reported that higher doses of chemical fertilizer were effective on number of seed pod-1.
Seed yield
Seed yield is one of the most important and phenomenal yield components which describe the overall potential of the genotypes and response to treatments applied. The seed yield of lentil was significantly (P<0.01) affected by main effects phosphorus rates but non-significant for varieties and their interaction (Table 5). In contrary, Edossa [3] reported high significant differences were observed among lentil genotypes for most yield related traits, grain and biomass yield and harvest index.
Significantly higher seed yield of lentil was produced with application of 20 kg P ha-1 while the lowest seed yield was obtained from control (1509 kg ha-1). This might be due to the importance of phosphorus in a number of metabolic functions and is especially important for grain formation [32]; therefore, its proper supply to the crops improves their yields. It is needed in relatively large amounts by legumes for growth and nitrogen fixation, and it was found to increase biomass, yield, nodulation, and nutritional quality in lentils [70]. The higher seed yield of lentil gave yield advantage of 56, 15 and 27% over control, application of 10 and 30 kg P ha-1, respectively.
Enhanced seed yield of lentil by increasing P-levels was also reported by Kumar et al. [23]. Improved fertilization enhances the crop-grain yields due to increased availability and uptake of macro and micronutrients [54]. There was a trend of increasing seed yield ha-1 between control to 20 kg P ha-1 and seed yield start to decline after. Increased seed yield could be due to balanced nutrient supply which was higher when phosphorus was applied at the time of sowing and it enabled the plants to produce better growth and seed yield. Kumar et al. [23] reported that application of phosphorous improved the nutrient availability, resulting into greater uptake which might have increased the photosynthesis and translocation of assimilates to different parts for enhanced growth and yield of the crop. In later stage, more assimilates were produced than used in growth and development and the excess assimilates were diverted to storage compounds resulting into increased seed yield. Likewise, Zafar et al. [71] reported that when phosphorus was applied at the time of sowing, it enabled the plants to produce better growth and seed yield.
Thousand seed weights
The main effects of variety and phosphorus rates was showed highly significant (P<0.01) difference on thousand seed weight while nonsignificant for their interaction effect (Table 5). Significantly higher thousand seed weight of (32 g) was recorded for variety Teshale and lower (29 g) for variety Gudo. Similarly, Singh et al. [72] reported significant difference for thousand seed weight among lentil genotypes. Significantly lower (29 g) and higher (37 g) 1000-seed weight were obtained from control and with application of 20 kg P ha-1 respectively. Increase in 1000-seed weight might be due to the influence of cell division, phosphorus contents in the seed as well as the formation of fat and albumin. Thousand-seed weight of lentil also significantly increased with all levels of fertilizers compared to control [17].
Harvest index
Harvest index is the measure of physiological efficiency of a crop plant to convert photosynthesis into the economically important parts of the plant that is ratio of grain to above ground dry biomass are important indicators in seed yield [73]. The main effect of variety and phosphorus rates had highly significant (P<0.01) difference on harvest index while non-significant for their interactions (Table 5). Significantly higher mean values of harvest index (47%) was obtained from Alemtena lentil variety followed by Teshale (46%) and the lowest (42%) by EL-142 variety (Table 5). This result agreed with Hussain [74]; Shah et al.[75] who reported that all cultivars differed significantly from one another regarding to harvest index. Increased mean harvest index of lentil was obtained with increased application of phosphorus. The lower harvest index (42%) was recorded in control while higher harvest index (51%) was recorded with the application of 30 kg P ha-1 (Table 5). This result was in consistence with [76] who reported that lower harvest index at low level of phosphorus application might be due to poor development of plants at different growth stages. Birhan Abdulkadir [77] reported a significant response of harvest index to the application of P on haricot bean. Additionally, the application of 46 kg P2O5 tended to improve the harvest index of faba bean when compared with no P application [16].
Straw yield
The mean dry straw yield of lentil is indicated in Table 6. Main effect of varieties and phosphorus rate showed highly significant (P<0.01) difference on dry biomass yield while their interaction effect was significant (Table 6). Significantly higher dry biomass yield (3874 kg ha-1) was obtained from variety EL-142 with application of 20 kg P ha-1, while the lowest (1695 kg ha-1) was recorded for variety Gudo with application 30 kg P ha-1 (Table 6). All applied phosphorus rates gave significantly higher dry biomass yield as compared to control (Table 6). Dry biomass yield increased as rate of P applied increased from the control to the 20 kg ha-1 of p application and beyond 20 kg ha-1 it declines.
| Phosphorus Rate (PR) kg ha-1 | Varieties (V) | ||||
|---|---|---|---|---|---|
| Gudo | Alemtena | Teshale | EL-142 | Mean | |
| 0 | 2250.0feg | 1756.7i | 1855.7hig | 2119.7fhig | 1995.53 |
| 10 | 2455.7fed | 2589.0ced | 2222.3fheg | 2611.3ced | 2469.58 |
| 20 | 2786.7cbd | 3222.6b | 3016.7cb | 3874.3a | 3225.07 |
| 30 | 1694.7i | 1708.3i | 1745.7i | 1775.7hi | 1731.1 |
| Mean | 2296.78 | 2319.15 | 2210.1 | 2595.25 | |
LSD (0.05) PR × V=451.20; Variety=238.16; Phosphorus rates=238.16; CV (%) 10.99; LSD: Least Significant Difference; CV: Coefficient of Variation. Means within the same column followed by the same letter are not significantly different at 5% probability level.
Table 6: Interaction effect of phosphorus rates and varieties on biomass yield of lentil at Ambo in 2016. Means within the same column followed by the same letter are not significantly different at 5% probability level.
Mean dry biomass yield ranged from 1996 kg ha-1 for the control to 3225 kg ha-1 for 20 kg P ha-1 application. Increased in dry biomass yield of lentil with the increased rate of P might be due to availability of soil nutrients which increases their uptake by plants, which resulted in higher dry matter accumulation in leaves and stem at earlier growth stages and better translocation to seed during later stages. Similarly, Nkaa et al. [55] reported that increasing rate of phosphorus application increased dry matter of lentil. The increase in biomass yield by phosphorus application which may indicate the nutrients is playing a role in metabolism, chlorophyll formation and photosynthesis activities of the plant which in turn increase the biological yield [78].
The relationship between yield and yield attributes of lentil
The relationship among yield and yield components of lentil was presented in Table 7. Correlation analysis indicated that number of nodule per plant was significantly and negatively associated with days to emergency (Table 7). Days to emergency were significantly and negatively correlated with grain yield. The association between days to maturity and nodule number was weak and positively significant (0.46) and also days to maturity positively significant and strongly associated with nodule volume (0.70). Nodule volume was positively associated and highly significant with number of branches and number of seed per pod and significant with harvest index. Days to 50 % flowering showed positive and highly significant correlation with days to maturity. This finding agrees with the result reported by Alemayehu Dugassa et al. [51]. The number of pod per plant was strongly positive and significantly associated with number of primary and secondary branches (0.57 and 0.78) respectively, because the number of pods depends on capacity of branches to hold pods.
| Plant character | |||||||||||||||
|---|---|---|---|---|---|---|---|---|---|---|---|---|---|---|---|
| DE | NNP | NV | NDW | DTF | PH | NPB | NSB | NPP | NSP | BMH | GYH | TSW | DTM | HI | |
| DE | -0.12* | -0.33* | -0.33* | -0.29* | -0.01 | -0.2 | -0.11 | -0.26 | -0.14 | -0.29* | -0.40* | -0.29* | 0.25 | -0.16 | |
| NNP | 0.28 | 0.25** | 0.22 | 0.21 | 0.24 | 0.35* | 0.38** | 0.28 | 0.43** | 0.41** | 0.29* | 0.46** | 0.04 | ||
| NV | 0.48** | 0.03 | 0.24 | 0.38** | 0.54** | 0.6 | 0.47** | 0.63** | 0.31* | 0.44** | 0.70** | 0.31* | |||
| NDW | 0.09 | 0.11 | 0.16 | 0.42** | 0.44** | 0.25 | 0.37** | 0.34* | 0.38** | 0.47** | 0.04 | ||||
| DF | 0.30* | 0.08 | 0.19 | 0.24 | 0.14 | 0.28* | 0.56** | 0.48** | 0.74** | -0.41** | |||||
| PH | 0.11 | 0.2 | 0.28* | 0.12 | 0.39** | 0.21** | 0.14 | 0.28* | 0.13 | ||||||
| NPB | 0.60** | 0.57** | 0.11 | 0.21 | 0.04* | 0.34* | 0.39** | 0.21 | |||||||
| NSB | 0.78** | 0.40** | 0.59** | 0.33* | 0.46** | 0.82** | 0.23 | ||||||||
| NPP | 0.55** | 0.66** | 0.29* | 0.41** | 0.75** | 0.33* | |||||||||
| NSP | -0.39** | 0.07* | 0.37** | 0.52** | 0.29* | ||||||||||
| BMH | 0.61** | 0.40** | 0.75** | 0.31* | |||||||||||
| GYH | 0.43** | 0.58** | 0.55** | ||||||||||||
| TSW | 0.46** | 0.04 | |||||||||||||
| DTM | -0.09 | ||||||||||||||
| HI | |||||||||||||||
DE=Days to Emergence; DF=Days to 50% Flowering; DTM=Days to Physiological Maturity; NPB=Number of Primary Branches; NSB= Number of Secondary Branches; PH=Plant Height; NNP=Number of Nodules per Plant; NV=Nodule Volume; NDW=Nodule Dry Weight; NPP=Number of Pod per Plant; NSP=Number of Seed per Pod; TSW=Hundred Seed Weight; GYH=Grain Yield per Hectare; BMH=Biological Yield per Hectare; HI=Harvest Index; *,**=Significant at 5% and 1% level of significance respectively.
Table 7: Correlation (Pearson) analysis of yield and yield related parameters of lentil varieties grown in the field at Ambo in 2016.
The seed yield was positively correlated to all characters except day to emergency. The association between number of seed per pod with biomass yield was highly significant and negatively correlated. In line with this result, reported by Tigist Dejene [79] that seed yield was positively correlated with plant height, number of pods per plant and biomass yield. However, the authors noted that harvest index rather than biomass yield was a limiting factor in these legume species, and the correlation between the traits was negative. On the other hand, harvest index was found to be related positively with number of seeds per plant and seeds per pod [80]. Salado et al. [81] who reported that working in soybean, found highly and significantly negative association of harvest index with days to flowering.
Phosphorus uptake and allocation
The effects of applied P on seed and straw P level of the lentil varieties is presented in Table 8.
| Variety | P rate(kg/ha) | GP (%) | SP (%) | TPU(kg/ha) | SPH (%) |
|---|---|---|---|---|---|
| Gudo | 0 | 0.36 | 0.09 | 5.94 | 0.05 |
| 10 | 0.37 | 0.09 | 8.6 | 0.12 | |
| 20 | 0.48 | 0.14 | 13.09 | 0.16 | |
| 30 | 0.49 | 0.16 | 16.13 | 0.23 | |
| Mean | 0.42 | 0.15 | 10.94 | 0.14 | |
| Alemtena | 0 | 0.18 | 0.04 | 3.57 | 0.05 |
| 10 | 0.2 | 0.05 | 4.37 | 0.17 | |
| 20 | 0.36 | 0.2 | 12.64 | 0.3 | |
| 30 | 0.49 | 0.33 | 22.49 | 0.32 | |
| Mean | 0.31 | 0.26 | 10.77 | 0.21 | |
| Teshale | 0 | 0.45 | 0.03 | 6.68 | 0.06 |
| 10 | 0.45 | 0.22 | 11.31 | 0.08 | |
| 20 | 0.52 | 0.17 | 14.64 | 0.21 | |
| 30 | 0.57 | 0.18 | 18.12 | 0.24 | |
| Mean | 0.5 | 0.15 | 12.69 | 0.15 | |
| EL-142 | 0 | 0.18 | 0.02 | 2.96 | 0.06 |
| 10 | 0.29 | 0.1 | 6.39 | 0.17 | |
| 20 | 0.31 | 0.15 | 11.65 | 0.18 | |
| 30 | 0.32 | 0.18 | 13.39 | 0.27 | |
| Mean | 0.28 | 0.15 | 8.6 | 0.17 |
GP=Grain Phosphorus content; SP=Straw Phosphorus content; TPU=Total P Uptake; SPH=Soil P content after Harvest.
Table 8: The effect of phosphorus on grain and straw P content, total uptake and residual phosphorus content of the soil after harvest.
Considerable variation in P uptake and allocation were observed among the varieties of lentil due to different rates of applied phosphorus.
Grain phosphorus content increases with increased Phosphorus application from 0 to 30 kg ha-1 and the higher (0.57%) grain p uptake was observed from variety Teshale and the lower (0.18%) from Alemtena and EL-142 varieties at 30 kg ha-1, without phosphorus application (control) respectively. Similarly, [82] straw and grain p uptake increase with phosphorus fertilizer application. The lowest grain P uptake was observed from Alemtena and EL-142 varieties without P fertilizer application. Moreover, the positive effect of P application from 0 to 30 kg ha-1 on the straw phosphorus content was higher (0.33%) in variety Alemtena whereas least in variety EL-142 from control plot (0.02%). Generally, all the varieties had different uptake and allocation for applied phosphorus. This appears to indicate that there is an inherent varietal difference in phosphorus uptake and thereby protein production. Similarly, Lentil variety differ in their root traits (root length and root-hair density), which influence the plant uptake of nutrients [83].
Variety Alemtena had higher phosphorus uptake in the application of 30 kg P ha-1 phosphorus (Table 8), indicting its response for higher rates of phosphorus application particularly with respect to seed yield production. This is therefore, variety Alemtena was an efficient crop to higher rates of phosphorus application (30 kg ha-1) and further application of higher P rates might have better efficiency and seed yield. Similarly, Machado and Furlani [84] who reported that the differences among crop varieties in their ability to absorb phosphorus from soils maybe due to at least three distinct root attributes; the physiological activity to absorb P from dilute solution; metabolic activity resulting in solubilization of absorbed P; and the ability of the root system to explore the soil phosphorus. Moreover, significantly lower phosphorus concentration in plant tissues that were not supplied with phosphorus fertilizer [59]. An increased trend in soil phosphorus content after harvest as compared to preplanting content of P was also observed in this study (Table 8).
Apparent phosphorus recovery and efficiency
In all lentil varieties, non-consistent values of apparent fertilizer recovery, agronomic efficiency and physiological efficiency were observed with increasing P rates (Table 9). Variety Alemtena with application of 30 kg P ha-1 had the highest value of recovery (63 %) followed by Teshale (46 %) with application of 10 kg P ha-1. The agronomic efficiency, Gudo variety with the application of 20 kg P ha-1 was higher (50 %) followed by Teshale (40%) with at 20 kg P ha-1 while 2.78 % EL-142 with application of 10 kg P ha-1.
| Variety | P rate(kg/ha) | AFR (%) | AE (%) | PE (%) |
|---|---|---|---|---|
| Gudo | 10 | 26.62 | 50 | 187.97 |
| 20 | 35.75 | 34.99 | 97.9 | |
| 30 | 33.98 | 39 | 114.49 | |
| Mean | 32.12 | 41.33 | 133.45 | |
| Alemtena | 10 | 8.04 | 9.83 | 122.91 |
| 20 | 45.36 | 22.14 | 48.82 | |
| 30 | 63.07 | 25.69 | 40.73 | |
| Mean | 38.82 | 19.22 | 70.82 | |
| Teshale | 10 | 46.22 | 19.44 | 41.99 |
| 20 | 39.78 | 40.28 | 101.2 | |
| 30 | 38.14 | 28.15 | 73.81 | |
| Mean | 41.38 | 29.29 | 72.33 | |
| EL-142 | 10 | 34.36 | 2.78 | 8.1 |
| 20 | 43.47 | 29.72 | 68.41 | |
| 30 | 35 | 33.33 | 95.88 | |
| Mean | 37.61 | 21.94 | 57.46 |
AFR=Apparent Fertilizer Recovery; AE=Agronomic Efficiency; PE=Physiological Efficiency
Table 9: The effect of phosphorus on fertilizer recovery and efficiency on lentil varieties.
The mean physiological efficiency of Gudo variety with the application of 10 kg P ha-1 had higher (188 %) followed by Alemtena (123 %) with application of 10 kg P ha-1 and least from EL-142 (8.10) with 10 kg P ha-1 application. This might be due the differences in phosphorus allocation of the varieties to their seeds and straw besides their uptake. Difference in P-use efficiency among crop species and genotypes within species including dry bean is widely reported by Fageria et al. [27]. Baligar et al. [85] reported that plants differ widely in their ability to grow in soils with low P, and this has been attributed to several plant traits, including morphology of root system and root hair density.
Effect of Phosphorus Fertilizer on Economic Feasibility of Lentil Production
The highest net benefit of EB 72240 ha-1 with marginal rate of return of 1177 % was obtained with application of 20kg P ha-1 followed by net benefit of EB 62706 ha-1 and marginal rate return of 1445% with application of 10 kg P ha-1 and the lower net benefit was 55188 EB ha-1 with marginal rate return 243% through application of 30kg P ha-1(Table 10). This is agreement with the findings of [58]. Therefore, application of 20 kg P ha-1 is economical feasible for lentil production in Ambo area which support the previous P fertilizer recommendation for pulses in the country.
| Phosphorous rate (kg P ha-1) | ||||
|---|---|---|---|---|
| 0 | 10 | 20 | 30 | |
| Average yield(kg/ha) | 1509 | 2024 | 2360 | 1852 |
| Adjusted yield(kg/ha) | 1358 | 1822 | 2124 | 1667 |
| Gross filed benefit(EB/ha) | 47534 | 63756 | 74340 | 58338 |
| Cost of fertilizer(EB/ha) | 0 | 1050 | 2100 | 3150 |
| Total cost(EB/ha) | 0 | 1050 | 2100 | 3150 |
| Net benefit (EB/ha) | 47534 | 62706 | 72240 | 55188 |
| Marginal rate of return (%) | 1445 | 1177 | 243 | |
Grain yield cost=35 EB kg-1; Cost of UREA=11.92 EB kg-1; Cost of TSP=21 EB kg-1; Grain yield adjustment=10%.
Table 10: Partial budget Analysis on farm-lentil at Ambo Vertisol.
Conclusion
The lentil varieties evaluated showed significant variation in some of the yield and yield parameters. Days to maturity, days to flowering, number of nodule, plant height, biological yield and phosphorus use efficiency were the most important characters in evaluating the performance of the varieties as these characters are highly determinant in economical view of crop production. Thus, the lentil varieties, as noticed from their performance on various growths and phenological characters including its response to phosphorus application, might be used alternatively under Ambo’s agroecology. There was significance and positive correlation with most growth parameters, yield and yield components. Applications of phosphorus influenced all parameters of lentil varieties, P fertilizer recovery, agronomic and physiological efficiencies of the varieties. Application of P rates (20 kg/ha) was better in most parameters recorded hence it become decreasing if more than this or at 30 kg/ha of P was applied. Ultimately highest net benefits of EB 72240 ha-1 and marginal rate return of 1177% with application of 20 kg P ha-1 was obtained for lentil production. Therefore, production of lentil varieties with 20 kg P ha-1 is recommended for vertisol of Ambo district and similar agroecology.
References
- Dhuppar P, Biyan S, Chintapalli B, Rao S (2012) Lentil Crop Production in the Context of Climate Change: An Appraisal. Indian Research Journal of Extension Education 2: 33-35.
- Ford RR, Taylor PWJ (2003) Construction of an intra-specific linkage map of lentil (Lens culinaris ssp. culinaris). Theory Applied Genetics 107: 910-916.
- Edossa F, Kassahun T, Endashaw B (2007) Genetic diversity and population structure of Ethiopian lentil (Lens culinaris Medik) landraces as revealed by ISSR marker. African Journal of Biotechnology 6: 1460-1468.
- Central Statistical Agency (2016) Central Statistical Agency, Agricultural Sample Survey Report on: Area and Production of major Crops (private peasant holdings, Meher season). Statistical Bulletin 584, Addis Ababa, Ethiopia. Volume I.
- Karimizadeh R, Muhammadi M, Shefazadeh MK, Mahmoodi A, Rustami B, et al. (2012) Relationship among and repeatability of ten stability indices for grain yield of food lentil genotypes in Iran. Turkish Journal Field Crops 17: 51-61.
- Abraham Reda (2015) Lentil (Lens culinaris Medikus) Current Status and Future Prospect of Production in Ethiopia. Advances in Plants and Agriculture Research 2: 00040.
- Dariel Burdass (2002) Society for general microbiology, SGM Marlborough House, Basingstoke Road, Spencers Wood, Reading RG71AG.
- FAOSTAT (2014) Food and Agriculture Organizations of the United Nations. Statistics Division.
- Ghanem ME, Marrou H, Soltani A, Kumar S, Sinclair TR (2015) Lentil Variation in Phenology and Yield Evaluated with a Model. Agronomy Journal 107: 1967-1977.
- Geletu B, Yadeta A (1998) Alemaya Self-Adjusting Lentil variety to different environments in Ethiopia. NVRSRP Newsletter No 1: 1-4.
- Sepetoglu H (2002) Grain legumes. Department of Field Crops, Faculty of Agriculture, University of Ege, Yzmir, Turkey.
- Marschner P (2012) Marschner's Mineral Nutrition of Higher Plants. 3rd Edition, Academic Press, San Diego, p: 651.
- Tessema T, Alemayehu B (2015) Effect of Phosphorus Application and Varieties on grain yield and yield components of Common Bean (Phaseolus vulgaris L.). American Journal of Plant Nutrition and Fertilization Technology 5: 79-84.
- Devi KN, Singh LNK, Devi TS, Devi HN, Singh TB, et al. (2012) Response of soybean [Glycine max (L.) Merrill] to sources and levels of phosphorus. Journal Agriculture Sciences 4: 44-53.
- Tekle E, Kubure, Raghavaiah CV, Ibrahim H (2016) Production Potential of Faba Bean (Vicia faba L.) Genotypes in Relation to Plant Densities and Phosphorus Nutrition on Vertisols of Central Highlands of West Showa Zone, Ethiopia, East Africa. Advances in Crop Science and Technology 4: 214.
- Ullah S, Jan A, Ali M, Ahmad A, Ullah A, et al. (2017) Effect of phosphorous under different application methods on yield attributes of chickpea (cicer arietinum L.). International Journal Agriculture and Environment Research 3: 79-85.
- Karikari B, Arkorful E, Addy S (2015) Growth, Nodulation and Yield Response of Cowpea to phosphorus fertilizer application in Ghana. Journal of Agronomy 14: 234-240.
- Marschner P (2012) Marschner's Mineral Nutrition of Higher Plants. 3rd Edition, Academic Press, San Diego, p: 651.
- Ibsa A (2013) Agronomic and symbiotic characteristics of chickpea, Cicer arietinum (L.), as influenced by Rhizobium inoculation and phosphorus fertilization under farming systems of Wolaita area, Ethiopia. MSc thesis p: 78.
- Azmera W, Pellegrino C (2017) Elucidating the Role of Phosphorous on Growth Performance and Yield components of Haricot bean (Phaseolus vulgaris L.) at Arba Minch, Southern, Ethiopia. International Journal of Agricultural Research and Review 5: 579-587.
- Gifole G, Sheleme B, Walelign W (2012) The Response of haricot bean (Phaseolus vulgaris L.) to phosphorus application on Ultisols at Areka, Southern Ethiopia. Journal of Biology, Agriculture and Healthcare 1: 38-49.
- Kumar MV, Ul-Hasan Z, Dhurwe UK (2009) Effects of PSB (phosphate Solubiling Bacteria) morphological on character of Lens culinaris Medic. Medeterranian Biology Forum International Journal 1: 5-7.
- Amare G, Assaye D, Tuma A (2014) The Response Of Haricot Bean Varieties To Different Rates Of Phosphorus At Arba Minch, Southern Ethiopia. ARPN Journal of Agricultural and Biological Science 9: 344-350.
- Sarker A, Erskine W, Baker MA, Rahman MM, Yadav NK (2004) Role of lentil in human nutrition and crop diversification in Asia region. In: Gowda CLL, Pande S (eds.). Role of Legumes in Crop Diversification and Poverty Reduction in Asia. CLAN Steering Committee Meeting.
- Hojjat SS, Taherzadeh A (2013) Effect of integrated application of a complex fertilizer (N30P50) on nitrogen fixation by Lentil (Lens culinaris Medik.). International Journal of Agriculture and Crop Sciences 5: 896-899.
- Fageria NK, Baligar VC, Moreira A, Portes TA (2010) Dry bean genotypes evaluation for growth, yield components and phosphorus use efficiency. Journal Plant Nutrition 33: 2167-2181.
- Gahoonia TS, Nielsen NE (2004) Barley genotypes with long root hairs sustain high grain yields in low-P field. Plant Soil 262: 55-62.
- Wasaki J, Yamamura T, Shinano T, Osaki M (2003) Secreted acid phosphatase is expressed in cluster roots of lupin in response to phosphorus deficiency. Plant Soil 248: 129-136.
- Clark RB, Duncan RR (1991) Improvement of plant mineral nutrition through breeding. Field Crops Research 27: 219-240.
- Sharma BC, Sharma SC (2004) Integrated nutrient management in lentil. Advances in Plant Science 17: 195-197.
- Balyan JK, Singh M (2005) Effect of seed inoculation, different levels of irrigation and phosphorus on nodulation and root growth development of lentil. Research on Crops 6: 323.
- Chapman HD (1965) Cation exchange capacity by ammonium saturation. In: Black CA (ed.) Methods of Soil Analysis. Agronomy part II No 9, American Society of Agronomy, Madison, Wisconsin, USA, pp: 891- 901.
- Dewis J, Freitas F (1970) Physical and chemical methods of soil and water analysis. FAO Soils Bulletin 10. FAO, Rome, p: 275.
- Olsen SR, Cole CV, Watenabe FS, Dean LA (1954) Estimation of the valuable phosphorus in soil by extraction with sodium bicarbonate. United States Department of Agriculture Circular 939, USA.
- Sahlemedin S, Taye B (2000) Procedure for soil and plant analysis: National Soil Research Center, Ethiopia Agricultural Research Organization. Technical paper No 74, Addis Ababa, Ethiopia.
- Yerima BPK (1993) Manual for good laboratory practice. Food and Agriculture Organization of the United Nation, Addis Ababa.
- Ryan J, Estefan G, Rashid A (2001) Soil plant analysis by automated laboratory equipment. In: Soil and Plant Analysis Laboratory Manual. 2nd Edition. International Center for Agricultural Research in Dry Areas, Aleppo, Syria, pp: 124-139.
- Ahmad N (1985) Phosphorus requirements of wheat crop in different cropping systems. Fert News 30: 38-42.
- Delgado A, Uceda I, Andreu L, Kassem S (2002) Fertilizer phosphorus recovery from gypsum-ammended reclaimed calcarious marsh soils. Arid Land Research Management 16: 319-334.
- Loneragan JF (1978) The physiology of plant tolerance to low P availability. In: Jung GA, (Ed). Crop tolerance the sub-optimal land conditions. American Society of Agronomists, Madison, WI, pp: 329-342.
- Pal UR (1991) Crop Physiology. Department of plant sciences. Haramaya University. Ethiopia.
- Mengel K, Kirkby EA (2001) Principles of Plant Nutrition. International Potash Institute, p: 849.
- SAS (2004) SAS/STAT Software Syntax, Version 9.0. SAS Institute, Cary, NC, USA.
- CIMMYT (International Maize and Wheat Improvement Center) (1988) From agronomic data to farmer recommendations: An Economics training manual. Mexico, p: 79.
- London JR (1991) Booker tropical soil manual: A Handbook for Soil Survey and Agricultural Land Evaluation in the Tropics and Subtropics. Longman Scientific and Technical, Essex, New York, p: 474.
- Mamo T, Haque I (1991) Phosphorus of some Ethiopian soils. 111. Evaluation of some soil test methods for available phosphorus. Tropical Agriculture 68: 51-56.
- Asim M, Musharraf K, Nisar A, Kamran K, Sajid UK (2015) Variability of Vigour and Viability of Various Varieties of Common Bean (Phaesolus vulgaris L.) Land Races. American Eurasian Journal Agriculture and Environment Science 15: 957-961.
- Asrat A, Tana T (2013) Response of Chickpea (Cicer arietinum L.) Varieties to Rates of Nitrogen and Phosphorus Fertilizer at Debre Zeit, Central Ethiopia. Doctoral dissertation, Haramaya University.
- Bruce B (2016) Phosphorus management for pulses, International year of pulses.
- Dugassa A, Legesse H, Geleta N (2014) Genetic Variability, Yield and Yield Associations of Lentil (Lens culinaris Medic.) Genotypes Grown at Gitilo Najo, Western Ethiopia. Ethiopia Science, Technology and Arts Research Journal 3: 10-18.
- Brady NC, Weil RR (2002) The Nature and Properties of Soils. Pearson education Ltd, USA, pp: 156-198.
- Onasanya A, Ekperigin MM, Nwilene FE, Sere Y, Onasanya RO (2009) Two pathotypes of Xanthomonas oryzae pv. oryzae virulence identified in West Africa. Current Research Bacteriology 2: 22-35.
- Tang C, Hinsinger P, Drevon JJ, Jaillard B (2001) Phosphorus deficiency impairs early nodule functioning and enhances proton release in roots of Medicago truncatula L. Annals of Botany 88: 131-138.
- Nkaa FA, Nwokeocha OW, Ihuoma O (2014) Effect of Phosphorus fertilizer on growth and yield of cowpea (Vigna unguiculata). IOSR Journal of Pharmacy and Biological Sciences 9: 74-82.
- Zahan SA, Alim MA, Hasan MM, Kabiraj UK, Hossain MB (2009) Effect of potassium levels on the growth, yield and yield attributes of lentil. Internatinal Journal Sustainable Crop Production 4: 1-6.
- Sarker DKR (2005) Study on the growth, yield and yield attributes of advanced mutants of lentil. Master’s thesis. Department Crop Botany, BAU, Mymensingh.
- Haque DE (2002) Effect of Madagascar technique of younger seedling and wider spacing on growth and yield of born rice. MSc Thesis. Department of Agronomy Bangladesh Agricultural. University Mymensingh, pp: 28-71.
- Woldesellasie T (2007) Response of Improved Lentil (Lens culinaris Medik) Varieties to Phosphorus Application on Vertisols at Haramaya. MSc Thesis, Haramaya University.
- Tesfaye T, Balcha A (2015) Effect of Phosphorus Application and Varieties on grain yield and yield components of Common Bean (Phaseolus vulgaris L.). American Journal of Plant Nutrition and Fertilization Technology 5: 79-84.
- Taylor, Francis (2005) Root Growth, Nodulation, Grain Yield, and Phosphorus Use Efficiency of Lentil as Influenced by Phosphorus, Irrigation, and Inoculation. Communications in soil science and plant analysis 36: 1919-1929.
- Rahman AKMM (2007) Influence of hilly environment on vegetative growth and reproductive development in lentil varieties. Annual report, Agronomy division.
- Rashid A, Rahmat UK (2008) Comparative effect of varieties and fertilizer levels on barley. International Journal Agricultural Biology 10: 124-126.
- Mohammadjanloo A, Mohseni A, Gholipouri A, Tobeh A, Mostafeai H (2009) Study of effects of different levels of nitrogen and potassium on yield and yield components of rain-fed lentil. Plant Ecology Physiology 2: 91-94.
- Rahman MM, Islam MM, Hoque ME, Ahmed B (2015) Performance of advanced lentil Genotypes In different pulse rowing regions of Bangladesh. Eco Friendly Agricultural Journal 8: 116-120.
- Sardar MSU (2002) Influence of plant density and phosphorus and inoculation on the growth and yield of mung bean. An MSc thesis, Department of Agronomy, Bangladesh Agricultural University, Mymensingh, p: 52.
- Sharar MS, Ayub M, Nadeem MA, Naeem M (2003) Effect of different combinations of nitrogen and phosphorus on the growth and yield of three varieties of lentil (Lens culinaris Medik). Pakistan Journal Life Social Sciences 1: 54-56.
- Shubhashree KS (2007) Response of Rajmash (Phaseolus Vulgaris L.) To the levels of nitrogen, Phosphorus and Potassium during Rabi in the Northern Transition Zone. Dharwad, USA.
- Zeidan MS (2007) Effect of organic manure and phosphorus fertilizers on growth, yield and quality of lentil plants in sandy soils. Research Journal of Agriculture and Biological Sciences 38: 745-752.
- Yemane A, Skjelvag AO (2003) Effects of Fertilizer Phosphorus on Yield Traits of Dekoko (Pisum sativum var. abyssinicum) Under Field Conditions. Journal of Agronomy and Crop Science 189: 14-20.
- Zafar M, Maqsood M, Ramzan AM, Zahid A (2003) Growth and Yield of Lentil as Affected by Phosphorus. Intl J Agri Biol 5: 98-100.
- Singh G, Ram H, Sekhon HS, Aggarwal N, Veena KV (2011) Effect of Nutrient Management on Nodulation, Growth and Yield of Lentil (Lens culinaris Medik.) Genotypes. American Eurasian Journal of Agronomy 4: 46-49.
- Rahman MH, Wajid SA, Afza M, Ahmad A, Awais M, et al. (2013) Performance of promising lentil (lens culinaris medik.) cultivars at different nitrogen rates under irrigated conditions of faisalabad, Pakistan. Cercetari agronomice in Moldova 46: 79-89.
- Hussain M, Shah SH, Nazir MS (2002) Differential genotypic response to phosphorus application in lentil (Lens culinaris M.). Pakistan Journal of Agricultural Sciences 39: 193-196.
- Shah NH, Hafeez FY, Arshad M, Malik KA (2000) Response of lentil to Rhizobium leguminosarum bv. viciae strains at different levels of nitrogen and phosphorus. Australian Journal of Experimental Agriculture 40: 93-98.
- Chiezey UF, Yayock J, Shebayan AY (1992) Response of soybean to N and P fertilizer levels. Journal of Tropical Science Zaria 32: 361-368.
- Abdulkadir B (2006) Response of haricot bean (Phaseolus vulgaris L.) to nitrogen, phosphorus and inoculation of Rhizobium Leguminosarum on yield and yield components at Melkassa. MSc Thesis, University of Hawassa, Awassa College of Agriculture, Ethiopia, p: 97.
- Fageria NK (2009) The use of nutrients in crop plants. CRC Press, USA pp: 430.
- Tigist D (2003) Genetic variability and associations among yield and yield related characters in exotic lentil lines (Lens culinaris Medik.). MSc thesis. Alemaya University, Ethiopia.
- Kebere Bezaweletaw, 2000. Genetic Gain Yield Potential and Associated Agronomic Traits in Haricot Bean (Phaseolus vulgaris L.). Kasetsart J Nat Sci 40: 835-847.
- Salado Navaro LR, Sinclair TR, Hinson K (1993) Changes in seed growth traits in soybean cultivars released in Southern USA from 1945 to 1983. Crop Science 33: 1204-1209.
- Kabir MH, Talukder NM, Uddin MJ, Mahmud H, Biswas BK (2011) Total Nutrient Uptake by Grain plus Straw and Economic of Fertilizer Use of Rice Mutation STL-655 Grown under Boro Season in Saline Area Journal Environment Science and Natural Resources 4: 83-87.
- Gahoonia TS, Ali O, Sarker A, Nielsen NE, Rahman MM (2006) Genetic variation in root traits and nutrient acquisition of lentil genotypes. Journal of Plant Nutrition 29: 643-655.
- Machado CT, Furlani AMMC (2004) Kinetics of Phosphorus uptake and root morphology of local and Improved Varieties of Maize. Science Agriculture (Piracicaba, Braz.) 61: 69-76.
- Baligar VC, Fageria NK, He ZL (2001) Nutrient use efficiency in plants. Communications in Soil Science and Plant Analysis 32: 921-950.
Citation: Zike T, Abera T, Hamza I (2017) Response of Improved Lentil (Lens Culinaris Medik) Varieties to Phosphorus Nutrition on Vertisols of West Showa, Central Highlands of Ethiopia. Adv Crop Sci Tech 5: 315. DOI: 10.4172/2329-8863.1000315
Copyright: © 2017 Zike T, et al. This is an open-access article distributed under the terms of the Creative Commons Attribution License, which permits unrestricted use, distribution, and reproduction in any medium, provided the original author and source are credited.
Select your language of interest to view the total content in your interested language
Share This Article
Recommended Journals
Open Access Journals
Article Tools
Article Usage
- Total views: 7996
- [From(publication date): 0-2017 - Nov 26, 2025]
- Breakdown by view type
- HTML page views: 6829
- PDF downloads: 1167