River Slope and Roughness Impact on Downstream Hydraulic Structures
Received: 18-Oct-2018 / Accepted Date: 29-Nov-2018 / Published Date: 30-Nov-2018 DOI: 10.4172/2157-7617.1000500
Abstract
A structure built over a river is designed based on its maximum flow. It depends on catchment size, roughness, rainfall intensity, and the base course of the river. The structure has to be adequate to resist the pressures, particularly, the water from the upstream drainage area throughout its service life. The runoff generates from the catchment is fused to tributaries, brooks, rivulets, and seams to the river. The speed and depth of the water on these channels are mainly depended on the slope, roughness, and their magnitude. So, the flood and its occurrence time on a structure in a river retard or hustle due to the river-bed characteristics. This study has shown the impacts of these river-bed parameters, mainly slope and roughness, on the hydraulic structures of the river. The hypothetical characters of the sampled river length combination analysis are different. The study has considered the existing river slope and roughness as an initial condition. The maximum, minimum and average slope and roughness are also the considered values in the analysis. The researcher has taken more than five kilometres of sampled river length upstream of Kessem Kebena reservoir and has analysed the flow conditions on these hypothetical river parameters for a constant discharge at the inlet to the river. Nine-character combinations have been produced from the three common roughness and slope values. Hence, these combinations have produced two, unlike results. The one has retards whereas the other group speeds up the discharge on the downstream structures. The extreme discharge variation that has been retarded and has been added from the natural condition to the downstream structure is 5.80 m3/s and 4.20 m3/s respectively. Therefore, the hydrological engineer has to consider the upstream river slope and roughness while estimating the upstream drainage area runoff and design the downstream river structure.
Keywords: Riverbed slope and roughness; Flood; Reservoir; River reaches; Water
Introduction
Floods are a natural phenomenon and the most frequent and destructive natural disasters in both developed and developing countries from the ancient age till now [1]. Due to the climatic extremes and human interference, it will continue to occur at different places and times in the near future. The maximum design flood of a hydraulic structure helps to design riverine hydraulic structures. It determines based on engineered cost-benefit analysis and consideration of hydrologic factors [2]. The upstream catchment inundation extents, the purpose of the built and its location, cost, the river condition, the river flow are the main consider constraints to construct hydraulic structures across a river [2]. The drainage area of the upstream catchment of the structure, in particular, is the basic factor to compute the design flood amount [3,4] because it helps to estimate both the surface and subsurface water potential originate within it. The runoff of a particular catchment depends on the main parameters: topography, land and soil cover, rainfall intensity and drainage area [4,5]. After determining the upstream flood magnitude of the catchment, the hydraulic engineer has to survey, study, design, and construct a structure on a river either to carry, pass or store the flooding amount. Meanwhile, enormous studies show that upstream soil and land cover are the main and foremost runoff parameter of a catchment [4]. When the upstream drainage area of the catchment largely covered by grass and bushes the runoff of the catchment becomes low and its infiltration rate is high. Whereas the area covers bare land and impervious materials the catchment runoff is high and its infiltration is very trifling [6]. That is why many hydrologic studies cover soil and land cover as a part of the study. However, the other parameters i.e., rainfall intensity and area have also a precise effect. Although, any structure construct across a river do not design by considering the upstream runoff and soil condition alone and it has to consider both the slope and roughness of the river itself and the slope of the catchment. The river bed slope and roughness has a vital role in speeds up and retards of the river flow. But, most hydrologic project designs have lost these sensitive issues and did not consider while design. The researcher has been assessing diverse flood design papers and most of them did not consider the river characteristics. These character results, as it observes in different rivers, have a significant impact on flood reduction and evaluation.
The Kessem Kebena dam project did not consider the 230 km river length roughness and slope upstream of the reservoir while estimating the design flood of the dam [7]. With similar to this, the research studied by Roy and Mistri, flood discharge computation did not consider the roughness and slope of the river [3]. The main objective of this study is showing the impact of upstream river-bed slope and roughness on the downstream structure constructed across a river. The study is conducted and focused on Kessem River. There is a dam on the river which called Kessem Kebena dam. The upstream fetch length of the reservoir water is 8 km from the crest of the dam. The research has been taken around five kilometres upstream of the entrance to the reservoir. Therefore, considering the upstream river slope and roughness of a river for estimating the upstream catchment flood in the design of the downstream structure is very vital.
Description of the Study Area
The study is conducted on a 5.4 km length of Kessem River at the upstream of the reservoir of the dam. The river is one of the main watercourses, which is found in the Afar region, and tributaries of Awash River in the central part of Ethiopia. It is the main water source of Kessem Kebena dam. The river catchment to dam site covers about 3,135 km2 and extends from an altitude of almost 3,600 m to 860 m elevation. The mainstream length of the river up to the dam axis is 230 km. The area experiences a typically tropical semi-arid climate with a rainfall range of 350 mm to 600 mm. Temperature varies from mean minima of 15°C and 21°C to mean maxima of 23°C and 38°C in December and June respectively. Mean relative humidity is lowest in January 36% and highest in August 58%. Mean daily sunshine reported on an annual basis is 8.5 hr. The land use condition of the river catchment mainly includes: mainly of cultivated agricultural land, grassland, forest land, rural and urban settlements. The most common soil types are clay, sand, and silt [8].
Data and Methods
The significant data needed for the research are collected from diverse sources. Most of the primary data have been collected on the spot over 5.4 km sampled river length upstream of the rim of the reservoir. The data are river reaches, cross sections, junctions, roughness and bed slopes. Relevant secondary data have been collected from the ministry of water, irrigation and electric. It includes the magnitude of design flood along with its corresponding return period of the dam and the monthly average rainfall data of the Kessem catchment.
Meteorological data collection
This is described in Table 1.
| Month | Jan. | Feb. | Mar. | Apr. | May | Jun. | Jul. | Aug. | Sept. | Oct. | Nov. | Dec. |
|---|---|---|---|---|---|---|---|---|---|---|---|---|
| RF (mm) | 12.1 | 28.2 | 47.2 | 5.7 | 45.8 | 63.1 | 242.5 | 261.4 | 99.3 | 25.1 | 9.9 | 5.7 |
Table 1: Monthly average rainfall data of the catchment
River reaches and cross sections
The river is divided into reaches based on the change in channel width and water depth, slope, and curvature of river morphology, the presence of trivial tributaries though their impact is assumed nil and physical channel roughness deviation [9]. There are 30 reaches throughout the appraised river stretch and described in Table 2 as shown below.
| Reach Name | Notification | Entrance location | Exit location | Reach classification criteria’s |
|---|---|---|---|---|
| Reach 01 | Between Node 0 and Node 1 | Node 1 | Node 0 | Entrance of the reservoir |
| Reach 02 | Between Node 1 and Node 2 | Node 2 | Node 1 | Existence of small tributaries, Expansion of channel width and Reduce in water depth |
| Reach 03 | Between Node 2 and Node 3 | Node 3 | Node 2 | Expansion of channel width and Increase in water depth |
| Reach 04 | Between Node 3 and Node 4 | Node 4 | Node 3 | Contraction of channel width and Increase in water depth |
| Reach 05 | Between Node 4 and Node 5 | Node 5 | Node 4 | Existence of small tributaries and Contraction of channel width |
| Reach 06 | Between Node 5 and Node 6 | Node 6 | Node 5 | Existence of small tributaries, Contraction of channel width and Reduce in water depth |
| Reach 07 | Between Node 6 and Node 7 | Node 7 | Node 6 | Contraction of channel width and Reduce in water depth |
| Reach 08 | Between Node 7 and Node 8 | Node 8 | Node 7 | Expansion of channel width and Reduce in water depth |
| Reach 09 | Between Node 8 and Node 9 | Node 9 | Node 8 | Expansion of channel width and Reduce in water depth |
| Reach 10 | Between Node 9 and Node 10 | Node 10 | Node 9 | Existence of small tributaries, Expansion of channel width and Increase in water depth |
| Reach 11 | Between Node 10 and Node 11 | Node 11 | Node 10 | Contraction of channel width, Reduce in water depth and Channel roughness variation |
| Reach 12 | Between Node 11 and Node 12 | Node 12 | Node 11 | Existence of small tributaries and Contraction of channel width |
| Reach 13 | Between Node 12 and Node 13 | Node 13 | Node 12 | Expansion of channel width |
| Reach 14 | Between Node 13 and Node 14 | Node 14 | Node 13 | Existence of small tributaries, Expansion of channel width and Increase in water depth |
| Reach 15 | Between Node 14 and Node 15 | Node 15 | Node 14 | Existence of small tributaries, Contraction of channel width and reduce in water depth |
| Reach 16 | Between Node 15 and Node 16 | Node 16 | Node 15 | Expansion of channel width and Increase in water depth |
| Reach 17 | Between Node 16 and Node 17 | Node 17 | Node 16 | Expansion of channel width and Reduce in water depth |
| Reach 18 | Between Node 17 and Node 18 | Node 18 | Node 17 | Expansion of channel width and Reduce in water depth |
| Reach 19 | Between Node 18 and Node 19 | Node 19 | Node 18 | Expansion of channel width and Existence of small tributaries |
| Reach 20 | Between Node 19 and Node 20 | Node 20 | Node 19 | Contraction of channel width and Increase in water depth |
| Reach 21 | Between Node 20 and Node 21 | Node 21 | Node 20 | Existence of small tributaries and Contraction of channel width |
| Reach 22 | Between Node 21 and Node 22 | Node 22 | Node 21 | Contraction of channel width and Increase in water depth |
| Reach 23 | Between Node 22 and Node 23 | Node 23 | Node 22 | Contraction of channel width and Reduce in water depth |
| Reach 24 | Between Node 23 and Node 24 | Node 24 | Node 23 | Existence of small tributaries and Expansion of channel width |
| Reach 25 | Between Node 24 and Node 25 | Node 25 | Node 24 | Contraction of channel width, Reduce in water depth and Channel roughness variation |
| Reach 26 | Between Node 25 and Node 26 | Node 26 | Node 25 | Existence of small tributaries and Contraction of channel width |
| Reach 27 | Between Node 26 and Node 27 | Node 27 | Node 26 | Contraction of channel width and Increase in water depth |
| Reach 28 | Between Node 27 and Node 28 | Node 28 | Node 27 | Existence of curvature |
| Reach 29 | Between Node 28 and Node 29 | Node 29 | Node 28 | Reduce in water depth |
| Reach 30 | Between Node 29 and Node 30 | Node 30 | Node 29 | Reduce in water depth |
Table 2: River reaches, cross sections and their division criteria.
The pattern of the river is classed as relatively straight and low meandering. The topographical morphology, river nodes and reaches of the river are shown in Figure 1.

Figure 1: Symbolized river nodes and reaches schematization.
River cross sections
The sampled river has 31 cross-sectional nodes. Here, node 0 designated as N0, node 1 as N1… node N30 as N30 and surveyed from the rim of the river to the upstream till the last node of the river. These nodes elevation data have taken on the spot. The nodes cross sections are schematized by excel spread-sheets. The schematized N0 and N30 are shown in Figure 2 and Figure 3 respectively. Then, the wetted area of each section is computed by means of rectangular counting and multiplying system.

Figure 2: River cross section at node 0.

Figure 3: River cross section at node 30.
Initial discharge of the river
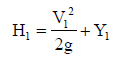
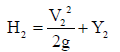
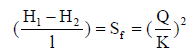
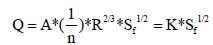
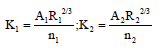
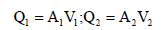
The area-velocity, slope-area, salt-concentration, moving-boat, and electromagnetic methods are commonly used for river discharge measurement [10,11]. The initial river discharge uses an initial boundary condition discharge to compute the design floods. It is computed using the natural river roughness, slope, and water depth data and the slopearea method. The method is preferable to get the result by incorporating the principle of conservation of energy between two cross-sections. It is also very vital to appraisal discharge during minimum flow and dry state just using the debris twigged on the river bank. Then, the initial discharge helps to compute the design flood of the river by a kinematic wave distributed flow routing model. Distributed flow routing model is a Saint-Venant equation based one-dimensional flow that allows the flow rate and water level to be computed as functions of space and time [12]. The discharge at each cross-section is obtained by assuming uniform flow condition in the river. The methodologies of computation are discussed as follows: It is routed beginning from N0 and traced to the upstream. The profile at two cross sections (1) and (2) are located from the observed topographic survey of the river. Then, their wetted areas A1 and A2 and wetted perimeters P1 and P2 are computed using their corresponding flood water depths. The hydraulic radii R1 and R2 and the conveyances K1 and K2 are calculated based on the reaches roughness coefficient n1 and n2. The average conveyance K between Sections (1) and (2) is obtained by using equation (6). The discharge at (1) and (2) are calculated using the assumed suitable energy grade line and equation (4). The velocity of water V1 and V2 at (1) and (2) are estimated using equation (8). The energy heads H1 and H2 are computed from equation (1) and (2) respectively. The energy slope is obtained from equation (3). In this computation, the assumed energy slope value used in discharge calculation should be the same as the calculated value in equation (3). However, most of the times, the two values are different. Thus, it needs reputable iterations till the computed energy slope in equation (3) and (4) are equal. As a result, the calculated discharge at the end is the estimated initial discharge of the river which passes through at the corresponding cross-section [13]. The computed initial discharge of the river nodes are tabulated in Table 3.
| Reach Name | Reach 01 | Reach 02 | Reach 03 | Reach 04 | Reach 05 | Reach 06 | Reach 07 | Reach 08 |
| Discharge (m3/s) | 3,778.90 | 5,224.60 | 4,693.80 | 3,626.30 | 3,021.30 | 3,181.90 | 3,801.60 | 3,131.80 |
| Reach Name | Reach 09 | Reach 10 | Reach 11 | Reach 12 | Reach 13 | Reach 14 | Reach 15 | Reach 16 |
| Discharge (m3/s) | 3,596.40 | 4,258.60 | 2,043.40 | 2,794.60 | 6,363.10 | 2,015.90 | 5,879.20 | 4,652.20 |
| Reach Name | Reach 17 | Reach 18 | Reach 19 | Reach 20 | Reach 21 | Reach 22 | Reach 23 | Reach 24 |
| Discharge (m3/s) | 3,007.80 | 3,613.90 | 8,003.60 | 2,174.10 | 4,914.50 | 8,575.20 | 5,416.80 | 7,025.20 |
| Reach Name | Reach 25 | Reach 26 | Reach 27 | Reach 28 | Reach 29 | Reach 30 | ||
| Discharge (m3/s) | 3,355.60 | 2,265.20 | 2,227.60 | 4,577.00 | 3,256.10 | 2,550.00 |
Table 3: Initial discharge of the river reaches.
 (1)
(1)
 (2)
(2)
 (3)
(3)
 (4)
(4)
 (5)
(5)
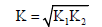 (6)
(6)
 (7)
(7)
 (8)
(8)
Where Q is the discharge in m3/s, Y1 and Y2 are water depths of the river at section (1) and (2) respectively, H is energy head in m, V is velocity of flow in m/s, l is river length between two reaches in m, n is the roughness coefficient, A is wetted area in m2, Sf is energy slope, K is conveyance of the river and R is hydraulic radius in m.
River reaches roughness coefficient
Roughness coefficients represent the resistance to flows in channel beds. According to the united states geological survey water-supply paper 2339 guideline for selecting Manning's roughness coefficients of natural channels and floodplains, “the roughness value for floodplain channels and rivers may vary from 0.011 to 0.07” [14]. The roughness values of the river reaches are stated in Table 4.
| Reach Length(m) | 0-861 | 861-1,582 | 1,582-2,010 | 2,010-2,394 | 2,394-2,516 | 2,516-3,003 | 3,003-3,924 | 3,924-5,372 |
| Roughness | 0.02 | 0.03 | 0.025 | 0.02 | 0.025 | 0.02 | 0.03 | 0.04 |
Table 4: The river reaches average roughness coefficient.
River bed slopes
An understanding of how water flows is important for understanding how activities in the channel and watershed affect the flow. The amount of water passing at a point on a river within a time is a function of river bed roughness coefficient and slope [15]. The sampled Kessem River reaches average bed slopes are described in Table 5.
| Reach Name | Reach 01 | Reach 02 | Reach 03 | Reach 04 | Reach 05 | Reach 06 | Reach 07 | Reach 08 | Reach 09 | Reach 10 |
| Slope | 0.002 | 0.003 | 0.002 | 0.004 | 0.002 | 0.001 | 0.004 | 0.006 | 0.001 | 0.005 |
| Reach Name | Reach 11 | Reach 12 | Reach 13 | Reach 14 | Reach 15 | Reach 16 | Reach 17 | Reach 18 | Reach 19 | Reach 20 |
| Slope | 0.001 | 0.002 | 0.008 | 0.003 | 0.004 | 0.006 | 0.002 | 0.004 | 0.011 | 0.002 |
| Reach Name | Reach 21 | Reach 22 | Reach 23 | Reach 24 | Reach 25 | Reach 26 | Reach 27 | Reach 28 | Reach 29 | Reach 30 |
| Slope | 0.003 | 0.005 | 0.004 | 0.004 | 0.006 | 0.009 | 0.006 | 0.009 | 0.009 | 0.004 |
Table 5: Average slope of the river reaches.
Design flood and inflow hydrograph
The design flood of the reservoir for its corresponding return periods are computed using the united states soil conservation system method for determination of direct runoff from the monthly average rainfall data, area, slope and length of the catchment. The result is shown in Table 6 [7].
| Return Period (years) | 2 | 5 | 10 | 20 | 50 | 100 | 200 | 500 | 1,000 | 2,000 | 5,000 | 10,000 |
| Design Flood (m3/s) | 1,041 | 1,622 | 2,060 | 2,525 | 3,200 | 3,765 | 4,385 | 5,300 | 6,072 | 6,921 | 8,177 | 9,237 |
Table 6: Design flood corresponding to various return periods.
Design discharge of the river nodes
The study is conducted by means of the river bed character parameters. They have different combinations. These are minimum, average and maximum slope each recombining with minimum, average, and maximum roughness coefficient. Thus, nine slope and roughness coefficient combinations have been synthesized for 5.4 km sampled river length. The design discharges are obtained by using the combined river bed characters, the traced initial river discharge, the inflow hydrograph at the entrance of the dam reservoir, kinematic wave distributed flow routing model and grid point method.
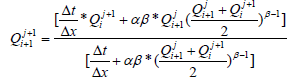
The solution of the kinematic wave equations specifies the distribution of the flow as a function of distance (x) along the channel and time (t). The solution for discharge at specified time Q(x,t) requires knowledge of the initial condition discharge Q(x,0) or the value of the flow along the channel at the beginning of the simulation, the boundary condition Q(0,t) and the inflow hygrograph at the upstream end of the channel. The objective is to determine the outflow hydrograph at the downstream end of the channel, Q(L,t), as a function of the inflow hydrograph, any lateral flow occurring along the sides of the channel, and the dynamics of flow in the channel as expressed by the kinematic wave equations. In the study, the distributed flow routing model helps to determine the design flood at each cross-section of the river using both the river initial discharge and inflow design flood. However, in the computation, the upstream river inflow discharges are not known. The only obtained data are the river outflow design floods which discharge to the reservoir. Therefore, the river inflow hydrographs are computed by the kinematic wave distributed model of equation (9) and backward numerical solution of trial and error principles [12].
 (9)
(9)
Qji+1 in equation (10) is calculated from the known values of Qj+1i+1 and Qj+1i by trial and error approach.
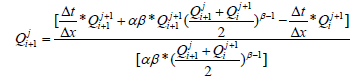 (10)
(10)
Then computed Qj i+1 value are the flood discharge at the different cross-section of the river. The base time of the inflow hydrograph of the dam reservoir was 48 hours. The inflow design flood at the reservoir entrance is 9,237.8 m3/s and it occurred at 24th hour’s base time. Whereas, its computed initial condition discharge is 3,778.9 m3/s and occurred both at 14.02th and 34.15th hours. These two base times have different contributions in design flood analysis. The later one is very vital because it comes once after the occurrence of the maximum design flood. Then, the design flood at the nodal cross section of the river is computed using 34.15th hours as initial time boundary condition and the entrance to the river as the upstream boundary condition. The reservoir inflow hydrograph is used as downstream boundary conditions. The values of change in length (Δx) in the computation simply took the distance between the river nodes and the change in time (Δt) is 15 minutes to get precise and better result. The computed maximum design flood which the river can carry at different cross section is shown in Table 7.
| Node | N0 | N1 | N2 | N3 | N4 | N5 | N6 | N7 | N8 | N9 | N10 |
| Flood | 9,237.80 | 9,238.90 | 9,240.10 | 9,241.10 | 9,241.70 | 9,242.20 | 9,243.00 | 9,243.60 | 9,243.90 | 9,243.70 | 9,245.50 |
| Node | N11 | N12 | N13 | N14 | N15 | N16 | N17 | N18 | N19 | N20 | N21 |
| Flood | 9,246.50 | 9,246.10 | 9,246.60 | 9,247.10 | 9,247.70 | 9,248.10 | 9,249.00 | 9,250.00 | 9,250.40 | 9,251.10 | 9,252.00 |
| Node | N22 | N23 | N24 | N25 | N26 | N27 | N28 | N29 | N30 | -- | -- |
| Flood | 9,253.70 | 9,253.20 | 9,254.10 | 9,255.30 | 9,256.30 | 9,256.70 | 9,257.30 | 9,258.10 | 9,259.20 | -- | -- |
Table 7: Design flood (m3/s) at different nodes of the river.
River bed character analysis
The major concern of the study is to know the amount of flood in a river that can be happened in the downstream structure by relating different riverbed parameters. The two most common channel characters are bed slope and roughness. The design flood of the river reaches is computed first by the natural ground condition. Then, the study has shown the flood change amount at the reservoir entrance just using the nine different bed character combinations, the upstream river inlet design flood, and equation (9). As it has been observed in Table 6, the maximum design flood at the river inlet is 9,259.20 m3/s. This indicates that the maximum upstream river design flood of 9,259.2 m3/s produced a 9,237.8 m3/s design flood at the dam reservoir in the existing river system. The river inlet design flood is the analysis reference rate. The analysis is done for all of the nine river character combination parameters.
The minimum roughness coefficient is either the least value among the existing morphology of the river or the recommended by intellectuals [14]. Therefore, the minimum roughness coefficient is the lowest value for the selected river sample (i.e., 0.02). Similarly, the minimum river slope is the least slope among the slope of the existing river system (i.e., 0.001). The average roughness coefficient and slope of the river are the weighted average values in the existing river (i.e., 0.029 and 0.005) respectively. The maximum roughness coefficient and slope are also the values which are recommended by researches for floodplain Rivers [14,15]. Kessem River is a floodplain river and the maximum recommended roughness and slope value are 0.07 and 0.009 respectively. Then, the analysis was done based on these roughness and slope combination values along with the river inlet design flood.
Result and Discussion
The river channel character combinations have produced results as per their groupings. Hence, the flood response at the inlet to the reservoir is different for different riverbed character arrangements. When the 9,259.20 m3/s flood at the river entrance flows through its sampled length of the proposed character combinations, the flood at the inlet of the reservoir has become different as shown in Table 8. The design flood at the entrance of the upstream river has produced a portion of both flood increment and decrement at the reservoir inlet for different character combinations when compared with its design flood for natural river morphology. As shown in Table 9, a group of the character modifications has been created flood reduction when compared to the natural river system at the reservoir inlet. The others have produced flood increment. Therefore; minimum slope and average roughness coefficient, minimum slope and maximum roughness coefficient, and average slope and maximum roughness coefficient are grouped on flood reduction side and kept bold at Table 9. The remaining i.e., average slope and minimum roughness coefficient, average slope & average roughness coefficient, maximum slope and minimum roughness coefficient, maximum slope and average roughness coefficient, maximum slope and maximum roughness coefficient are grouped on flood increment side and put in the bracket at Table 9.
| Character's Combination | Proposed Slope | |||
|---|---|---|---|---|
| Minimum | Average | Maximum | ||
| Proposed Roughness Coefficient |
Minimum | 9,240.10 | 9,242.00 | 9,240.00 |
| Average | 9,236.00 | 9,241.80 | 9,238.00 | |
| Maximum | 9,232.00 | 9,234.00 | 9,238.50 | |
Table 8: Flood result at inlet to the reservoir for different river bed character combinations (m3/s).
According to the result of the research, the second grouped river channel character modifications have flood hustle behaviour because these combined characters have increased the flood magnitude. Comparatively, the first grouped combinations have the flood retarded characteristics since they retarded the flood on the downstream structures.
As per the result of Table 9, the minimum slope and maximum roughness coefficient, and average slope and maximum roughness coefficient combinations have produced large flood retarded impact among the whole combinations and average slope and minimum roughness coefficient, and average slope and average roughness coefficient have also produced large flood speed up result at downstream hydraulic structures. As it revealed in the result, the river bed characteristics (slope and roughness) have boundless impact for speed up and retard the upstream flood on the river and produces flood increment and decrement respectively. The flood magnitudes of the reservoir inlet after the combinations of these measures are presented and explained in Table 8. The analysis has been carried out only for the 5.4 km sampled river length and that is why the value of flood difference amount is small. The results also showed that river bed channel characters have impacts and are vital in the flood study, evaluation and computation. There is a relationship between the time at which the flood occurs and its magnitude. According to this relationship, the 9,237.8 m3/s flood occurrence at the entrance to the dam reservoir is at 25.8 hr of the total 50.5 hr base time. The volume of water that will be added and reduced to the reservoir is determined based on the time and discharge of the produced excess flood hydrograph. The excess flood hydrograph has an equation of Q=−38.79t2 + 1,978t – 15,913 where Q in m3/s and t is in hrs. The equation was developed by using the nine character combinations produced flood hydrograph and their time of occurrence. Therefore, this volume of water indicates, the amount of water could be retard or speed up from entering to the reservoir due to flood if the the river channel character combinations are on the ground.
| Characters' Combination | Proposed Slope | |||
|---|---|---|---|---|
| Minimum | Average | Maximum | ||
| Proposed Roughness Coefficient |
Minimum | (2.30) | (4.20) | (2.20) |
| Average | 1.80 | (4.00) | (0.20) | |
| Maximum | 5.80 | 3.80 | (0.70) | |
Table 9: Reservoir inlet flood change for different river bed character combinations with its natural morphology (m3/s).
Conclusion
The design flood for a particular structure can be designed based on hydrologic methods and its parameters found in the upstream catchment. Designers mostly emphasized the hydrologic portion of the flood estimation. But, as researches revealed the hydraulic characteristics of the river (slope and roughness) have their impact on speed up and retard the flood on the structure. This kind of situations can be managed by assessing the river bed characteristics of the main watercourse of the upstream river and consider it in flood attenuation on the structure. The study has taken different riverbed characteristics modification, if so. There have been nine river character combinations in the computation. Among these combinations, the minimum and average slope along with each combining with maximum roughness coefficient combination modifications have produced flood retarded results. Whereas, average slope and minimum roughness coefficient, and average slope and average roughness coefficient have also produced large flood speed up result at downstream hydraulic structures. The researcher concludes by recommending and conducting further modelling studies of the impact of river bed combinations on the effect of sedimentation and scouring of the river by taking different flood estimation methods.
References
- Federal Disaster Prevention and Preparedness Agency (2006) Joint Government and Humanitarian Partners Flash Appeal for the 2006 Flood Disaster in Ethiopia, Addis Ababa, Ethiopia.
- Raghunath HM (2006) Hydrology: principles, analysis, design (2nd edn) New Age International Publisher, New Delhi, India.
- Roy S, Mistri B (2013) Estimation of peak flood discharge for an ungauged river: A case study of the Kunur River, West Bengal. Geography Journal pp: 1-11.
- Chen YC (2013) Flood discharge measurement of a mountain river-Nanshih River in Taiwan. Hydrol Earth Syst. Sci 17: 1951–1962.
- Buda AR, Kleinman PJA, Srinivasan MS, Bryant RB, Feyereisen GW (2009) Factors influencing surface runoff generation from two agricultural hill slopes in central Pennsylvania. Hydrol Process 23: 1295–1312.
- Szabo B, Szabo J (2017) Infiltration and runoff measurements on arable land with different slopes and rainfall intensities 4: 153-156.
- Water Works Design Supervision Enterprise (2006) Hydrologic design report of Kessem Kebena Dam and Irrigation Project, Addis Ababa, Ethiopia.
- Paulose S (1989) Establishing water release rules for Koka reservoir for wet seasons. Graduating paper, Addis Ababa University, Ethiopia.
- Rosgen DL (1994) A classification of natural rivers. Wild land Hydrology 22: 169-199.
- Yen BC (1995) Hydraulics and effectiveness of levees for flood control, hydro metrology, impacts and management of extreme floods, Perugia, Italy.
- Ward A, Jessica L, Ambrosio D, Witter J (2008) Channel-forming discharges: The Ohio State University Department of Food, Agricultural, and Bio- logical Engineering and the Ohio NEMO Program.
- Â Chow VT, Maldment DR, Mays LW (1988) Applied Hydrology, McGraw Hill Companies, New York, USA.
- Smithers JC (2012) Methods for design flood estimation in South Africa. Hydrology 38: 4.
- Arcement GJ, Schneider VR (1989) Guide for selecting manning’s roughness coefficients for natural channels and flood plains. United States Geological Survey Water-supply p: 2339.
- Chow VT (1959) Open-channel hydraulics. McGraw- Hill Book, New York, USA. p: 680.
Citation: Shumie MC (2018) River Slope and Roughness Impact on Downstream Hydraulic Structures. J Earth Sci Clim Change 9: 500. DOI: 10.4172/2157-7617.1000500
Copyright: © 2018 Shumie MC. This is an open-access article distributed under the terms of the Creative Commons Attribution License, which permits unrestricted use, distribution, and reproduction in any medium, provided the original author and source are credited.
Select your language of interest to view the total content in your interested language
Share This Article
Recommended Journals
Open Access Journals
Article Tools
Article Usage
- Total views: 4678
- [From(publication date): 0-2018 - Nov 23, 2025]
- Breakdown by view type
- HTML page views: 3758
- PDF downloads: 920