Role of Indian fluxes in the Intraseasonal 10-30 Days Variability of the African Monsoon
Received: 29-Aug-2018 / Accepted Date: 10-Oct-2018 / Published Date: 29-Oct-2018 DOI: 10.4172/2157-7617.1000495
Keywords: Monsoon; Intra-seasonal; Sahel; Indian; Water-vapor; Flux
Introduction
West Africa is one of the poorest regions in the world. Its climate variability strongly influences its development and its populations survival. They live mainly on agricultural production, which is the major component of the regional economy. The African monsoon is a climatic phenomenon of the boreal summer which represents rainy season for these populations. It has high intraseasonal variability and marked daily and seasonal cycles. It also plays an important role in the global climate system and is influenced by other climate systems through teleconnections. Indeed these studies [1-5] think that fluctuations (active/pause) of the Indian monsoon influence the African monsoon through atmospheric teleconnections. This influence is transmitted by Rossby cyclonic circulation propagating westward over North Africa with an average time of about 15-20 days between an active phase in India and Africa.
On the intraseasonal scale, the ITCZ activity can be modulated by planetary waves like the Kelvin wave, the Rossby wave or the Madden- Julian Oscillation (MJO). These waves (Kelvin, Rossby, Madden-Julian Oscillation) explain a significant part of the tropical atmosphere variability at synoptic (2 to 10 days) and intraseasonal (10 to 60 days) scales. Model simulations of Flaounas et al. [4] suggest that large-scale dynamics, extending beyond West Africa, control monsoon onset and timing. The appearance may be related to the Indian monsoon [4,6]. The convection associated in the north of 15°N forces a westward propagating Rossby wave which reaches West Africa about 7 to 15 days after the transition of convective waves in the Sahel.
The impact and the role of Indian monsoon on dynamics over West Africa were established through the Tropical Easterly Jet (TEJ) and intraseasonal oscillations. The simulations of Mohino et al. [7] show that 15 to 20 days after the maximum (minimum) convection in Indian Ocean, there is a significant reduction (increase) in convection happening in West Africa. This phenomenon and the impact of the MJO on convection in the Sahel are due to the presence of equatorial Rossby wave propagating in the East-West direction in addition to the MJO signal that spreads from West to East. This assumption is consistent with the work of Lavender and Matthews [2] and it ties together African and Indian monsoons [1]. These fluctuations modulate the wind regime and the transport of moisture [8,9] in the Sahel. Rossby waves propagating westward seem to be the most important for West Africa than other waves [2,5] and [3]. Intra-seasonal variability peaks in two distinct bands (10-30 days and 30-90 days). The first band is the most developed in the Sahel area. The variance is maximized approximatively after 15 days [9,10] so that it can be part of the quasi-biweekly convection zonal dipole identified by Mounier et al. [11]. For Janicot [12], intraseasonal variability of rainfall in African and Indian monsoon is a sporadic signal with more variance in two times intervals (10-25 days and 25- 60 days) supporting results [10]. In India, disturbances at these time scales of the monsoon are embodied by dry and wet periods extension. These periods often last 2 to 3 weeks. They lead to long periods of above normal rainfalls (monsoon active phase), followed by long periods of below normal rainfalls. Over India, Goswami, Zhan et al. [13,14] as well as Goswami and Chakraborty [15] found two intraseasonal modes of variability (10-20 days and 30-60 days) for water vapor in the high troposphere and Indian monsoon. The 10-20 days wave spreads westward towards the Arabian Sea.
This study deals with the contribution of Easterly air mass fluxes to intraseasonal variability of the West African Monsoon. Do the 500-300 hPa moisture fluxes from Indian monsoon drive an oscillating signal in the intraseasonal band? It is the signal that would impact the dynamic of African Monsoon. Thus, thanks to East-West transport with altitudes corresponding to 500-300 hPa, one studies the role played by Indian monsoon fluxes in water intake and variability in the 10-30 days band of the steam column over the Sahel.
Data and Methodology
OLR data
These are data from polar orbit satellites of the National Oceanic and Atmospheric Administration (NOAA) Television and Infrared Observation Satellite (TIROS) which, since 1974, have made 2 OLR (Outgoing Longwave Radiation) records per day at the top of the atmosphere with the resolution of 2.5° × 2.5°. Based on these data, the CDC (Climate Diagnostic Center) produces interpolated daily series of OLR [16] which are used in this work over the 1998-2008 period.
Reanalysis of ECMWF (European Center for Medium-Range Weather Forecasts)
ECMWF (Era Interim) daily reanalysis from 1st June 1998 to 30th September 2008 are used on a square mesh of 2.5° as well as pressure levels between 1000 and 300 hPa. Parameters used for this study are zonal and southern winds, relative moisture, vorticity. They provide a suitable spatial resolution for the study of phenomena in the 10-30 days band. They were used to calculate water vapor fluxes above 500 hPa [17].
Fluxes calculation methodology and study area
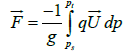
In order to study and analyze moisture transfer between Indian monsoon area and Sahelian monsoon, water vapor flux F (equation 1) was calculated at 500 hPa-300 hPa from specific moisture fields, zonal and southern winds of ECMWF (Era Interim) data over the 1998-2008 period.
 (1)
(1)
 : Water vapor flux [in kg. (m.s)], Ps, Pt: Pressure at 500 hPa and 300 hPa respectively, q: Specific moisture,
 : Horizontal wind vector between chosen pressure level, g: Gravitational acceleration.
Figure 1 represents JJAS averages over the 1998-2008 period of horizontal moisture flux (vector) superimposed on relative moisture (contour). It describes the study area which extends between latitudes 10-30°N and longitudes 20°W-90°E. It shows, in these latitudes, the existence of three different areas by their Easterly component of the flux and the moisture content (Figure 1).

Figure 1: Moisture flux (vector) and relative moisture (contour) at average 500-300 hPa over the period June 1998 to September 2008 from ECMWF reanalysis.
A North Indian area (15-30°N and 70-90°E), a Sahelian area (10-20°N and 10°W-30°E) and an area that covers the Arabian Peninsula and the Arabian Sea (10-20°N and 45-60°E). The Sahelian monsoon area shows Easterly fluxes while over the Arabian area there are Northeasterly fluxes that extend and connect them with those from India.
Results And Discussion
Dominant variability modes in the 10-30 days band
The study area (10-30°N and 30°W-90°E) is characterized by wave traversal in the intraseasonal band during monsoon period in India and West Africa. These waves modulate convection with wet and dry phases which follow each other throughout monsoons. The first five EOFs (Empirical Orthogonal Function) of the 500-300 hPa zonal flux filtered in time and space isolate variations related to westward propagation waves in the 10-30 days band (Figure 2). These first five EOFs identify spatial modes of 500-300 hPa zonal fluxes variability in the region extending from India to the Atlantic. They indicate propagating waves westward carried by 500-300 hPa moisture fluxes affecting the area.

Figure 2: The first five EOFs of moisture flux 500-300 hPa above 10-30°N and 30°W to 90°E covering India, Arabia and the Sahel. Data were filtered in the 10-30 days band with a spatio-temporal filter promoting the propagation of Easterly waves.
The variance percentages and values associated with the different modes over the 10-30°N and 30°O-90°E region are mentioned in Table 1. The first two modes express a total of 29.8% of the variance of the 500- 300 hPa zonal moisture flux in this region. They have a wave structure starting from the Indian monsoon area. These two modes represent the same wave at different phases of its evolution. They show an energy peak at 12.5 and 17 days. The first with an expressed percentage variance of 15.8% describes a wave in which the 500-300 hPa Easterly moisture fluxes and which is in India whose center is at 22°N and 78°E. It extends to the Arabian Sea in a Southwest direction and contrasts with two waves conducting 500-300 hPa Westerly fluxes; one is centered at 23°N and 45°E in Arabia and the other is centered at 10°N in Southern India. Values of 500-300 hPa fluxes in these disturbances are at their maximum in their centers and decrease as they move away from them. The second mode highlights the wave transporting 500-300 hPa Easterly fluxes whose center is located at 23°N and 62°E between India and Arabia. It still has a Southwest direction and extends to 10°W in West Africa at 10°N. It covers a length of about 10767 Km and contrasts with a disturbance of 500-300 hPa Westerly flux having the same orientation which is centered in Southern India. The third mode of the 500-300 hPa zonal moisture flux represents a wave phenomenon in which fluxes are from East. It extends from East Africa to the Indian coast, between 30°E and 70°E, or about 4440 km, and its center is located at 12°N. A similar wave centered at 20°N over the Sahara is observed in this mode. The first wave is between two disturbances carrying 500-300 hPa fluxes, one is in West Africa between 10°W and 30°E centered at 12°N and the other is centered at 15°N Southeast of India in the Pacific. The fourth mode shows between 10 and 20°N two disturbances conveying 500-300 hPa Easterly zonal fluxes, one is in West Africa with 500-300 hPa low intensity Easterly fluxes centered at 12°N. Another one whose center is located at 17°N in the Arabian Sea carrying 500-300 hPa Easterly fluxes with greater intensities. Among these waves, there is one centered at 13- 14°N carrying 500-300 hPa Westerly zonal fluxes which are identified over the Sahel. These waves are approximately 5550 km long. The first five modes all have one or more energy peaks in the 10-20 days band and waves at horizontal scales between 4000 and 11000 km. Driven by convective feedback, these waves have a Rossby spatial wave structure that propagates westward.
| Flux | Variables | EOF1 | EOF2 | EOF3 | EOF4 | EOF5 | Total |
|---|---|---|---|---|---|---|---|
| Flux (%) | Var (%) | 15.8 | 14 | 7.2 | 6.65 | 5.7 | 49.35 |
Table 1: EOFs percentage variance for 500-300 hPa flux in the study area (10-30°N, 30°O-90°E).
Modes demonstration in India, Sahel and Arabia
The first mode for 500-300 hPa fluxes over India reveals a homogeneous Easterly flux from 20°N which remains stable up to 30°N (Figure 3a). This indicates air mass divergence over India. Outside the Indian area, circulation has a Northeast component and is centered around 15°N in Arabia (EOF1 over Arabia, Figure 3b). Thus the 500- 300 hPa fluxes take the direction of Africa where one can note with the EOF1 an easterly circulation is stable (10-20°N, 10°O-30°E, Figure 3c).

Figure 3: a) First EOF of 500-300 hPa unfiltered zonal moisture flux in India; b) First EOF of 500-300 hPa unfiltered zonal moisture flux in Arabia; c) First EOF of 500-300 hPa unfiltered zonal moisture flux in the Sahel. EOFs are calculated on the basis of daily data from 1998 to 2008.
Above the three regions considered in this work (India, Arabia and the Sahel), the first mode expresses respectively 34.4%, 42.1% and 19.4% of the total variance of the 500-300 hPa zonal moisture flux (Table 2). While the second mode expresses 24.8%, 32.5% and 16.4% above each region respectively.
| Flux | Variables | EOF1 | EOF2 | EOF3 | EOF4 | EOF5 | Total |
|---|---|---|---|---|---|---|---|
| India | Var (%) | 34.4 | 24.8 | 11 | 10 | 5.4 | 85.6 |
| Arabia | Var (%) | 42.1 | 32.5 | 9 | 6.5 | 4.2 | 94.3 |
| Sahel | Var (%) | 19.4 | 16.4 | 12.7 | 10.5 | 8.1 | 67.1 |
Table 2: EOFs variance percentage for the 500-300 hPa flux in India, Arabia and the Sahel.
These first two modes occur in the Sahelian region coinciding with strong convection in the active phases of Easterly fluxes and their energy spectra show significant peaks between 10 and 15 days. Covering a length around 10767 km, they are like Rossby waves since disturbances caused progress from East to West.
Annual cycle of intraseasonal variability
Disturbances from India to Africa transit through Arabia, which serves as place of exchange. (Figure 4) shows the time-latitude diagram of average daily relative moisture (between 500 and 300 hPa) from 1st 1998 to 1st October 2008 between 5°S and 20°N in Arabia (averaged over 45-60°E) and filtered over the 10-30 days band. It highlights the periodic fluctuations manifested by moist and slightly less moist sequences throughout the duration of these transfers. Moisture in this region reaches significant values above average and settles in the North of 10°N at the beginning of June coinciding with Easterly fluxes installation in India at the North of 20°N. In mid-June, when Easterly fluxes settle in India, moisture over Arabia begins to increase in alternating periods with a drop-in moisture until early July. From that moment, Easterly fluxes over the Sahel intensified with convection arrival. There is a moisture increase in Arabia where the intense phases show high moisture quantities. This high moisture over Arabia leaves room per period for a relative reduction in these quantities. This alternation continues until the end of August or early September when moisture quantity drops considerably.

Figure 4: Time latitude diagram from 1st May 1998 to 1st December 2008 averaged between (45-60°E) relative moisture anomalies (%) from ECMWF reanalysis. A lowpass filter was applied eliminating fluctuations of less than 15 days.
Oscillation modulation in the 10-30 days band
Figure 5 shows the time-longitude diagrams of the daily averages in the months of JJAS from 1998 to 2008, the OLR, the 300 hPa zonal wind, the 500-300 hPa zonal flux and the relative moisture between 500 and 300 hPa. They are averaged between 12 and 25°N and filtered over the 10-30 days band from 30°O to 100°E.

Figure 5: a) Time-longitude diagram of the OLR average from 1st June 1998 to 1st October 2008 and starting from 30°O to 100°E, also averaged between 12 and 25°N b) Time-longitude diagram of the 500 hPa-300 hPa zonal flux average from 1st June 1998 to 1st October 2008 and starting from 30°O to 100°E, also averaged between 12 and 25°N ; c) Time-longitude diagram of the average of zonal wind component at 300 hPa from 1st June 1998 to 1st October 2008 and starting from 30°O to 100°E, also averaged between 12 and 25°N; d) Time-longitude diagram of the average of relative moisture between 500 and 300 hPa from 1st June 1998 to 1st October 2008 and starting from 30°O to 100°E, also averaged between 12 and 25°N. These data are filtered out of the 10-30 days band.
OLR and relative moisture show quite similar alternation of intense and low activity throughout the season in India. This activity opposition is manifested for OLR by a negative anomaly (intense phase) and a positive anomaly (low activity). For relative moisture, an active phase corresponds to a positive anomaly and a negative anomaly corresponds to low activity. These OLR fluctuations and relative moisture fluctuations seem to describe a Westward signal found in West Africa. The 500-300 hPa zonal flux indicates, in India from mid-June, an Easterly circulation of air masses towards Africa which alternates with a Westerly circulation in the 10-30 days band.
For the Easterly circulation, fluxes values vary along their way. The 300 hPa zonal wind (identical to the 200 hPa zonal wind diagram) indicates the evolution phases of TEJ, which starts in the early days of the Indian monsoon at early June. It is also noted that OLR fluctuates more rapidly than other parameters in India and the Sahel.
The calculated Empirical Orthogonal Functions (EOF) are used to understand the relationship between these variations in 500-300 hPa flux and moisture in the 500-300 hPa layers and their interactions between India and the Sahel. The first five fluxes and relative moisture EOFs (Table 3) obtained in India (15-30°N, 70-90°E) and in the Sahel (10-20°N, 30°W-30°E) are given in Tables 3a and 3b. The total percentage of variance expressed by the first five modes in India is 85.6% and 85.5% respectively for fluxes and moisture over India. As for the Sahel, EOFs express a variance total of 67.1% for fluxes and 75.7% for relative moisture.
| Flux | Variables | EOF1 | EOF2 | EOF3 | EOF4 | EOF5 | Total |
|---|---|---|---|---|---|---|---|
| India | Pcvar (%) | 34.4 | 24.8 | 11 | 10 | 5.4 | 85.6 |
| Sahel | Pcvar (%) | 19.4 | 16.4 | 12.7 | 10.5 | 8.1 | 67.1 |
Table 3a: EOF values and variance percentage for the 500-300 hPa flux in India, Arabia and the Sahel.
| Moisture | Variables | EOF1 | EOF2 | EOF3 | EOF4 | EOF5 | Total |
|---|---|---|---|---|---|---|---|
| India | Pcvar (%) | 33.9 | 20.8 | 14.6 | 10.9 | 5.3 | 85.5 |
| Sahel | Pcvar (%) | 27.4 | 24.9 | 9.2 | 8.1 | 6.1 | 75.7 |
Table 3b: EOF values and variance percentage for the moisture values between 500-300 hPa in India, Arabia and the Sahel.
On the one hand, the evolutions of the temporal components associated with the first three EOF were analyzed between June and September 2003 of the 500-300 hPa flux (Figures 6a, 6b and 6c) and the relative humidity 500-300 hPa (Figures 7a, 7b and 7c) in the Sahel and India.
Figure 6: a) Time components associated with the first mode of daily zonal flux decomposition in EOF at 500-300 hPa filtered in the 10-30 days band of JJAS months in 2003 in the Sahel and in India; b) Time components associated with the second mode of daily zonal flux decomposition in EOF at 500-300 hPa filtered in the 10-30 days band of JJAS months in 2003 in the Sahel and in India; c) Time components associated with the third modes of daily zonal flux decomposition in EOF at 500-300 hPa filtered in the 10-30 days band of JJAS 2003 months in the Sahel and in India; d) Delayed correlations between time components associated with first (in black), second (in red) and third (in blue) modes of EOFs flux in India and in the Sahel.

Figure 7: a) Time components associated with the first mode of daily relative moisture decomposition in EOF at 500-300 hPa filtered in the 10-30 days band of JJAS months in 2003 in the Sahel and in India; b) Time components associated with the second mode of daily relative moisture decomposition in EOF at 500-300 hPa filtered in the 10-30 days band of JJAS months in 2003 in the Sahel and in India; c) Time components associated with the third modes of daily relative moisture decomposition in EOF at 500-300 hPa filtered in the 10-30 days band of JJAS 2003 months in the Sahel and in India ; d) Delayed correlations between time components associated with first (in black), second (in red) and third (in blue) modes of EOFs flux in India and in the Sahel.
On the other hand, the correlation co-efficients between temporal components, of the same EOF, in the Sahel and in India associated with the first three spatial modes of the flux 500-300 hPa (Figures 4 and 5) and the relative humidity (Figure 7d). These correlations are calculated by delaying flux and moisture in the Sahel compared flux and moisture in India. This delay includes the hypothesis of an oscillating signal shift in the 10-30 days band from India to the Sahel. The delay varies from 0 to 30 days between the time components in the Sahel and India. The potential links between first temporal components (black curve in Figures 6d and 7d), second temporal components (red curve in Figures 6d and 7d) and third temporal components (blue curve in Figures 6d and 7d) of fluxes and relative moisture over these regions are given by delayed correlations.
Thus a significant minimum of correlation equal to -0.6 is obtained and a maximum greater than +0.6 between the first components associated with EOF1 of the 500-300 hPa flux in India and the Sahel. The negative minimum (-0.6) is obtained when the 500-300 hPa flux component of the Sahel is postponed for 17 days behind that of India. And the maximum is higher than +0.6 when the 500-300 hPa flow component of the Sahel is 26 days behind that of India (Figure 6d, in black). Analysis of the correlations between the second components associated with the respective EOF2 of the 500-300 hPa flux over India and that over the Sahel also shows two correlation peaks of -0.5 and +0.5. The first (-0.5) corresponds to the Sahelian flux component delayed by 12 days and the second (+0.5) when it is delayed by 19 days (Figure 6d, in red).
The correlations between third components associated with the EOF3 of 500-300 hPa fluxes in India and the Sahel show the same correlation values as those of the first components, namely -0.6 and +0.6. The minimum (-0.6) is obtained when the Sahelian flux component is delayed by 9 days and the maximum (+0.6) when it is delayed by 16 days (Figure 6d, in blue). Considering relative moisture values between 500 and 300 hPa as a variable, correlations between the first three components (associated with the first three EOFs) of India and those of the Sahel are given in Figure 7d.
The correlation between the first components associated with EOF1 of 500-300 hPa relative moisture from India and the Sahel does not exceed 0.4 in absolute value (Figure 7d, in black). The correlation between the second components associated with EOF2 of 500-300 hPa relative moisture in India and the Sahel does not exceed 0.4 in absolute value (Figure 7d, in red). As for the correlation between the third components associated with the respective EOF3 of the 500-300 hPa relative moisture over India and that over the Sahel, it reveals two values +0.5 and -0.6 which must be taken into account (Figure 7d, in blue). The correlation peak at +0.5 is obtained when the third component associated with EOF3 of the Sahel relative moisture is postponed by 18 days later than that of India. While the minimum at -0.6 is obtained when the third component associated with the EOF3 of the Sahel relative moisture is delayed by 25 days on that of India relative moisture.
During JJAS months, on the 500-300 hPa layer, a moist belt connects India and Africa. This intertropical band defines two moist areas: the first located around India is much larger and the second located in West Africa are connected by a less humid intermediate zone located in Arabia. This link between the Sahel and Northern India (north of 15oN) is characterized by the transport over Arabia which begins between 15 and 20 June in our time frame (1998-2008). It coincides with the setting up of Indian monsoon at 20°N latitude, on 15-16 June on average (imd.gov.in). The starting point is a disturbance that starts around 90- 100°E between the Bay of Bengal and the Himalayan mountains where a boundary is visible between two circulations. A first anticyclonic circulation heading towards China and a second cyclonic circulation heading towards the Arabian Peninsula, this is in line with the results of Zhan et al. [14] as well as Goswami and Chakraborty [15].
These East to West air mass transport observed between India and the Sahel on the 500-300 hPa column modulate a varying signal in the intraseasonal band. Since the starting of the monsoon at the north of 20°N in India, these oscillations are perceptible through moisture fluxes and convection. During the fluctuation’s active phases, significant values of Easterly moisture flux and strong convection are observed.
Figure 8 shows the time sequence of the OLR dry convection composite and the time sequence of the 500-300 hPa moisture flux from t0-9 to t0+9 days in 3-day steps. Convective sequences are selected when the index of filtered OLR and 500 hPa zonal fluxes are less than -3/2 times their respective standard deviations in Arabia. The OLR (contour) and moisture flux (vector) values displayed in the figure are part of the filtered OLR signal and 500-300 hPa fluxes in the 10-15 days band.

Figure 8: Composite (1998-2008) of filtered OLR field (contour) and 500-300 hPa flux (vector) from t0-9 days to t0+9 days in 3-days steps. Convective sequences are selected when filtered OLR index and Easterly zonal flux index (negative) in Arabia over 10 to 15 days are at the lowest. They are less than -3/2 times the standard deviation of filtered OLR signal and Easterly flux.
The signal obtained from the filtered fields of OLR and 500-300 hPa flux reveals clear propagative structures in the 10-15 days bands from East to West. At t0+9 in Arabia, a maximum of convection is observed in the Sahel accompanied by 500-300 hPa fluxes. At t0 in Arabia, the convective signal is at its maximum level, fluxes are at their maximum and they are northeasterly. At the same time in India and in the Sahel, there is a minimal convection phase with maximum OLR and 500-300 hPa Westerly fluxes values. Between t0-9 and t0-6 in Arabia, convection is minimal, and fluxes are southwest. Currently in India, convection is at its maximum, with the lowest OLR values in India and 500-300 hPa fluxes are easterly.
The sequence shows a shift in disturbance from North 20°N in India to Southwest, with high convective activity and 500-300 hPa moisture fluxes. This wave follows the path described by moisture fluxes during the JJAS months and is positioned between 10°N and 20°N from Arabia. From there, it moves Westward. There is also a signal in the same band propagating westward which is more equatorial. This equatorial signal meets between Arabia and the Horn of Africa the signal described by the 500-300 hPa Easterly fluxes. This leads to the formation of a much larger wave in space in the dry phases and in the convective phases heading towards West Africa.
Figure 8 analyses show that in the region from India to the Atlantic Ocean, in the 10-15 days band. Any convective area is accompanied by a circulation of 500-300 hPa Easterly flux whereas there is circulation of Westerly fluxes at high troposphere in any non-convective area of the same region. Relative moisture advection in the same band reveals the same wavelength as that observed for OLR during the same period following the same path.
Influence of the Indian intraseasonal signal in the Sahel
During the months of JJAS, the large-scale dynamics ensure intraseasonal exchanges between India and the Sahel through TEJ and Walker circulation. The Easterly flux transport is centered around 25°N in India. However, between India and Eastern Arabia, it is oriented towards Southwest. These fluxes are reinforced as they arrive in the Arabian Peninsula and the Sea. This situation is probably due to meridional transport but also to the encounter of another Easterly wave (similar to an equatorial Rossby wave) at these latitudes (Figure 8). They emerge from this region of Arabia centered around 15°N and they take a westerly direction with a maximum of convection and moist air. Thus, by reaching the East of the Sahel, this flux can reach a force of 25 kg (m.s)-1.
The correspondence between the 500-300 hPa moisture column located between the North of 15°N in India and the one over the Sahel was studied on the basis of EOF delayed correlations carried out on the two regions (Figures 7 and 8). These correlations relating zonal flux and relative moisture anomalies on the 500-300 hPa column over India and the Sahel reveal links between days 24 and 25 variability and days 13-14-21 variability located between Arabia and the Sahel. Temporal components associated with the first EOF modes in India, in Arabia and in the Sahel (Figure 9) reveal a regular lag between convection in the Sahel and the one noted in the Arabian Peninsula. These air masses reach the Sahel after 14 or 16 days (Figure 4) over the 1998-2008 period. A comparative analysis of OLR and relative moisture values between 500 and 300 hPa over India and the Sahel (Figure 10) shows that by convection is highest in northern India by mid-June.

Figure 9: Time components associated with the first EOF modes of unfiltered OLR in India (in black), in Arabia (in red) and in the Sahel (in blue).

Figure 10: a) OLR anomalies in the Sahel (red) and India (black) from 1 June to 1 October over the period 1998-2008. They are normalized and filtered in the 10-30-days band. b) Likewise for values of relative moisture anomalies between 500 hPa and 300 hPa in the Sahel (in red) and in India (in black).
This corresponds to a decrease (minimum) in convection in the Sahel (Figure 10b) but also to a maximum of moisture over India and a minimum of moisture over the Sahel high troposphere (Figure 10b). From June to September, in the 10-30 days band, phases of convection increase in one of the areas coincide with a decrease in other areas whereas during this period, moisture variation between these two areas is less regular with either a phase evolution or a phase opposition.
Figure 11 shows, as in Figure 8, time sequence of the dry-convection composite of OLR and 500-300 hPa moisture flux unfiltered raw fields from t0-6 to t0+12 days in 3-days steps. The t0 and convective sequences before and after are selected when the filtered OLR index and 500 hPa zonal fluxes are less than their respective standard deviations in Arabia. OLR (contour) and moisture flux (vector) values displayed in the figure are part of the unfiltered OLR signal and 500-300 hPa fluxes. The signal obtained from the unfiltered raw fields of OLR and 500-300 hPa flux reveals an energy signal weaker than the one of filtered fields but the 10-15 days signal persists and displays an East to West propagation. It is highest between India and Arabia with quite clear propagative structures in the bands of 10-15 days from East to West. Between t0-6 and t0 the displacement of the convective phase is observed from India to Arabia over which Easterly fluxes in India and Northeasterly fluxes in Arabia. And between t0 and t0+3 in Arabia, the shift of dry sequence corresponding to the maximum OLR values in the Sahel is noted. Between t0+6 and t0+9 in Arabia, the shift of the convective sequence with minimum OLR values and 500-300 hPa Easterly fluxes in the Sahel is noted.

Figure 11: Composite (1998-2008) of unfiltered OLR field (contour) and 500-300 hPa flux (vector) from t0-6 days to t0+12 days in 3-day steps. Convective sequences are selected when filtered OLR index and Easterly zonal flux index (negative) in Arabia over 10 to 15 days are less than the standard deviation of the filtered OLR signal and Easterly flux.
Analysis of Figure 11 showing unfiltered raw fields of OLR and flux shows the same signal in the 10-15 days band propagating from India to the Sahel. It describes the same trajectory as the trajectory of average Easterly fluxes during the African and Indian monsoons. It is still noted that, with unfiltered fields, convective phases of the signal are accompanied by a 500-300 hPa Easterly flux circulation.
Conclusion
Moisture fluxes transport from India to the Sahel seems to play a role in intraseasonal variability. This is possible especially thanks to Easterly wave modulation such as Rossby waves in the 10-15 days band. It is quite interesting to note that disturbances accompanying convection in this band coincide with Easterly fluxes values between 500 and 300 hPa. In their opposite phases (pauses), Westerly fluxes values between 500 and 300 hPa are observed in the upper troposphere. The modulation in the 30-90 days band is planned to estimate the Madden-Julian Oscillations (MJO) component in the intraseasonal signal carried by 500-300 hPa fluxes. Preliminary results indicate significant band energy covering MJO on the 500-300 hPa flux signal in the Sahel.
Acknowledgments
We acknowledge the Centre d'excellence Africain (CEA) Mathématiques, Informatique et Technologies de 'Information et de la Communication (MITIC) for hosting this research. We acknowledge also Mr. Adams Aly Diomand for translating this work. We acknowledge also the European Centre for Medium-Range Weather Forecasts (ECMWF) for providing ERA-Interim reanalysis ECMWF; The National Oceanic and Atmospheric Administration (NOAA) for providing OLR data.
References
- Janicot S, Mounier F, Hall N, Leroux S, Sultan B, et al. (2009) The West African monsoon dynamics. Part IV: Analysis of 25-90-day variability of convection and the role of the Indian monsoon J Climate 22: 1541–1565.
- Lavender SL, Matthews AJ (2009) Response of the West African monsoon to the Madden-Julian Oscillation. J Climate 11:Â 4097-4116.
- Ventrice MJ, Thorncroft CD, Roundy PE (2011) The Madden-Julian oscillation’s influence on African easterly waves and downstream tropical cyclogenesis. Mon Weather Rev 139: 2704–2722.
- Flaounas E, Janicot S, Bastin S, Roca R, Mohino E (2011) The role of the Indian monsoon onset in the West African monsoon onset: observations and AGCM nudged simulations. Clim Dyn 38: 965-983.
- Mohino E, Janicot S, Douville H, Li LZX (2012) Impact of the Indian part of the summer MJO on West  Africa using nudged climate simulations. Clim Dyn 38: 2319-2334.
- Camberlin P, Fontaine B, Louvet S, Oettli P, Valimba P (2010) Climate adjustments over Africa accompanying  the Indian monsoon onset. J Clim 23: 2047–2064.
- Mohino E, RodrÃguez-Fonseca B, Mechoso CR, Gervois S, Ruti P, et al. (2011) Impacts of the tropical Pacific/Indian Oceans on the seasonal cycle of the West African monsoon. J. Clim 24: 3878–3891.
- Gu G, Adler RF, Huffman GJ, Curtis S (2004) African Easterly waves and their association with precipitation. J GEOPHYS RES 9: 12.
- Janicot S, Mounier F, Gervois S, Sultan B, Kiladis G (2010) The dynamics of the West African monsoon. Part V: The role of convectively coupled equatorial Rossby waves. J. Clim 23: 4005-4024.
- Janicot S, Sultan B (2001) Intra-seasonal modulation of convection in the West African monsoon. Geophys Res Lett 28: 523–526.
- Mounier F, Janicot S, Kiladis GN (2008) The west African monsoon dynamics. Part III: The quasi-biweekly zonal dipole. J Clim 21: 1911-1928.
- Janicot S (2009) A comparison of Indian and African monsoon variability at different time scales. CR Geosci 341: 575-590.
- Goswami BN (1998) Inter-annual variation of Indian summer monsoon in a GCM: Externalconditions versus internal feedbacks. J Clim 11: 501–522.
- Zhan R, Li J, Gettelman A (2006) Intra-seasonal variations of upper tropospheric water vapor in Asian monsoon region, Atmos. Chem Phys Discuss 6: 8069-8095.
- Goswami BN, Chakraborty S (2016) Dynamics of the Indian monsoon climate. Oxford Research Encyclopedia, Climate Dynamics.
- Liebmann B, Smith CA (1996) Description of a complete (interpolated) outgoing long-wave radiation dataset. B Am Meteorol Soc 77: 1275-1277.
- Â Dee DP, Uppala SM, Simmons AJ, Berrisford P, Poli P, et al. (2011) The ERA-Interim reanalysis: Configuration and performance of the data assimilation system. QJR Meteorol Soc 137: 553-597.
Citation: Abdoulaye SY, Diop B, Farota AK, Sarr D, Dia A, et al. (2018) Role of Indian fluxes in the Intraseasonal 10-30 Days Variability of the African Monsoon. J Earth Sci Clim Change 9: 495. DOI: 10.4172/2157-7617.1000495
Copyright: © 2018 Abdoulaye SY, et al. This is an open-access article distributed under the terms of the Creative Commons Attribution License, which permits unrestricted use, distribution, and reproduction in any medium, provided the original author and source are credited.
Select your language of interest to view the total content in your interested language
Share This Article
Recommended Journals
Open Access Journals
Article Tools
Article Usage
- Total views: 4656
- [From(publication date): 0-2018 - Dec 20, 2025]
- Breakdown by view type
- HTML page views: 3763
- PDF downloads: 893