Seasonal Variations in Daily Mortality Associated with Exposure to Particulates, Nitrogen Dioxide and Ozone in Campo Grande, Brazil, from 2005 to 2020
Received: 02-Jul-2022 / Manuscript No. jrm-22-54654 / Editor assigned: 04-Jul-2022 / PreQC No. jrm-22-54654 (PQ) / Reviewed: 18-Jul-2022 / QC No. jrm-22- 54654 / Revised: 21-Jul-2022 / Manuscript No. jrm-22-54654 (R) / Published Date: 28-Jul-2022 DOI: 10.4172/jrm.1000134
Abstract
Introduction: The greater life expectancy in the country and the drop in mortality bring challenges to social programs for the care of the population, especially in the area of health. Objective: To investigate short-term effects of air pollution, climate variability on respiratory morbidity and mortality from 2005 to 2020.
Methods: The study was carried out in the city of Campo Grande, MS, Brazil. Daily counts of hospital admissions from 2005 to 2020 were analyzed in relation to daily variations in atmospheric pollutants (NO2, O3) from the Aurea satellite column, OMI sensor. Poisson regression in generalized additive models was used for analysis. The models were adjusted for the effects of temporal trend, seasonality, meteorological factors and autocorrelation.
Results: There was, in the period, an increasing trend in mortality rates and hospital admissions, with an increase in the proportion of deaths from respiratory diseases in relation to other causes.
Conclusions: Respiratory diseases are worrying causes of hospitalization and death in the population. Prevention and care actions for these causes, as well as further etiological investigation, should be prioritized in the current epidemiological context of health in Brazil. The results found are consistent with studies that point to an association between short-term variations in air pollutants and the increase in morbidity and mortality in large urban centers.
Keywords: Mortality; Respiratory diseases; Time series; Admissions;Ecological studies
Keywords
Mortality; Respiratory diseases; Time series; Admissions; Ecological studies
Introduction
In the city of Campo Grande, state of Mato Grosso do Sul (MS), Brazil, studies have shown that the levels of pollution are harmful to the health of the population. Emphasis on the associations between levels of air pollutants and deaths, hospitalizations for respiratory diseases and deaths. In Brazil, as in many other countries, there are air quality standards, which in turn establish tolerance limits, to ensure that the population has quality of life [1]. As a response to pollutionrelated problems, the Ministry of Health (MS), through the General Coordination of Surveillance in Environmental Health, structured, as of 2001, the Surveillance Program in Environmental Health Related to Air Quality (Vigiar).
Pollutants are represented by Total Suspended Particles (PTS), Inhalable Particles (PM10), Sulfur Dioxide (SO2), Nitrogen Dioxide (NO2), Ozone (O3) and Carbon Dioxide (CO2) and the climatic variables: temperature of air (TA), relative humidity (RH) and precipitation (PREC) [2]. This study addresses a current issue that affects a significant part of the population, with the assumption that everyone in society has the responsibility to contribute to the process of change towards a new pattern of behavior towards natural resources, which are essential elements of nature for the survival of the human being. The topic under study is relevant to today's society, as this approach allows for a deep reflection on the effects of pollutants on people's health, promoting changes in behavior and maturing on the topic within society in general.
Thus, this study goal to investigate the relationship between pollutants and hospitalizations for respiratory diseases and deaths through statistical analysis, as well as the identification of the most relevant variables in the time series.
Materials and Methods
Meteorological data between 2005 and 2020 were obtained from the Water Resources Monitoring Center (CEMTEC-MS). The meteorological dataset consisted of monthly data on minimum and maximum temperature (Tmin and Tmax, ºC), relative humidity (RH, %) and precipitation (Prec, mm) for the municipality of Campo Grande, MS-Brazil.
Statistical analysis
The modeling strategy was based on a central model with all known information (trend, seasonality, weekdays, holidays, and weather conditions), to explain the number of deaths, hospitalizations for respiratory diseases, concentration of pollutants and climatic variables [3].
The choice of variables and co-variables to compose the model was based on tests and diagnoses at each stage of the modeling process. Diagnoses were based on residual analysis and the Akaike criterion (AIC).
Exploratory data analysis was based on the decomposition of time series and autocorrelation graphs. The outcome variable was the number of cases of death and the independent variables were hospital admissions for respiratory diseases, monthly mean Prec, UR, hot spots and monthly Tmin and Tmax and concentration of O3 and NO2. After exploratory analysis, cut-off points for mean temperature were evaluated by generalized additive models.
General additive model
The daily number of medical visits represents a counting process and the generalized additive model (GAM), with Poisson distribution [4], was the statistical tool used in the study to estimate the shape of the curve of the relationship between health outcome and air pollution.
Let {Υt} ≡ {Υt} t∈Z be a counting series, that is, yt ∈ {0, 1...}. The conditional distribution of Υt, given the past Ft-1 that contains all information available up to time t - 1 is denoted by:
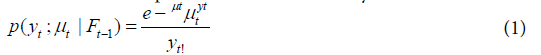
Where, μt represents the expected (average) value of Yt. Thus, given a sample Y... Yn, composed of “n” mutually conditionally independent random variables, belonging to “Yt”, the conditional log-likelihood function is given by:
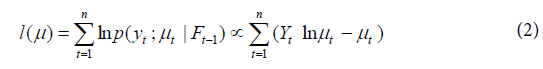
Where the vector μ = (μ1... μn) depends on the parameters and the process {Yt}. Let Xt = [X1t,..., Xpt]T be the vector of p-dimensional covariates at time t, where T denotes the transpose, which may include past values of Yt and other auxiliary information such as pollutants and confounders (trend, seasonality and meteorological variables, among others) [5]. In this study, the sequence X1t... Xqt denotes the concentrations of the pollutants NO2, O3, therefore, q = 2, and X (q+1) t... Xpt indicates the confounding variables at time t, (p > q).
The relationship between the vector is given by:

Where (β0, β), with β = (β1… βq) T is the vector of the coefficients to be estimated (βj is the j-th covariate coefficient) and fj is the smoothing function for the j-th variable of confusion. Furthermore, β0 indicates the intercept of the curve and is associated with X0t= 1 for all t. The entire modeling process was carried out in the R environment software (http://www.r-project.org) with the ARES package [6].
The relative risk (RR) of a polluting covariate Xi, j = 1... q Is given as the relative variation in the expected count of respiratory disease events by the ξ unit variation in the covariate while keeping the other covariates fixed. According to BAXTER et al. 1997, formula (8), the RR is given by:
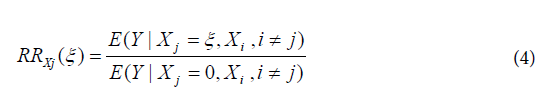
For the Poisson regression, the RR does not depend on the values xi, i ≠ j of the other covariates and can be expressed as:

For the MAG model with marginal Poisson distribution, the RR and its approximate confidence interval (CI), at a significance level α, of a covariate Xj, j = 1...q, is estimated as follows:
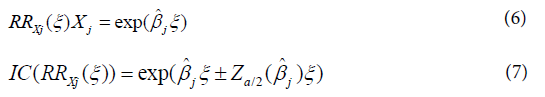
βj is the estimated coefficient associated with the pollutant Xj in a study with standard error βj is and zα/2 is the α/2 quantile of the standard normal distribution [7]. At a significance level α, the hypothesis to be tested is defined as H0: RRxj = 1 against H0: RRxj > 1, where RRxj = RRxj (1), that is, RR of the unit variation in Xj. The rejection of H0 statistically implies that the respective pollutant has a significant adverse effect on health.

The effect of climatic variables on the number of reported cases was evaluated using generalized linear models with a logarithmic link function for Poisson and negative binomial distribution. Time series are characterized by a sequence of data obtained at equal time intervals. The data used here refer to months, which do not have the same number of days; therefore, the compensation was used in multiplying the population by the number of days in the month [8]. Model fit was assessed by autocorrelation and residual normality test.
Statistical analysis consisted of calculating measures of position and dispersion of variables (monthly and annually), drawing up line graphs, filtering moving averages, principal component analysis (ACP), cluster analysis and Pearson's correlation coefficient.
PCA is a multivariate data reduction technique in which the main objective is the construction of a linear combination of the original variables, generating new orthogonal components that represent and capture the variability of the original set of variables. This method was used with the objective of reducing the number of variables, generating new components by capturing the dependencies between the variables, thus seeking a natural relationship [9], with analysis of independence or dependence, between the variables.
Furthermore, PCA consists of calculating the eigenvalues and respective eigenvectors of a matrix of variances and co variances or a matrix of correlation coefficients between variables. The latter matrix being more suitable for the present study, as the unequal measurement units and variance present a great difference between the variable. Its application occurs through a linear transformation of "m" original variables into "n" new variables, so that the first new variable (1st component) is responsible for the greatest variation in the dataset, and so on, until that all the variation of the set has been captured.
Data were collected from hospital admissions for respiratory diseases, provided by the Information Technology Department of the Unified Health System (DATASUS), for the period 2005 to 2020. All admissions for respiratory diseases were selected.
Accuracy tests
The performance and accuracy of the tested models were assessed based on various statistical indices. The statistical indicators used in this study can be regrouped into two groups: i) dispersion indicators (error indicators) and ii) general performance indicators [10]. Mean Bias Error (MBE), Root Mean Square Error (RMSE) and Mean Absolute Percentage Error (MAPE) are noted in the dispersion indices, while Coefficient of Determination (R²) and Willmott's Agreement Index (d) are regrouped in the performance indicators4. The equations (Eq. 3 to 7) for statistical indicators are listed below:
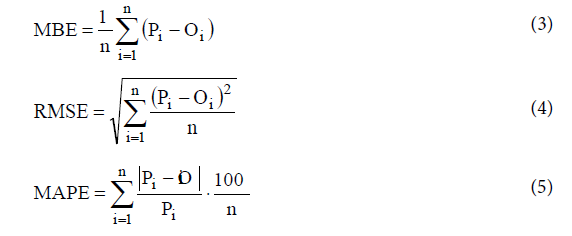
Where, P is the predicted value, O is the observed value, P is the mean of the predicted values, O is the mean of the observed values, n is the number of observations.
Results
The air temperature range recorded during the study period was 18°C for Tmim and 30°C for Tmax. The wind speed varied from calm (< 0.1 m/s) to 7.6 m/s, with an average value of 1.9 m/s. The predominant wind directions consist of: SE (58%); NW (31%) and N (11%), in the SE-NW orientation of the Campo Grande region [11]. The RH ranged from 48% to 73%, with an average value of 65%. Variances in variances were within satisfactory limits for the entire statistical setup, as was the standard deviation value. This indicates that all variables behaved according to normal (Gaussian) distributions (Table 1).

Table 1: Descriptive statistics of the variables studied in the year 2005 to 2020.
It was found that the months with the highest percentage of hospitalizations are the months of July, August and September with 29%, followed by the months of April, May, June with 27.3%; October, November and December with 24.4% and finally the months of January, February and March with a value of 19.2% (Figure 1).

Figure 1: Average monthly seasonal variation in deaths, concentrations in the column of NO2, O3 from the Aurea satellite, OMI sensor, hospital admissions for respiratory diseases, precipitation (mm), relative humidity (%), maximum and minimum temperature (°C), in Campo Grande, Mato Grosso do Sul, Brazil, from 2005 to 2020.
The variation of the NO2 and O3 columns in Campo Grande's atmosphere is highly influenced by biomass burning. The practice of burning biomass is related to meteorological conditions verified in Campo Grande during the second half of winter and first half of spring
The monthly changes in the O3 column showed the following pattern, averaging over the period 700 DU with a range of 733 DU (maximum/September) to 675 DU (minimum/May). This variability was similar throughout the year. The results obtained indicate two welldefined periods: i) rainy season (October to April) and dry season (May to September). It should be emphasized that the O3 column over the years showed a decreasing trend with a rate of 0.47% per year [12] .
The monthly changes in NO2 showed the following pattern, with a mean over the period of 2.97E+15 molec/cm2 and a variation of 3.51E+15 molec/cm2 (maximum/September) to 2.65E+15 molec/cm2 (minimum/May). This trend was also similar throughout the year. It should be emphasized that NO2 over the years also showed a decreasing trend with a rate of 0.002% per year.
Based on the Principal Component Analysis (PCA) extraction method with Varimax rotation and Kaiser normalization, and Cluster analysis obtained by the Ward method, nine main factors were obtained that explained 95.8% of the total variance and three homogeneous groups via the clustering technique, factor 1/group 1 (58.1% of explained variance) consisted of the number of hospital admissions [13], with positive intercorrelations. Factor 2/group 2 (33.8% of the explained variance) groups the parameters NO2, O3 and hotspots that have low values of correlation coefficients (r) with the number of deaths. Factor 3/group 3 (3.8% of explained variance), which are the climatic variables: UR, Prec and Tmax and Tmin. Thus, the CP matrix was also formatted using the Varimax rotation method and the Kaiser type normalization method, which presented three CPs (Tables 2- 4 and Figure 2).

Figure 2: Graphs and residual values of observed deviations in terms of adjusted values, the response variable histogram for the death model.
Table 2: Factors extracted by PCA on death data within the studied area, which represented 95.8% of the total explained variance.
Table 3: Results of mortality analysis for diseases of the respiratory system, pollutants, and climate for the period 2005-2020, regression coefficients, error, correlation coefficient for 95% confidence intervals.
Table 4: Analysis of Variances.
The r coefficients between deaths and air pollutants ranged from (0.216 for O3, 0.395 for NO2 and 0.570 for hot spots) and for the climate variables measured over the years, it ranged from (-0.886 for Prec; -0.696 for RH; -0.518 for Tmax; -0.818 for Tmin). Statistical analysis revealed the existence of a significant positive correlation between deaths and number of hospitalizations with the other correlations ranging from 0.891 [14].
The analysis of time trends was performed using scatter diagrams that showed the relationship between mortality rates from respiratory diseases, pollutants, climate data and years of study. It was observed that the assumption of a linear evolution over time could be assumed. Therefore, for trend analysis, linear regression models were estimated. Then, the modeling was carried out, considering the mortality rates due to respiratory diseases as dependent variables (Y) respiratory diseases, pollutants, climate data and years of study as independent variables (X).
In the final multiple linear regression model, the linear function [15], selected for the regression model, was randomly distributed around the zero line and had no outliers in its residual distribution. This factor showed a homogeneity of variance that validated the final analysis.
Figure 3 shows the temporal variation of observed and predicted rates for the number of deaths, with a correlation coefficient ranging from R2 = 30.8%. t tests (based on Student's t distribution) were performed to test the significance of the coefficients in the equations (Figure 3). The results obtained show that the regression coefficients were statistically significant. The t values for both coefficients were less than 0.05 (p value < 0.05). The results of this analysis indicate that the number of deaths is highly affected by hospital admissions, air pollution and weather conditions, with an R2 of 30.8%; MDE=0.19; RMSE=15.35 and MAPE=21.13 [16] .

Figure 3: a) Observed and estimated values for deaths in the model validation phase; b) Estimated and observed deaths for the years of study from 2005 to 2020.
The simple multiple linear regression model proved to be quite appropriate, as the analysis of residuals revealed that they had a normal, random distribution, without biases, and without the presence of extreme values in the series. A significant trend was considered to be that whose estimated model obtained p<0.05.
The relative risk and confidence interval of deaths from respiratory diseases, hospital admissions, pollutants (O3, NO2 and fire) and climate variables are: DAR (1.000734; 0.950698-1.050771); O3 (1.00072; 0.950068-1.050076); NO2 (1.023471; 0.972298-1.074645); Fire (1.000005; 0.950005-1.050005); Tmin(1.003235; 0.953073-1.053397); Tmax (1.011971; 0.961373-1.06257); RH (1.001151; 0.951093- 1.051208); prec (1.000029; 0.950028-1.05003), whose calculations showed statistical significance for p<0.005.
Discussions
In this study, two air pollutants (O3 and NO2) were identified as causes of increased mortality rates and hospital admissions in the study area [17]. Each pollutant affects a number of diseases, commonly cardiovascular, respiratory and cerebrovascular diseases. Some of the health effects may be immediate, while others may appear several days after the initial exposure.
By monitoring the mortality rates over time, there was a real increase in respiratory diseases in the period from 2005 to 2020, in the city of Campo Grande, MS - Brazil. Thus, there was a significant increase in mortality rates from respiratory diseases of 34% and an increase in hospital admissions of 314% in this period.
evaluated the association between mean daily temperature and mortality from respiratory diseases in elderly Brazilians in 27 cities. The results of the data were daily counts of deaths from respiratory diseases in the elderly aged 60 years and over [18]. The exposure variable was the mean daily temperature obtained from the reanalysis of the Copernicus ERA5-Land. The association was estimated using a two-stage time series analysis method. It also calculated the deaths attributable to heat and cold. The combined exposure-response curve was J-shaped. Exposure to extreme heat increased the risk of mortality by 27% (95% CI: 15–39%), while exposure to extreme cold increased the risk of mortality in 16% (95% CI: 8–24%). The heterogeneity between cities was explained by the city-specific mean temperature and by the temperature range [19]. The fractions of deaths attributable to cold and heat were 4.7% (95% CI: 2.94–6.17%) and 2.8% (95% CI: 1.45–3.95%). The results showed a significant impact of non-ideal temperature on the respiratory health of elderly people living in Brazil and may support the implementation of proactive actions in cities with critical temperature variations.
Investigated the short-term association between air pollution and emergency care for respiratory diseases, in children aged 0 to 6 years, in the Metropolitan Region of Grande Vitoria, Espírito Santo, Brazil. The Poisson regression generalized additive model (MAG) was used, with the dependent variable being the daily number of consultations due to respiratory diseases, and the independent variables being daily concentrations of air pollutants (MP10, SO2, NO2, O3 and CO), temperature, humidity and rain. Through daily averages of concentrations. The increase of 10μg/m3 in the concentration levels of air pollutants increased the risk of emergency care for respiratory disease, for PM10, the increase was 2.43%, 2.73% and 3.29% in the accumulated of 5, 6 and 7 days, for SO2, the increase was 4.47% on the day of exposure, 5.26% two days later, 6.47%, 8.8%, 8.76% and 7.09% in the accumulated of 2, 3, 4 and 5 days, for the CO. Even within the limits established by the World Health Organization, the pollutants PM10, SO2, NO2 and O3 are associated with a higher risk of care for respiratory diseases in children aged 0 to 6 years, and some effects were only identified in the localities disaggregated by region, that is, in situ, which makes it possible to capture greater data variability.
Studied the seasonal variations in daily mortality associated with increases in concentrations of NO2 (nitrogen dioxide) and O3 (ozone) were calculated for Stockholm during the period 2000 to 2016. Excessive risks in daily mortality are presented in models of single pollutants and pollutants throughout the year and divided into four different seasons, namely, winter (December-February), spring (March-May), summer (June to August) and autumn (September to November) [20] . The risks of excess in the single pollutant models associated with an increase in the interquartile range (IQR) for a lag 02 throughout the year were −1.5% (95% CI: −0.5–−2.5) for NO2, and 1.9% (95% CI: 1.0 –2.9) for O3. When divided into different seasons, the excessive risks for NO2 were negative during all seasons and, in several cases, even statistically significantly negative, indicating that NO2 itself was not harmful at the concentrations prevailing during the measurement period. For O3, excess risks were statistically significantly positive throughout the “yearround” in the single and multi-pollutant models. The risks of excess O3 in the single pollutant models were also statistically significantly positive during all seasons.
Analyzed temperature as a risk factor for hospital admissions in 70 cities in MS, the results obtained showed that temperature is responsible for the advance of the substantial fraction of admissions, corresponding to 6.62% of morbidity in the selected cities within the study period. Most of this burden of morbidity was caused by days that were cooler than the ideal temperature (6.38%), compared to days that were hotter than the ideal temperature (0.39%). Furthermore, most admissions were caused by exposure to moderately hot and cold temperatures, and the contribution of extreme days was comparatively low, despite the increased RR. Analysis of data from 70 sites provides evidence for the risk of temperature-related morbidity in a wide range of climates and populations with different demographic, socioeconomic, and infrastructure characteristics.
The trend in death rates from respiratory diseases can be explained by several factors: the susceptibility of the elderly, particularly to respiratory infections and their complications [21] , has been reported as an important cause of hospitalization and death in several countries around the world .This fact can be explained in part by the progressive decrease in lung function in the elderly, determined by the loss of lung elasticity, vital capacity and forced expiratory volume, in addition to the decrease in ciliary function and cough reflex. This susceptibility, associated with air pollution, can lead to an increase in care for various respiratory diseases in the elderly.
The presence of chronic diseases, more common in the elderly, increase their chances of death from community and in-hospital pneumonia. However, some authors show that age is a predictor of death from pneumonia, regardless of gender, primary diagnosis, presence of chronic illness and disease severity.
On the other hand, the complex interaction between infectious agents and human populations can result in variations in incidence across age groups. Differences in virulence, transmissibility and susceptibility due to previous exposures to similar strains influence this dynamic.
Air pollution is associated with several health effects, in addition to respiratory ones. Acute respiratory effects are those associated with recent exposure (hours or days), while chronic effects are due to prolonged exposures, usually longer than 6 months.
Acute effects show a consistent association between increased levels of pollutants and an increase in the number of emergency room visits, hospital admissions and deaths, especially in individuals with chronic respiratory diseases, children and the elderly [22] .
The effects of chronic exposure have been associated with increased overall mortality from respiratory diseases, increased incidence of asthma and COPD, increased incidence and mortality from lung cancer, reduced lung function, and impaired lung development in children.
Nosso objetivo foi examinar o efeito de (1) poluição do ar, (2) temperatura e (3) outras exposições ao clima sobre os resultados de mortalidade e internação hospitalar.
Air pollution consistently acted as a risk factor for respiratory mortality and hospital admission, which agrees with the results of studies carried out in other regions of the world.
Two explanations can be offered for the negative association between health outcomes and O3 and NO2 pollution. The first explanation is related to the fact that O3 is a highly seasonal pollutant, as its formation is catalyzed by sunlight, resulting in higher concentrations of O3 in summer compared to winter. Thus, the effect of O3 on health outcomes must be analyzed considering the effect of the season. The second explanation is related to the high reactivity of O3 leading to the formation of other pollutants such as NO2 and particulate matter. Therefore, O3 is negatively correlated with other air pollutants and its effect on health outcomes must be analyzed as a combined effect of O3 and NO2 (known as the Ox effect) [23].
Exposures to hot and cold temperatures beyond region-specific limits are risk factors for a variety of respiratory diseases. These findings are supported by the scientific literature around the world. In India, cold temperatures below 13.8°C were associated with a 6.3% increased risk for all-cause mortality, 6.5% for respiratory disease mortality. In Istanbul-Turkey, 23 days of exposure to hot temperatures above 22.8 °C were associated with a total of 419 excess deaths. In Korea, hot days of 25 °C compared to 15 °C were significantly associated with a 4.5% increase in cardiovascular hospitalizations.
It is noteworthy that the effect of cold on health takes longer (up to 5 weeks) compared to the more immediate effects of heat (up to 25 days). A similar study in Northeast Asia showed a delayed risk of cold temperature on mortality after 5 to 11 days, but a more immediate effect of warm temperature on mortality after 1 to 3 days in each of Taiwan, Korea, and Japan [24].
Although exposure to hot or cold temperatures can negatively affect health, the rise in temperature has reduced the risk of hospital admissions for some types of illnesses. This can be explained by the fact that high temperatures can cause an immediate increase in mortality rates; where many cases can go directly to the death state without going through the hospital admission state, resulting in lower hospital admission rates.
The study that examined the effects of other climate exposures such as relative humidity, precipitation on mortality and hospital admission outcomes. These time exposures significantly affected only hospital admission. No significant effect was observed regarding the mortality outcome.
In addition to the association of air pollution and climate exposure with mortality and hospital admission outcomes, individual, socioeconomic and environmental factors play an important role in modifying this association. Effect modifiers identified by other authors would be pre-existing health conditions, age, sex, educational attainment, wealth or income or socioeconomic deprivation, occupation, marital status, smoking, season, day of the week, holidays, and influenza epidemics [25].
Individuals with pre-existing chronic health conditions face increased susceptibility to air pollution and mortality related to climate exposure and hospitalization.
Elderly people are more vulnerable to the health effects associated with air pollution, hot or cold temperatures, and other climatic variables. This is due to the physiological degeneration of the human body with increasing age. Aging affects the normal function of organs in the body, resulting in many chronic respiratory diseases. This reduces the ability of older people to adapt to increasing concentrations of air pollutants and changing climatic condition. Furthermore, the elderly has lower immunity and antioxidant defense compared to the young, putting them at greater risk. Many older people also have reduced mobility and mental capabilities, which delay their access to health care, leading to serious health complications and death.
Different lifestyles, socioeconomic status and type of occupation between men and women can also lead to different levels and duration of air pollution and climate exposure. However, it is worth mentioning that the modification of the effect of gender in the association of air pollution and climate exposure with mortality and hospital admission outcomes is believed to be confounded by age, as in many of the reviewed studies, greater risks were found among the elderly [26]. Women (age > 65 years) and elderly men (age > 70 years). This confounding effect could be reduced by evaluating the combined effect of age and gender modification through an interaction term or by stratifying the analysis according to age and gender groups.
Educational level was also considered by some of the studies reviewed as an effect modifier, with higher risks detected among individuals with a lower level of education. Despite considering age, gender, education and wealth effect in the association of air pollution and climate with mortality and hospital admissions in Europe, our scope analysis revealed a lack of investigation into the role of other important socio-demographic factors such as ethnicity. Research has extensively shown that ethnic minorities live in disadvantaged communities and have lower socioeconomic status as well as poor housing conditions. This result in an increased risk of chronic health problems associated with increased exposure, on the one hand, and less access to quality health care, on the other hand.
Finally, it is worth noting that most time series or case-crossover studies have adjusted their analysis for the season effect. It is well established that air pollution, temperature and other climatic variables vary with the seasons. Not to mention that the emission, formation and dispersion of air pollutants are affected by seasonal variations in weather, which in turn affect individual exposure levels. Outdoor activities and daily habits (eg, window ventilation in homes) may also vary depending on the season, reflecting changes in the level and duration of individual exposure to air pollution and climate change.
Conclusion
The study clearly points out that air pollution and exposure to the climate lead to several impacts on human health, especially respiratory problems, resulting from the increase in mortality rates and hospital admissions. However, further research is needed, as the modification of sociodemographic effects, such as ethnicity and the interaction between air pollution and climate, is omitted. Understanding this should provide enough evidence for policy makers to plan and act on the goal of reducing the effects of air pollution and climate change on public health. Furthermore, research should focus on projecting future health behavior and mortality patterns in relation to air pollution and climatic variations in order to guide the planning of effective preventive environmental and health measures.
Consent to Participate
All authors declare their consent to participate in the article.
Funding
This research did not receive external funding.
Competing Interests
The authors declare no conflicts of interest.
Availability of Data and Materials
This research was supported by the Universities and by the UFMS Air Quality Laboratory. We would like to acknowledge the use of data from the tropospheric O3 and NO2 column at http://aura.gsfc.nasa.gov/ lindex.html
Database declaration / Data availability
The climate database is in the public domain and is available at: https://www.cemtec.ms.gov.br/ and the hospital admissions database is available at http://www2.datasus.gov.br/DATASUS/index .php? area=02
Data referring to hospital admissions come from the SUS Hospital Information System - SIH/SUS, managed by the Ministry of Health, through the Department of Specialized Health Care, through the Department of Regulation, Evaluation and Control (DRAC), jointly with the State and Municipal Health Secretariats, being processed by DATASUS - SUS Informatics Department, of the Executive Secretariat of the Ministry of Health, available at the following link: http://sihd. datasus.gov.br/principal/index .php
As for the data referring to the Mortality Information System (SIM), these are available at the following address: https://datasus.saude.gov. br/informacoes-de-saude-tabnet/ .
Ethical considerations
The present study is based on secondary data. Data, of public access, that do not constrain population groups and/or individuals in the presentation of the results found, guaranteeing the confidentiality of the collected information. Therefore, the ethical aspects of research with human beings were respected, as per Resolution nº. 466/2012.
Brazil. National Health Council. Ordinance No. 466/2012. Provides guidelines and regulatory standards for human research. Official Gazette of the Union, Brasília, DF, June 13, 2013, Section 1, 2012, p.59.
References
- Achebak H, Devolder D, Ballester J (2018) Heat-related mortality trends under recent climate warming in Spain: A 36-year observational study. PLoS Med 15:e1002617-e1002619
- Ackermann-Liebrich U, Leuenberger P, Schwartz J, Schindler C, Monn C et al. (1997) Lung function and long-term exposure to air pollutants in Switzerland. Study on Air Pollution and Lung Diseases in Adults (SAPALDIA) Team. Am J Respir Crit Care Med 155:122-129.
- Arbex MA, Martins LC, DE Oliveira RC, Pereira LA, Arbex FF et al (2007)Air pollution from biomass burning and asthma hospital admissions in a sugar cane plantation area in Brazil. J Epidemiol Community Health 61:395-400.
- Baxter LA, Finch SJ, Lipfert FW, YU Q (1997) Comparing estimates of the effects of air pollution on human mortality obtained using different regression methodologies. Risk Anal 17:273-278.
- Braga AL, Saldiva PH, Pereira LA, Menezes JJ, Conceição GM et al (2001) Health effects of air pollution exposure on children and adolescents in São Paulo, Brazil. Pediatr Pulmonol 31:106-113.
- Braga AL, Conceição GM, Pereira LA, Kishi HS, Pereira JC et al (1999) Air pollution and pediatric respiratory hospital admissions in São Paulo, Brazil. J Environ Med 1:95-102.
- Cançado JE, Saldiva PH, Pereira LA, Lara LB, Artaxo P et al. (2006) The impact of sugar cane-burning emissions on the respiratory system of children and the elderly. Environ Health Perspect 114:725-729.
- Chen Z, Salam MT, Eckel SP, Breton CV, Gilliland FD (2015) Chronic effects of air pollution on respiratory health in Southern California children: findings from the Southern California Children's Health Study. J Thorac Dis 7:46-58.
- Conceição GM, Miraglia SG, Kishi HS, Saldiva PH, Singer JM (2001) Air pollution and child mortality: a time-series study in São Paulo, Brazil. Environ Health Perspect 109:347-350.
- de Barros Mendes Lopes T, Groth EE, Veras M, Furuya TK, DE Souza Xavier Costa N et al (2018) Pre and postnatal exposure of mice to concentrated urban PM2.5 decreases the number of alveoli and leads to altered lung function at an early stage of life. Environ Pollut 241:511-520.
- Chen Z, Salam MT, Eckel SP, Breton CV, Gilliland FD (2015) Chronic effects of air pollution on respiratory health in Southern California children: findings from the Southern California Children's Health Study. J Thorac Dis 7:46-58.
- Conticini E, Frediani B, Caro D (2020) Can atmospheric pollution be considered a co-factor in extremely high level of SARS-CoV-2 lethality in Northern Italy. Environ Pollut 261:114465-114468.
- Daumas RP, Mendonça Gas, Ponce DE León A (2004) Poluição do ar e mortalidade em idosos no município do Rio de Janeiro: análise de série temporal. Cad Saúde Pública 20:311-19.
- De Souza Amaury, Andrade, Fernanda A, Oguntunde, Pelumi E etal. (2018) Climate Indicators and the Impact on Morbidity And Mortality Of Acute Respiratory Infections. Adv Med Sci 6:5-20.
- Díaz J, García R, velázquez DE Castro F, Hernández E, López C (2002) Effects of extremely hot days on people older than 65 years in Seville (Spain) from 1986 to 1997. Int J Biometeorol 46:145–149.
- Do Carmo CN, Hacon S, Longo KM, Freitas S, Ignotti E et al (2010) Association between particulate matter from biomass burning and respiratory diseases in the southern region of the Brazilian Amazon [Article in Portuguese]. Rev Panam Salud Publica 27:10-16.
- DI Q, Dai L, Wang Y, Zanobetti A, Choirat C et al. (2017) Association of Short-term Exposure to Air Pollution With Mortality in Older Adults. JAMA 318:2446-2456.
- Dockery DW, Pope CA 3RD, XU X, Spengler JD, Ware JH et al (1993) An association between air pollution and mortality in six U.S. cities. N Engl J Med 329:1753-1759.
- Fajersztajn L, Saldiva P, Pereira LAA, Leite VF, Buehler AM (2017) Short-term effects of fine particulate matter pollution on daily health events in Latin America: a systematic review and meta-analysis. Int J Public Health 62:729-738.
- Giles LV, Koehle MS (2014) The health effects of exercising in air pollution. Sports Med 44:223-249.
- Glezen WP, Greenberg SB, Atmar RL, Pietra PA, Couch RB (2000) Impact of respiratory virus infections on persons with chronic underlying conditions. JAMA 283:499-505.
- Gouveia N, Corrallo FP, Leon ACP, Junger W, Freitas CU (2017) Air pollution and hospitalizations in the largest Brazilian metropolis. Rev Saude Publica 51:117-119.
- Goto DM, Lança M, Obuti CA, Galvão Barbosa CM, Nascimento Saldiva PH et al (2011) Effects of biomass burning on nasal mucociliary clearance and mucus properties after sugarcane harvesting. Environ Res 111:664-669.
- Hamra GB, Guha N, Cohen A, Laden F, Raaschou-Nielsen O et al (2014) Outdoor particulate matter exposure and lung cancer: a systematic review and meta-analysis. Environ Health Perspect 122:906-911.
- Hanson L, Weber D, Rutala W, Samsa G (1992) Risk factor for nosocomial pneumonia in the elderly. Am J Med 92:161-6.
- Ignotti E, Valente JG, Longo KM, Freitas SR, Hacon Sde S et al. (2010) Impact on human health of particulate matter emitted from burnings in the Brazilian Amazon region. Rev Saude Publica 44:121-130.
Indexed at, Google Scholar, Crossref
Indexed at, Google Scholar, Crossref
Indexed at, Google Scholar, Crossref
Indexed at, Google Scholar, Crossref
Indexed at, Google Scholar, Crossref
Indexed at, Google Scholar, Crossref
Indexed at, Google Scholar, Crossref
Indexed at, Google Scholar, Crossref
Indexed at, Google Scholar, Crossref
Indexed at, Google Scholar, Crossref
Indexed at, Google Scholar, Crossref
Indexed at, Google Scholar, Crossref
Indexed at, Google Scholar, Crossref
Indexed at, Google Scholar, Crossref
Indexed at, Google Scholar, Crossref
Indexed at, Google Scholar, Crossref
Indexed at, Google Scholar, Crossref
Indexed at, Google Scholar, Crossref
Indexed at, Google Scholar, Crossref
Indexed at, Google Scholar, Crossref
Indexed at, Google Scholar, Crossref
Indexed at, Google Scholar, Crossref
Indexed at, Google Scholar, Crossref
Citation: Souza A, Oliveira-Júnior JF, Abreu MC, Aristone F, Fernandes WA, et al. (2022) Seasonal Variations in Daily Mortality Associated with Exposure to Particulates, Nitrogen Dioxide and Ozone in Campo Grande, Brazil, from 2005 to 2020. J Respir Med 4: 134. DOI: 10.4172/jrm.1000134
Copyright: © 2022 Souza A, et al. This is an open-access article distributed under the terms of the Creative Commons Attribution License, which permits unrestricted use, distribution, and reproduction in any medium, provided the original author and source are credited.
Select your language of interest to view the total content in your interested language
Share This Article
Recommended Journals
Open Access Journals
Article Tools
Article Usage
- Total views: 2808
- [From(publication date): 0-2022 - Dec 20, 2025]
- Breakdown by view type
- HTML page views: 2303
- PDF downloads: 505