Sedimentological, Mineralogical and Geochemical Analysis of the Hyperthermal Latest Danian Event across the Galuconitic Marker Bed (Central Tunisia)
Received: 28-Jul-2017 / Accepted Date: 22-Nov-2017 / Published Date: 28-Nov-2017 DOI: 10.4172/2157-7617.1000428
Abstract
Field prospecting of the El-Haria Formation, which is Paleocene in age, leads to the discovery of the glauconitic marker bed in inner neritic to bathyal setting from Southern Tethyan realm. The recognition of this interval is based on lithological changes and an accurate stratigraphic proxy allows to distinguish of three main facies. The use of multivariate (cluster analysis and principal component analysis) and univariate (one-way Anova test) analysis confirm dissimilarities in composition between facies as testified by the significant differences. Sedimentological, geochemical and mineralogical analysis leads to assess paleo-environmental changes and to ascertain the variation of the lysocline and CCD across the glauconitic marker bed. Facies 1, particularly, rich in cobalt, sulfides and iron oxides reflects containment conditions affecting the surface and bottom water. These conditions lead to the extinction of the majority of benthic foraminifera and the disruption in planktonic foraminifers’ assemblage. In addition, the Facies 1 displays a brief shoaling of lysocline and CCD evidenced by the low calcite content, the bad preserved benthic foraminifera associated to the maximum fragmentation shells of planktonic foraminifera. In contrary, the rapid pattern of microfossil and the calcite recovery through the Facies 2 indicate suboxic to oxic conditions and a deepen lysocline and CCD. The cobalt lightly increases within the upper Facies, suggesting slightly oxygen deficient bottom water environment. The base of the glauconitic marker bed seems to be a lateral equivalent of the Latest Danian Event recorded throughout the Tethyan Realm (Spain and Egypt) and the Pacific Ocean.
Keywords: Latest danian event; Southern tethyan realm; Geochemistry; Allochems; Foraminifera; Multivariate analysis; Lysocline
Introduction
The upper Danian interval preceding the Danian/Selandian transition was characterized by a global warming event called Latest Danian Event [1-5]. Similar to Paleocene Eocene Thermal Maximum, the climate change prevailing before and across the LDE disturbed the chemical and physical proprieties of marine ecosystem leading to the ocean dissolution, biotic perturbation, poor oxygenation and increased column water stratification [6].
At nearly the same biostratigraphic interval as the LDE, a glauconitic marker bed was noted throughout north-central Tunisia at Elles, Sidi Nasseur and Garn El Halfaya sections (Figure 1) [2,7,8].
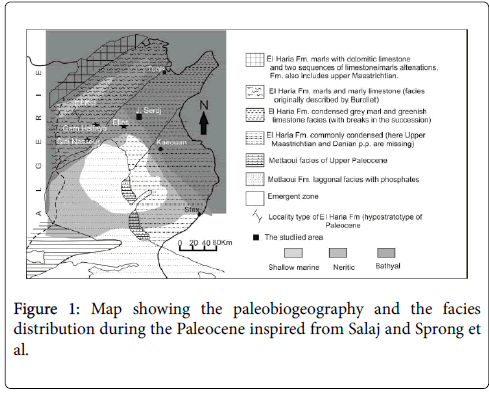
Figure 1: Map showing the paleobiogeography and the facies distribution during the Paleocene inspired from Salaj and Sprong et al.
Previously, the glauconitic marker bed correlated with the Danian/ Selandian transition was positioned at the P3a/P3b boundary [7-9]. However, the recent studies assigned this level to upper Danian [2,10,11].
On other hand, all the studied sections concerned the glauconitic marker bed were deposited under shallow to neritic-water environments [7,8,12-19] noted eutrophication and periods of drop of oxygenation at the bottom water within the glauconitic marker bed [11]. remarked the absence of the LDE records in Elles, Sidi Nasseur and Garn El Halfaya sections, although the noticeable paloenvironmental changes across this bed. In contrast, no detailed studies from deeper-water section have been published. The goal of the present study is to explore and define the lateral extent of paleoenvironmental changes across the glauconitic marker bed in deeper section in order to recognize the LDE traces in Tunisia.
Geological setting
The Sidi Amara section is situated in the northeastern flank of Jebel Serdj, next to the Ouesseltia-Siliana edge (Central Tunisia, Southern part of Tethys) (Figure 1). In Jebel Serdj, the Paleocene to early Eocene successions are well exposed and consist to the El Haria Formation. This Formation is of upper Maastrichtian to Paleocene age [20]. It covers the Abiod Fm and covered by the Metlaoui Group (Figure 2). The El Haria Fm only spans 100 meters, in which intercalates a particular indurate marl rich in glauconite. However, it attains 500 m toward the “Sillon Tunésien” and the northern basins. The thickness variation could be explained by the upper Creatceous synsedimentary tectonic activation in central and northeastern areas during the Paleocene interval [13,21,22]. The tectonic activities complicated the pleotopography where the thin Paleocene layers deposited on Serj- Bargou area (elevated area) and the hiatus were recorded within emerged areas [20].
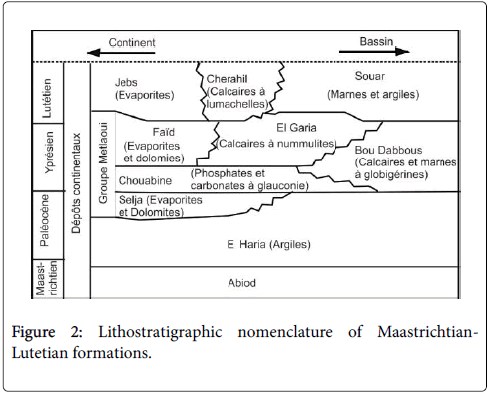
Figure 2: Lithostratigraphic nomenclature of Maastrichtian- Lutetian formations.
The micropaleontological data positioned the Jebel Serdj in outer neritic to upper bathyal paleodepth (Figure 1).
Biostratigraphy
Almost studies of Danian/Selandian transition in Tunisia followed the standard biostratigraphic zonation of Berggren and Pearson [2,9,11,18,23]. According these latter, the studied interval spans P3a/P3b subzones. In this study, however, we applied the biozonation of Arenillas and Molina [24], integrated with the taxonomic concept of Igorina albeari as defined in Arenillas [25] because it placed the glauconitic bed in the upper Danian, within the Morozovella cf. albeari biozone, which is in agreement with the calcareous nannofossil biozones (NTp7a/NTp7b) [11] and the Global Stratotype Section and Point (GSSP) Zumaia [26].
Materials and Methods
Thirty samples were taken at a high resolution of 1-3 cm. About fifty grams of each sample were soaked in H2O2 and subsequently washed in order to recognize the allochems using a stereomicroscope. The sedimentological analysis based on allochems and lithofacies identification lead to characterize the vertical evolution of facies.
For mineralogical and geochemical analyses samples were ground to a grain size <10 μm using an agate ball. The mineralogical composition of the powdered samples was determined at the National Engineering School of Sfax using Philips X-ray diffractometer with Cu-Ka radiation, 45 kV, and 35 mA and scanning between 2 and 40α.
For geochemical analysis, samples were burnt in a furnace at 550°C for 2 h. The sample aliquots were prepared by fusion with HCl followed by HNO3 dissolution. All acids were pre-cleaned by sub-boiling distillation. Concentrations of major element (Ca) and trace element (Co, Mn and Zn) were performed at the LARSEN Laboratory using atomic absorption (Fisher Scientific ice 3000).
Past computer software was used to run principal component analysis and cluster analysis on chemical elements (Ca, Mn and Co). Cluster analysis is a multivariate technique that classifies the data according to similarities or dissimilarities to clusters, each of which has its characteristics. In the investigated section, the cluster analysis based on the Gower similarity matrix, using the paired group method was applied to the same data matrix in order to discriminate the different paleoenvironmental changes of the Sidi Amara section during the Danian/Selandian transition.
The principal component analysis (PCA) is a multivariate technique is used to reduce the number of the components affecting the total variance of the data, in which the 1st component accounts for most of the variance and the last one affects the least variation. Principal component analysis was used in order to estimate the influence of environmental variables on foraminifera abundance. The differences of abiotic variables between Units was tested using one-way analysis of variance (ANOVA).
Results
Lithofacies characters
The Sidi Amara section spans 47 cm (Figure 3). A detailed study of facies shows a vertical evolution of sedimentary characters (Figure 4).
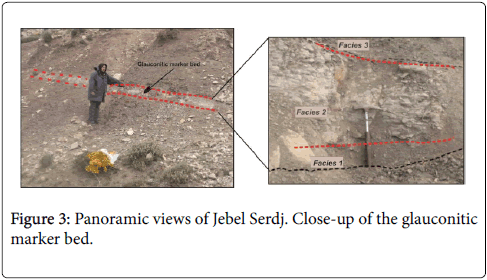
Figure 3: Panoramic views of Jebel Serdj. Close-up of the glauconitic marker bed.
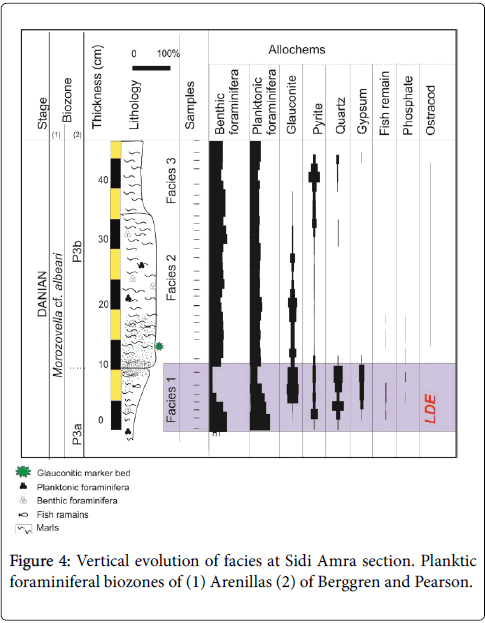
Figure 4: Vertical evolution of facies at Sidi Amra section. Planktic foraminiferal biozones of (1) Arenillas (2) of Berggren and Pearson.
Facies 1: Facies 1 which is 10 cm in thickness (Figure 4), is represented by dark grey fissile marls. Washed marls deliver benthic and planktonic foraminifera, glauconite, pyrite, quartz, gypsum and fish remain associated to rare phosphates. The percentages of these components and the microfossil preservation sharply fluctuates from the bottom to the top of this facies. Detailed analysis of the first 2 cm of Facies 1 exhibit a particular richness of benthic and planktonic foraminifera associated to pyrite (3.5%) and rare ostracods, phosphate and gypsum. The microfossils are well preserved. The planktonic foraminifera are dominated by Acarinina and Subbotina. In the following 3 cm, the benthic foraminifera decrease, however the pyrite, fish remains, gypsum and mainly the quartz (reaching up 32%) increase. At the top 5 cm, the glauconite appears and attains it maximum close to the abrupt lithologic contact. However, the percentage of benthic foraminifera abruptly drops. A distinct change in planktonic foraminifera assemblage is also noted in this interval including the decline of Subbotina, the increased abundance of Chiloguembelina, Morozovella and the flourish of Morozovella cf. albeari . In addition, a planktonic foraminiferal shell fragmentation level occurs in coincidence with Morozovella acme horizon. The Subbotina presents the highest percentage of fragmented shells.
Facies 2: The transition from the Facies 1 to Facies 2 is abrupt. The Facies 2 is represented by 26 cm of indurate marls. The pattern of the allochems changes within these facies. The abundance of benthic foraminifera increases again. In contrast, the pyrite, fish remains, the gypsum and the quartz are scarce. The planktonic foraminifera are well preserved and dominated by the Subbotina and the Parasubbotina . The glauconite abundant at the base of this facies, gradually disappears upwards (Figure 4).
Facies 3: The lithology sharply changes from the indurate marls of Facies 2 to dark grey fissile marls of Facies 3. The benthic and planktonic foraminifera slightly decrease and show some broken shells; however, the pyrite increase from 4% to 17%.
Bulk rock mineralogy
All data points from Sidi Amara section have been presented on a triangular diagram (Figure 5). The axes represent clays Al2O3, calcium calcite CaO and quartz or biogenic silica SiO2. The diagram shows that the majority of the data points plot along the Al2O3 to CaO, indicating that the bulk samples of the studied section consist of a mixing of these components.
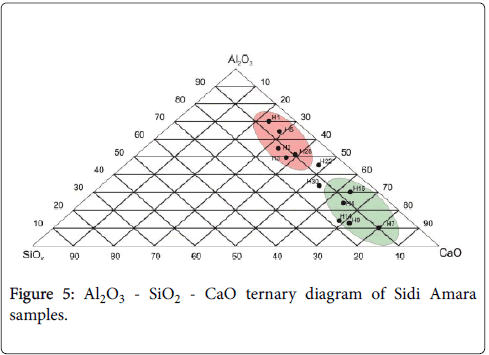
Figure 5: Al2O3 - SiO2 - CaO ternary diagram of Sidi Amara samples.
X-ray diffraction illustrates different distributions (Figure 6). In fact, while the enrichment of phyllosilicates is observed in the Facies 1 (44%) and Facies 3 (41%), the predominance of calcite characterizes the Facies 2 (63%). Quartz contents ranging between 4% and 9% across the Facies 1 show an increase across the lower part of Facies 2 and reaching its maximum (16%) in the middle. However, quartz curve illustrates a return towards low values encountered in lower part of Facies 2 and gradually increase in the Facies 3. The jarosite, geothite, pyrite, rhodochrosite, mackinawite, hematite and marcasite are minor components and vary significantly between facies. The jarosite, geothite, pyrite, mackinawite, hematite and marcasite are abundant in Facies 1. However, the enrichment of rhodochrosite is remarked in Facies 2. In addition, the pyrite increases across the Facies 3.
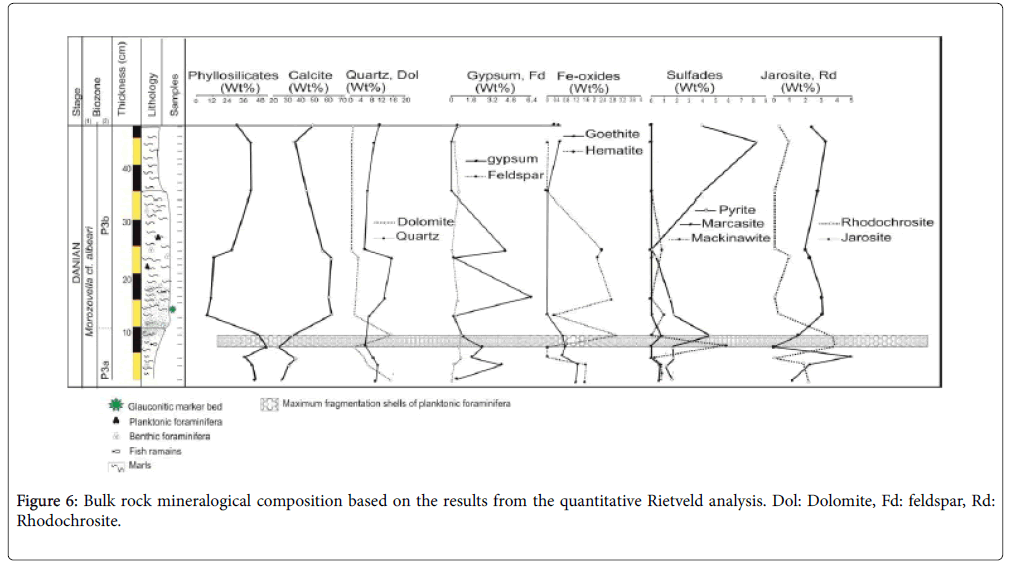
Figure 6: Bulk rock mineralogical composition based on the results from the quantitative Rietveld analysis. Dol: Dolomite, Fd: feldspar, Rd: Rhodochrosite.
Sensitive-redox trace elements: Manganese and Cobalt
The results of manganese Mn and cobalt Co of the studied section are shown in Figure 7. Vertical stacking of deposits shows that the Mn concentrations trend is, coarsely, inversed to the Co content trend. Two levels with enrichment in Co and a drop of Mn are observed and correspond to the dark grey marls (Facies 1 and Facies 3). In the second level, the Co slightly increases. Concerning the indurate brown marls (Facies 2), Mn increases and reaches its maximum (3200 ppm).
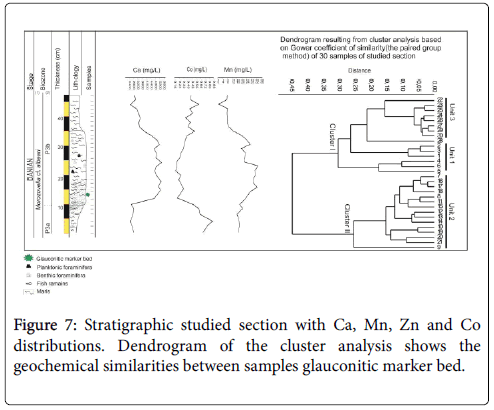
Figure 7: Stratigraphic studied section with Ca, Mn, Zn and Co distributions. Dendrogram of the cluster analysis shows the geochemical similarities between samples glauconitic marker bed.
Q-mode cluster analysis divides the samples into two geochemically distinct clusters (Clusters I–II) (Figure 7). The Cluster I regroups the Unit 1 and Unit 3 samples, marked by an increasing Co and a decreasing Mn and Ca values. The Unit 1 includes the samples of Facies 1, while the Unit 3 consists of the samples of Facies 3.
However, the Cluster II includes the Unit 2 characterized by Ca and Mn enrichment contents and low [Co]. This unit corresponds to the samples logged from Facies 2.
Calcite content
The calcite concentration varies, clearly, from the bottom to the top of the section. Indeed, the highest values are observed within the Facies 2, reaching at most 5300 mg/l. In contrary, the Facies 1 and Facies 3 are, notably, marked by a sharp decrease (Figure 7).
Principal component analysis
Samples were treated by principal component analysis (Figure 8) based on geochemical elements (Ca, Mn, and Co) and allochems (pyrite, gypsum, quartz, glauconite, fish remains). Tukey’s HSD multiple comparison test (p<0.05) was used to test significant differences. Environmental variables measured in the different facies varied significantly (Table 1). The relationship between fauna (benthic and planktonic foraminifera) and abiotic variables is explored through PCA analysis. On the PCA biplot, the same geochemical units are distinguished (Figure 9). The results, incorporating 8 variables, are summarized in the Table 1. This table illustrates that the three latent roots account for 89% (Table 2) of the total variance. The cobalt, the manganese and the calcite concentrations were the major factors which influenced the fauna. The differences in Co and Ca contents are statistically significant between the geochemical units (p<0.0001). It is characterized by abundant foraminifera, low Co concentrations and high values of Mn and Ca. The manganese, glauconite, gypsum, cobalt, quartz and fish remain differed significantly between Unit 1 and Unit 3 (p=0.001, p=0.02, p=0.018, p=0.0001, p=0.002 and p<0.0001 respectively). In contrast, the differences in Ca and pyrite contents are not statistically significant (p=0.236 and p=0.228).
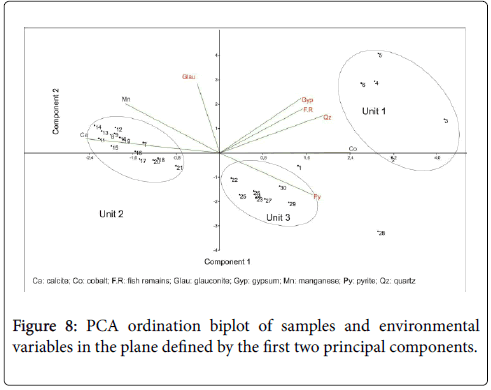
Figure 8: PCA ordination biplot of samples and environmental variables in the plane defined by the first two principal components.
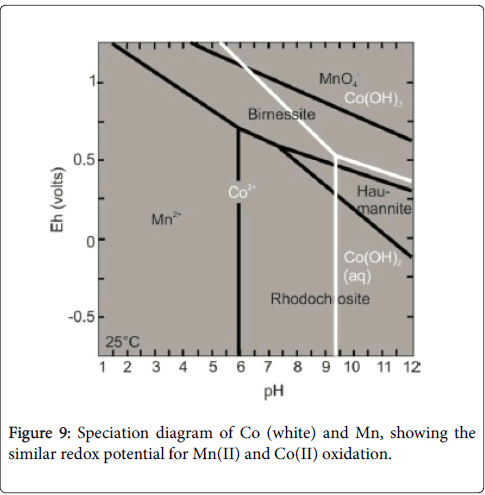
Figure 9: Speciation diagram of Co (white) and Mn, showing the similar redox potential for Mn(II) and Co(II) oxidation.
| No. | Eigen value | Variance | Cum. Percent |
|---|---|---|---|
| 1 | 3.897 | 48.72 | 48.719 |
| 2 | 2.58 | 32.2 | 80.92 |
| 3 | 0.62 | 7.9 | 88.82 |
Table 1: Summary of principal component analysis of Danian/Selandian transition.
| Variables | P-value | F-value |
|---|---|---|
| Calcite | <0.0001 | 44.22 |
| Manganese | <0.0001 | 55.24 |
| Cobalt | <0.0001 | 50.92 |
| Glauconite | 0.0001 | 8.47 |
| Pyrite | 0.000 | 11.19 |
| Gypsum | 0.02 | 4.556 |
| Quartz | 0.001 | 9.33 |
| Fish remain | <0.0001 | 74.94 |
Table 2: Significance of the environmental variables used in PCA (α=0.05).
Discussion
Paleoenvironmental changes across the glauconitic marker bed
Evaluation of geochemical proxies:
Manganese behavior: Landing and Bruland [27,28] and Bruland [29] stated that the dysoxic bottom water conditions could be evidenced by the decreasing of the Mn content. They concluded that, during the reducing conditions developed at water-sediment interface, the Mn2+ diffuses from sediment to oxygen reducing water. According to Hild and Brumsack [30], the Mn depletion in sediment below anoxic conditions, if Mn-fixation in calcite phases does not occur, could be explained by the high solubility of Mn2+ under reducing conditions. Moreover, Turgeon and Brumsack [31] established the relation between the low Mn concentration in sediment and the deposition of powerfully oxygen deficient waters.
Thurow et al. [32], created a model showing that the high Mn concentration in sediment reflected oxic deeper water permitting the Mn incorporation in calcite phases. According to Calvert and Pedersen [33] and Caplan and Bustin [34], the mechanism of Mn fixation in calcite minerals occurred when the oxic bottom waters were enhanced (Figure 9).
Cobalt behavior: According to Anbar [35], Konhauseretal [36] and Scott et al. [37,38], the cobalt can serve as a powerful proxy used to detect the paleo-ocenographic redox variations. The Co and the Mn have the same behavior in seawater [39] and in the sediments [40,41] (Figure 9). Like Mn, in anoxic events, Co can diffuse out sediments [42]. According to Huerta-Diaz and Morse [43], the mobilized Co, under sulfidic conditions, can be incorporated into FeS or precipitate as an iron sulfides CoS [44].
The geochemical proxies and Q-mode clustering yielded three geochemical Units (Figure 7). These Units brought out accurate information concerning the evolution of the redox conditions across the glauconite marker bed. Unit 1 seems to have deposited under oxygen depleted bottom water. Unit 2 deposits in oxic environment and Unit 3 indicates slightly oxygen deficient bottom water environment.
Environmental inferences and onset of the LDE across the glauconitic marker bed
Across the glauconitic marker bed, the X-ray data reveal strong changes in calcite content (Figure 6). Both Facies 1 and Facies 3 show siloclastic-dominated mineralogy, mainly, presented by phyllosilicates and matt quartz grains. Whereas, the Facies 2 is distinguished by a high calcite content. On field the calcite richness is inferred from conspicuous indurate marls. Quartz appearance witnesses the main role of strong winds in bringing out detrital inputs towards the deeper shelf. In some cases, the abundance of quartz is associated to a decrease in calcite content inferring to the contribution of dissolution features in the concentration of detrital input.
The Q-mode PCA shows a paleoenvironmental changes between the geochemical units (Figure 8). In fact, the high concentrations of Co and the low values of Mn and Ca point to the prevalence of anoxic conditions in the bottom water within the Unit 1 which corresponds to the Facies 1. This interpretation is supplemented by the enrichment of Fe-oxides, sulfides and jarosite and the extinction of the majority of benthic foraminifera. The reducing conditions also affected the surface water confirmed by the occurrence of the Chiloguembelina which indicates low oxygenated and stratified water column [45,46]. In addition, the decrease of Subbotina and the increase of Morozovella suggesting warm surface water [25,18] proved the sea water perturbation within the deposit of this facies.
According Jehle et al. and Alegret et al. [3,5], the flourish of Morozovella cf. albeari marked the onset of the LDE. Following these authors, the LDE is recorded at the base of the glauconitic marker bed. This inference is in agreement with geochemical, mineralogical and sedimentological findings.
However, the rapid pattern of microfauna recovery which is coupled with the diminish of the redox proxies concentrations proved the oxic conditions across the Unit 2 (Facies 2). Although, the Unit 3 (Facies 3) is characterized by slightly decrease in oxygenation warranting by the minor increase of cobalt and the pyrite percentage, the microfauna are still abundant.
Carbonate dissolution
According to Dickens et al., Kump et al., Ridgwell and Schmidt, Zachos et al., Zeebe and Zachos and Zeebe et al. [47-54] carbonate dissolution in deep-sea sediment within the PETM almost certainly reveals ocean acidification, exclusively rises in the lysocline and calcite compensation depth (CCD). Jehle et al. [5] noted the same phenomena across the LDE which is signified by calcite content, fragmented planktonic and benthic foraminifera [5,55]. The planktonic foraminifera are more dissolution-susceptible taxon [56]. The glauconitic marker bed is characterized by a short interval of calcite dissolution through the top of the Facies 1 as testified by low Calcite content, fragmented benthic foraminifera and maximum fragmented planktonic foraminifera shells (Figure 6). This interval suggests a brief shoaling of lysocline and CCD. The well negative correlation between Co and the Ca contents (r=0.77) (Figure 10) suggests that the severe calcite dissolution coincide with the increasing Co content recorded within the LDE. In contrast, the recovery of calcite preservation warranting by the high calcite content and the well-preserved benthic and planktonic foraminifera, argue in favor of deepen lysocline and CCD through the Facies 2. A good and positive correlation (r=0.86) observed between Ca and Mn allows to the authigenic precipitation of Mn calcites, which is confirmed by the occurrence of rodochrosite in Facies 2 (Figure 11). A second slightly dissolution horizon, accompanies the transition from Facies 2 to Facies 3 and indicates lightly rise of lysocline.
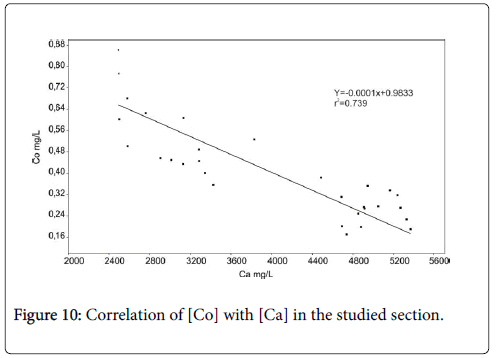
Figure 10: Correlation of [Co] with [Ca] in the studied section.
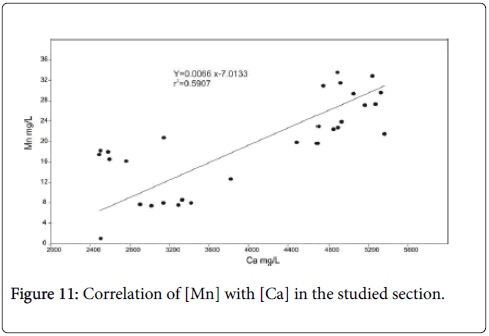
Figure 11: Correlation of [Mn] with [Ca] in the studied section.
Correlation of glauconitic marker bed and other hyperthermal records
The integrated analysis lead to precise correlation of the base of the glauconitic marker bed to the LDE recognized in Egypt. Sprong et al. [1,57] noted that the Latest Danian Event recorded in Egypt is composed by tow beds. The lower bed is characterized by laminated dark marls rich in pyrite and fish remains, poor benthic foraminifera and pyritized planktonic foraminifera. The mentioned authors concluded that the lower bed of LDE (bed I) is linked to anoxia conditions. In contrast, the upper bed (bed II) is testified by a noticeable increase in both benthic and planktonic foraminifera. Somewhat similarly, the anoxic evidences are encountered in Facies 1 including the laminated dark marls, the well-preserved fish remains, the extinction of the majority of benthic foraminifera, the high values of redox element and sulfides and Fe-oxides enrichments. However, the rapid pattern of microfossil recovery begins within the first centimeters of Facies 2. In addition, comparison of the planktonic foraminifera variations observed in the Facies 1 with the published records from Spain [3,25] and Pacific Ocean [5] highlights significant similarities such as the abundance of Morozovella in coincidence with the decline of Subbotina, the flourish of Morozovella cf. albeari and the occurrence of maximum fragmentation shells of planktonic foraminifera.
Conclusion
Integrated analysis of the upper Danian sediments from upper neritic to batyal section located in central Tunisia, allows to detect the paleoenvironmental changes and the lysocline and CCD variations across the glauconitic marker bed. Anoxic conditions prevail the Facies 1, inferred from redox proxies, the extinction of majority of benthic foraminifera and the disturbance of planktonic foraminifera. The low calcite content and the maximum fragmentation shells of the planktonic foraminifera noted at the top of the Facies 1 suggest a rise in lysocline and CCD. However, the Facies 2 is characterized by suboxic to oxic conditions and a deepen lysocline and CCD, advocating by the increase of well-preserved benthic and planktonic foraminifera, the high amount of calcite and the decline of cobalt.
The lithological, geochemical and mineralogical expressions lead to consider the base of the glauconitic marker bed as a lateral equivalent of other LDE records. The abiotic and biotic changes predictable across the Facies 1 share significant similarities with those recorded within other hyperthermals recorded in Egypt, Spain and Pacific Ocean.
Acknowledgments
We gratefully acknowledge Water, Energy and Environment Laboratory for funding our research work. We are very grateful to LARSEN, the National Engineering School of Sfax, and the higher Institute of Biotechnology of Sfax ISBS for geochemical analysis.
References
- Sprong J, Kouwenhoven TJ, Bornemann A, Schulte P, Stassen P, et al. (2012) Characterization of the Latest Danian Event by means of benthic foraminiferal assemblages along a depth transect at the southern Tethyan margin (Nile Basin, Egypt). Marine Micropaleontology 86-87
- Sprong J, Speijer RP, Steurbaut E (2009) Biostratigraphy of the Danian/Selandian transition in the southern Tethys. Special reference to the Lowest Occurrence of planktic foraminifera Igorina albeari. Geologica Acta 7: 63-77
- Alegret L, Ortiz S, ArreguÃn-RodrÃguez GJ, Monechi S, Millán I, et al. (2016) Microfossil turnover across the uppermost Danian at Caravaca, Spain: Paleoenvironmental inferences and identification of the latest Danian event. Palaeogeography, Palaeoclimatology, Palaeoecology 463: 45-59
- Bornemann A, Schulte P, Sprong J, Steurbaut E, Youssef M, et al. (2009) Latest Danian carbon isotope anomaly and associated environmental change in the southern Tethys (Nile Basin, Egypt). Journal of the Geological Society 166: 1135-1142
- Jehle S, Bornemann A, Deprez A, Speijer RP (2015) The impact of the latest Danian event on planktic foraminiferal faunas at ODP site 1210 (Shatsky rise, Pacific Ocean). PLoS One 10: 141-644
- Thomas E, Zachos JC (2000) Was the late Paleocene thermal maximuma unique event? GFF 122: 169-170
- Guasti E, Speijer RP, Brinkhuis H, Smit J, Steurbaut E (2006) Paleoenvironmental change at the Danian-Selandian transition in Tunisia: planktic foraminifera and organic-walled dinoflagellate cysts records. Marine Micropaleontology 59: 210-229
- Van Itterbeeck J, Sprong J, Dupuis C, Speijer RP, Steurbaut E (2007) Danian/Selandian boundary stratigraphy and ostracod records from Sidi Nasseur, Tunisia. Marine Micropaleontology 62: 211-234.
- Steurbaut E, Dupuis C, Arenillas I, Molina E, Matmati MF (2000) The Kalaat Senan section in central Tunisia: a potential reference section for the Danian/Selandian boundary. GFF 122: 158-160
- Steurbaut E, Sztrákos K (2008) Danian/Selandian boundary criteria and North Sea Basin-Tethys correlations based on calcareous nannofossil and foraminiferal trends in SW France. Marine Micropaleontology 67: 1-29
- Sprong J, Kouwenhoven TJ, Bornemann A, Dupuis C, Speijer RP, et al. (2013) In search of the Latest Danian Event in a paleobathymetric transect off Kasserine Island, north-central Tunisia. Palaeogeography, Palaeoclimatology, Palaeoecology 379-380
- Said R (1978) Etude stratigraphique et micropaléontologique du passage Crétacé-Tertiaire du Synclinal d'Elles (Région Siliana-Sers) Tunisie céntrale. – Thèse Doct. 3ème Cycle, Univ. Paris 275: 30.
- Salaj J, Pozaryska K, Szczechura J (1976) Foraminiferida, zonation and subzonation of the Paleocene of Tunisia. Acta Palaeontologica Polonica 21: 127-190
- Donze P, Colin JP, Damotte R, Oertli H, Peypouquet JP, et al.  (1982) Les Ostracodes du Campanien Terminal à l'Éocène inférieur de la coupe de Kef, Tunisie Nord-Occidentale. Bulletin des Centres de Recherche. Exploration-Production Elf-Aquitaine 6: 273-355.
- Saint-Marc P (1992) Biogeographic and bathymetric distribution of benthic foraminifera in Paleocene El Haria Formation of Tunisia. Journal of African Earth Sciences 15: 473-487
- Brinkhuis H, Romein AJT, Smit J, Zachariasse WJ (1994) Danian-Selandian dinoflagellate cysts from lower latitudes with special reference to El Kef section, NW Tunisia. GFF 116: 46-48
- Kouwenhoven TJ, Speijer RP, Van Oosterhout C, Van der Zwaan GJ (1997) Benthic foraminiferal assemblages between two major extinction events: the Paleocene El Kef section, Tunisia. Marine Micropaleontology 29: 105-127
- Guasti E, Kouwenhoven TJ, Brinkhuis H, Speijer RP (2005) Paleocene sea-leveland productivity changes at the southern, Tethyan margin (El Kef, Tunisia). Mar Micropaleontol. 55: 1-17
- Peypouquet JP, Grousset F, Mourguiart P (1986) Paleooceanography of the Mesogean Sea based on ostracods of northern Tunisian continental shelf between the Late Cretaceous and Early Paleogene. Geologisches Rondschau, Stuttgart 75: 159-174
- Burollet PF (1956) Contribution à l'étude stratigraphique de la Tunésie centrale. Annales des Mines et de la Géologie 18: 1-350.
- Amri A, Youssef MB, Ghanmi M (2005) Enregistrement de phénomènes de resédimentation au cours du Maastrichtien supérieur et du Paléocène supérieur (J. Serj, Tunisie atlasique): apport micropaléontologique et signature tectonoeustatique. Comptes rendus Geosci 1525-1531
- Marie J, Trouvé P, Desforges G, Dufaure P (1982) Nouveaux éléments de la paléogéographie du Crétacé de la Tunisie. In: Notes Mémoires. N◦ 19, CFP-total, Paris 6-37
- Berggren WA, Pearson PN (2005) A revised tropical to subtropical Paleogene planktonic foraminiferal zonation. Journal of Foraminiferal Research 35: 279-298
- Arenillas I, Molina E (1997) Análisis cuantitativo de los foraminÃferos planctónicos del Paleoceno de Caravaca (Cordillera Bética): bioestratigrafÃa y evolución de lasasociaciones. Revista Española de PaleontologÃa 12: 207-232
- Arenillas I (2012) Patterns of spatio-temporal distribution as criteria for the separation of planktic foraminiferal species across the Danian-Selandian transition in Spain. Acta Palaeontol. Pol 57: 401-422
- Schmitz B, Pujalte V, Molina E, Monechi S, Orue-Etxebarria X, et al. (2011) The Global Stratotype Sections and Points for the bases of the Selandian (Middle Paleocene) and Thanetian (Upper Paleocene) stages at Zumaia, Spain. Episodes 34: 220-243
- Landing WM, Bruland KW (1980) Manganese in the North Pacific. Earth Planet. Sci Lett 49: 45-56
- Landing WM, Bruland KW (1987) The contrasting biogeochemistry of iron and manganese in the Pacific Ocean. Geochim. Cosmochim. Acta 51: 29-43
- Bruland KW (1983) Trace elements in sea-water. In: Riley, J.P.,Chester (Ed), Chemical Oceanography, Academic Press, London, UK. 8: 157-220.
- Hild E, Brumsack HJ (1998) Major and minor element geochemistry of Lower Aptian sediments from the NW German Basin (core Hoheneggelsen KB 40). Cretaceous Research 19: 615-633
- Turgeon S, Brumsack HJ (2006) Anoxic vs dysoxic events reflected in sediment geochemistry during the Cenomanian-Turonian Boundary Event (Cretaceous) in the Umbria-Marche Basin of central Italy. Chemical Geology 234: 321-339
- Thurow J, Brumsack HJ, Rullkötter J, Littke R, Meyers P (1992) The Cenomanian/Turonian Boundary Event in the Indian Ocean – a key to understand the global picture. Synthesis of results from scientific drilling in the Indian Ocean. Amer Geophys Union Geophys. Monogr 70: 253-273
- Calvert SE, Pedersen TF (1993) Geochemistry of recent oxic and anoxic sediments: implications for the geological record. Mar Geol 113: 67-88
- Caplan ML, Bustin RM (2001) Paleoenvironmental and paleoceanographic control on black, laminated mudrock deposition: example from Devonian-Carboniferous strata, Alberta, Canada. Sediment Geol 145: 45-72
- Konhauser KO, Pecoits E, Lalonde SV, Papineau D, Nisbet EG, et al. (2009) Oceanic nickel depletion and a methanogen famine before the Great Oxidation Event. Nature 458: 750-753
- Scott C, Lyons TW, Bekker A, Shen Y, Poulton SW, et al. (2008) Tracing the stepwise oxygenation of the Proterozoic ocean. Nature 452: 456-459
- Scott C, Planavsky NJ, Dupont CL, Kendall B, Gill BC, et al. (2012) Bioavalability of zinc in marine systems through time. Nat Geosci 6: 125-128
- Knauer GA, Martin JH, Gordon RM (1982) Cobalt in north-east Pacific waters. Nature 297: 49-51
- Hem JD, Lind CJ, Roberson CE (1989) Coprecipitation and redox reactions of manganese oxide with copper and nickel. Geochim Cosmochim Acta 53: 2811-2822
- Klinkhammer GP (1980) Early diagenesis in sediments from the eastern equatorial Pacific. Pore water metal results. Earth Planet Sci Lett 49: 81-101
- Heggie D, Lewis T (1984) Cobalt in pore waters of marine sediments. Nature 311: 453-455
- Huerta-Diaz MG, Morse JW (1992) Pyritization of trace metals in anoxic marine sediments. Geochimica et Cosmochimica Acta 56: 2681-2702
- Bostick BC, Fendorf S (2003) Arsenite sorption on troilite (FeS) and pyrite (FeS2). Geochimica et Cosmochimica Acta 67: 909-921
- Boersma A, Silva PI (1983) Paleocene planktonic foraminiferal biogeography and the paleoceanography of the Atlantic Ocean. Micropaleontology 29: 355-381
- Premoli Silva I, Boersma A (1988) Atlantic Eocene Planktonic foraminiferal historical biogeography and paleohydrographic indices. Palaeogeography, Palaeoclimatology, Palaeoecology. Elsevier. 67: 315-356
- Dickens GR (2000) Methane oxidation during the late Palaeocene thermal maximum. Bulletin de la Societe Geologique de France 171: 37-49
- Dickens GR, Castillo MM, Walker CG (1997) A blast of gas in the latest Paleocene: simulating first-order effects of massive dissociation of oceanic methane hydrate. Geology 25: 259-262
- Kump L, Bralower T, Ridgwell A (2009) Ocean acidification in deep time. Oceanography 22: 94-107
- Ridgwell A, Schmidt DN (2010) Past constraints on the vulnerability of marine calcifiers to massive carbon dioxide release. Nature Geoscience 3: 196-200
- Zachos JC, Dickens GR, Zeebe RE (2008) An early Cenozoic perspective on greenhouse warming and carbon-cycle dynamics. Nature 451: 279-283
- Zachos JC, Röhl U, Schellenberg SA, Sluijs A, Hodell DA, et al. (2005) Rapid acidification of the ocean during the Paleocene-Eocene thermal maximum. Science, New York, USA. 308: 1611-1615
- Zeebe RE, Zachos JC (2007) Reversed deep-sea carbonate ion basin gradient during Paleocene-Eocene thermal maximum. Paleoceanography 22
- Zeebe RE, Zachos JC, Dickens GR (2009) Carbon dioxide forcing alone insufficient to explain Palaeocene-Eocene Thermal Maximum warming. Nature Geoscience 2: 576-580
- Dittert N, Henrich R (2000) Carbonate dissolution in the South Atlantic Ocean: evidence from ultrastructure breakdown in Globigerina bulloides. Deep-Sea Res Pt 47: 603-620
- Berger WH (1973) Deep-sea carbonates; Pleistocene dissolution cycles. Journal of Foraminiferal Research 3: 187-195
- Sprong J, Youssef M, Bornemann A, Schulte P, Steurbaut E, et al. (2011) A multi-proxy record of the Latest Danian Event at Gebel Qreiya, Eastern Desert, Egypt. Journal of Micropalaeontology 30: 167-182
Citation: Kotti N, Mardassi B, Ouali J, Yangui M (2017) Sedimentological, Mineralogical and Geochemical Analysis of the Hyperthermal Latest Danian Event across the Galuconitic Marker Bed (Central Tunisia). J Earth Sci Clim Change 8:428. DOI: 10.4172/2157-7617.1000428
Copyright: ©2017 Kotti N. This is an open-access article distributed under the terms of the Creative Commons Attribution License, which permits unrestricted use, distribution, and reproduction in any medium, provided the original author and source are credited.
Select your language of interest to view the total content in your interested language
Share This Article
Recommended Journals
Open Access Journals
Article Tools
Article Usage
- Total views: 5470
- [From(publication date): 0-2017 - Dec 09, 2025]
- Breakdown by view type
- HTML page views: 4528
- PDF downloads: 942