Seismic Liquefaction Potential in Muscat, Sultanate of Oman
Received: 16-Jan-2018 / Accepted Date: 13-Feb-2018 / Published Date: 19-Feb-2018 DOI: 10.4172/2157-7617.1000451
Abstract
Seismic liquefaction is a serious geotechnical engineering problem that takes place in saturated cohesion less soils during earthquakes due to the increase of pore-pressure so that the soil shear strength is decreased to zero. Muscat is situated in the north-eastern part of Oman close to Oman Mountains, which witnessed four earthquakes of order of 5.2 magnitude in the last 1300 years. The surface geology of Muscat reveals great variety of hard rocks in the eastern, southern and western parts to dense and lose sediments in the middle and northern parts. Muscat Municipality provided 1082 borehole data to be examined for their liquefaction susceptibility based on the soil characteristics. Susceptible soils only are further considered to liquefaction hazard assessment. Liquefaction occurs during an earthquake if the cyclic stress ratio (CSR) caused by the earthquake is higher than the cyclic resistance ratio (CRR) of the soil. CSR values were evaluated using probabilistic peak ground acceleration (PGA) values for return period of 2475 years at the surface given by detailed hazard and micro zonation studies. CRR for Muscat region is conducted based on the borehole data with N values of SPT tests, and shear wave velocity results from 99 MASW surveys over the entire region. All the required corrections to get standardized (N1) 60 values, to correct shear-wave velocity, and scale the results for Mw 6.0 instead of the proposed 7.5 are conducted. Liquefaction hazard maps were created using the minimum factor of safety (FS) at each site as a representative of the FS against liquefaction at that location. Results indicate that under the current level of seismic hazard, liquefaction potential is possible at some sites along the northern coast, where alluvial soils, shallow ground water table, and relatively high ground motion are present. The expected settlement of the soft soil at each liquefiable site is also evaluated.
Keywords: Oman; Muscat; Liquefaction potential; N values of SPT; Shear wave velocity
Introduction
The ground shaking due to the passage of seismic elastic waves may strongly affected by the existence of soft soil, causing magnification of the ground motion and/or failure in the soil itself, leading to liquefaction or landslide. Liquefaction, mostly, occurs in saturated cohesionless soils due to the vanishing of the shear strength of the soil as a result of increasing the pore pressure. Consequently, the soil acts as a viscous liquid without bearing capacity and settlement occurs, bringing structures to sink into the ground. Researchers have drawn intense attention toward liquefaction after Niigata and Alaska earthquakes. This phenomenon and associated damages have been further witnessed for many years during many destructive earthquakes e.g., the 1989 Loma Prieta earthquake, the 1992 Cairo earthquake and the 1999 Kocaeli earthquake.
Liquefaction phenomenon mostly takes place in sands and silty sands with low plasticity. However, several observations indicate that liquefaction may occur in gravelly soils as well as in sensitive cohesive clay soils. In order to generate a wide destruction at the ground surface in the form of sand boiling and fissuring, the liquefied soil should be fairly thick to be capable of generating sufficient uplift pressure and to expel large amount of water [1].
The ultimate goal of this study is to estimate the liquefaction potential in Muscat, Sultanate of Oman. This study is justifiable, particularly along the coastal areas as soils are mainly of alluvial sources and fast urbanization dominates the area. Sultanate of Oman occupies the northeaster part of the Arabian Peninsula, and is close to high active tectonic zones (Figure 1). With exception of Oman Mountains, where small to moderate size earthquakes take place, distant large earthquakes that originate in Makran Subduction Zone and Zagros Fold-Thrust Belt affect the Sultanate. The Makran Zone shows a lower seismic activity than Zagros Zone but it can generate larger magnitude events. Active tectonics of the country is controlled also, but to a lower extent, by the transformation of Owen fracture zone and rifting in the Gulf of Aden [2-8].

Figure 1: Instrumentally recorded seismicity of Oman and its surrounding during 1900-2015.
The occurrence of seismic liquefaction rises from the combination of two elements, namely susceptibility and opportunity. The susceptibility describes the potentiality of the soil to liquefy, while the opportunity characterizes the earthquake loading action in terms of ground motion, and the soil strength against earthquake loading to resist liquefaction. The earthquake loading action is expressed as cyclic stress ratio (CSR), while the soil strength against the earthquake loading is expressed as cyclic resistance ratio (CRR) [8-15]. Recommendations provided by the workshop on the evaluation of the liquefaction resistance of soil based upon the simplified method of Seed and Idriss are applied to evaluate the CSR, and the CRR. Field tests based on standard penetration test (SPT) values and the shear wave velocity measurements in Muscat are used to properly estimate CRR in the investigated sites. Estimated the earthquake hazard levels for the Sultanate of Oman at the bedrock conditions, for 475 and 2475 years return periods, using the probabilistic approach. The study was then perfected by a comprehensive micro zonation and site characterization analysis for Muscat governorate.
Thus, site-specific seismic hazard estimates for 2475 years return period and maximum expected earthquake are available, providing the ground motion input that is applied for the current evaluation of the seismic liquefaction potential in Muscat [16-20].
Geologic Setting of Muscat
Abridgement of Oman geologic setting
The Sultanate of Oman is situated nearby the northeastern corner of the Arabian Plate in a convergence zone between the Arabian and Eurasian plates. This convergence is accommodated by the Makran Subduction Zone and Zagros Fault Thrust Belt. Makran is an EW trending subduction zone where the oceanic crust of Oman Sea moves northwards beneath the lithosphere of the Eurasian Plate (Figure 2). The Zagros Fold-Thrust Belt is stretched for about 1500 km from Turkey to Bandar Abbas, southern Iran. This linear, asymmetrical NWSE folding is due to collision of the Arabian and the Eurasian Plates. The majority of the seismicity of the region is generated within these two active Zones (Figure 1). Toward east, Oman is tectonically bounded by the Owen Fracture Zone and Murray Ridge, which are rightlateral transform faults separating the Arabian from the Indian plate (Figure 2).

Figure 2: Main tectonic structures of Oman and its surrounding.
The geology of northern Oman, where Muscat is located, is dominated by the Oman Mountains (Hajar Mountains), whose width varies from 30 km and 150 km (Figure 3). Along with the small to moderate-size felt seismic activity, the Oman Mountains show several young topographic features, indicating recent active tectonics (Generally, Oman Mountains comprise three major structural units that from the base up, are Autochthonous, Allochthonous and Neo- Autochthonous respectively [21-25].
The Autochthonous unit contains the oldest rocks outcropped in the mountains. These rocks are the Precambrian crystalline basement of the Arabian platform and the pre-Permian shelf carbonate recognized as the Hajar Super Group seires. The Allochthonous sequence overlies the autochthonous sequence and are consisted of the Hawasina Complex, Samail Ophiolites and metamorphic rocks. They are formed away from the platform “shelf ” carbonates and they are mainly Mesozoic in age. Neo-autochthonous sediments extends in time from Late-Cretaceous to Tertiary age. The thrust plane has been tectonically reactivated to form normal faults [26-30]. After the over-thrust, uplift, and erosion, new sediments of latest Cretaceous and Tertiary age, were precipitated uncomfortably on to the Mesozoic and Ophiolite complex. Subsequently, a tectonic compressional event in late Eocene has caused renewed folding and faulting. During the latest Ice Age, Pleistocene aeolianites have filled the Tertiary valleys in the coastal area [31]. Quaternary deposits consist mainly of Calcrit, Travertine, recent coastal deposits gravel terraces, alluvial gravel and fans in the alluvial plains, slope aeolian deposits and beach sands along the coastline.
Geologic setting of Muscat Governorate
The geology of Muscat area is coupled to the geology of the Oman Mountains which lithologically consist of four successive rock units together with Quaternary sediments (Figures 3 and 4) as summarized in the next sequential order from oldest to present:

Figure 3: Simplified geological map of northern Oman, showing the Hajar Mountains and major structures.

Figure 4: Three historical earthquakes were probably took place in Oman.
Triassic mahil formation: Rocks of the Mahil Formation comprise the oldest steeply dipping dolomites that form the mountainous background to the south. Typically, Mahil formation is composed of thick, massive-bedded, and light brown-grey dolomite and highly cemented limestone, which were originally deposited as shallow marine to intertidal carbonate at the northern boundaries of the Arabian Continental Shelf. The dolomite beds are also inserted as thin layers with other fine rocks of chert and fine dolomite or sometimes siltstone. These rocks represent the autochthonous rocks that were over thrusted, heated, deformed and buried by the Samail Ophiolite complex in the Late Cretaceous [32].
Hawasina tectonic melange: The Hawasina sediments are deposited simultaneously with the carbonate platforms of the Arabian Plate (Middle Permian to Cretaceous). They comprise of a sequence of proximal to distal deep-oceanic sediments formed in the Hawasina Basin. They also include the Oman Exotics, which are thought to be reefal limestone accumulated on the submarine volcanoes. Heavy hot Ophiolite overrides Hawasina deposits, forming a tectonic mixture or melange. Many Exotics have been metamorphosed to marble. They are found mainly at the southern side in faulted blocks in the Wattayah area [33].
Samail Ophiolite: Ophiolite is an oceanic lithosphere revealed on land. Oman has the world's greatest on land slice of oceanic crust and mantle: Samail Ophiolite is exposed around Mutrah and Muscat. Rather than a single rock type, Ophiolite is a stratified group of rock types made up of
• Upper mantel peridotites at the base, overlain by
• Gabbros,
• Sheeted basaltic dykes and
• Pillow lavas.
The upper mantle material, partly melted to provide a chamber of magma in which layered gabbros is formed at the bottom and normal gabbros at the top. Dykes are the pathways for the extrusion of pillow lavas to the surface from the formed magma chambers. It is likely to observe the upper mantle, the Moho, and the now fossil magma chambers at the ground surface of many Omani valleys. Ophiolite in the Muscat area comprises mostly the upper-mantle Peridotite or Harzburgite [34].
Tertiary sediments: The Tertiary sediments is deposited uncomfortably on the top of almost all previous rock formations. They comprise basal conglomerate and overlying thin bedded nodular limestone that form impressive steep hills and cliffs in the Muscat area.
They are usually honey-brown in color, sometimes reddish. These rocks represent the submergence of the area in the Tertiary period, after the Arabia-Asia continental collision, allowing deposition of sediments at the margins of a shallow marine. Conglomerates and sandstones occur at the base and contain pebbles of Triassic Mahil and older quartzites, followed by sandy limestone and then limestone (Figures 5-7).

Figure 5: Historical earthquakes of Oman and its surrounding.

Figure 6: Spatial distribution of the examined boreholes in the current study.

Figure 7: Susceptible sites that proposed for further liquefaction assessment.
Quaternary deposits: In the low land areas alongside the coastline and inside the valleys, a series of unconsolidated recent deposits exists. Sandy beaches extend from Al-Qurum westward to As Sib with variable inland depth. The Sultan Qaboos Nature Reserve in Al-Qurum and the area north and northwest of Muscat international airport consist of depression with recent clay and silt sedimentation with shallow ground water that convert these regions into khabras and Sabkhas (Figure 8). Elements of sand dunes, bar sands, delta channels, and a tidal channel system are present in the study area. With exception of the uppermost soft soil layer in a few areas, the surface deposits in Muscat are generally dense to very stiff mix of rock fragments, gravel, sand, silt, and clay.

Figure 8: Main outputs of the liquefaction analyses at Seeb Cornish Bridge-1 site using the number of blows of SPT.
Seismicity
The intra-plate earthquake activity inside the Arabian Plate is very low and most of the seismic activities are confined to its boundaries (Figure 1). Earthquakes affecting Oman are occurring along Zagros fold-thrust belt, Makran subduction zone, Owen fracture zone, Gulf of Aden, and to a lesser extent in Oman Mountains.
Three historical earthquakes were probably took place in Oman (Figures 5-10). The first earthquake was occurred in Sohar region in 879. The earthquake occurred in the morning without further details. It is not known whether the shaking is generated from an earthquake inside Oman or from a larger earthquake further away in Makran. The second earthquake took place in Western Makran in 1483 with magnitude 7.7 and allegedly destroyed Qalhat City in northern Oman [35] postulated that Qalhat was damaged by a local earthquake with magnitude 6.0 in April 1497 and the event of 1483 is occurred locally in Hormuz as supported by the numerous foreshocks that felt in Hormuz. In 1883 an earthquake is strongly felt in Muscat and Nizwa and damaged several villages in the vicinity of Nizwa. It was alleged that the ground was distorted in some places [36,37]. The above explanation prove that the location, size, and effect of the few reported historical events in Oman are at least uncertain.

Figure 9: Main outputs of the liquefaction analyses at Seeb Cornish Bridge-1 site using the shear wave velocity.

Figure 10: Factor of safety for susceptible sites in Muscat governorate.
There are only two moderate size instrumentally recorded earthquakes within 400 km from the Muscat governorate (Figure 1). On March 3rd 1971, an earthquake of magnitude 5.2 occurred 12 km SSE of Al-Kamil. Surprisingly, this earthquake was seemingly not felt. This drives us to postulate that either the epicentral location is in error or lacking macroseismic data has been received. The location of this earthquake should not be taken with a high degree of credibility because it is determined by rather remote stations (10° to 87°) and it is thus doubtful. In March 2002, another felt broadly shock with magnitude 5.1 took place in Masafi, northern Oman Mountains. Fault plane solution for this event shows normal faulting with small strike slip component, which is in harmony with the large scale tectonics of the area.
Zagros Fold-Thrust Belt is characterized by intense seismicity in an area of 200-300 km wide series of major blind thrust faults, with N-S strike slip faults accommodating inner deformation. Earthquake activity in this belt is fairly high as documented by historical and instrumental records. Medium to large shallow depth earthquakes (less than 20 km) repeatedly occur in this belt but rarely exceed 7.0. Focal mechanism solutions in Zagros Zone show high-angle thrust faults (40° to 50°) with NW-SE trend and some strike-slip faults trending N-S oblique to the fold belt.
The seismic activity of Makran Zone is low compared with other Beniof zones. The pre-instrumental seismic record indicates the occurrence of large earthquakes in the eastern section of the zone. The most recent of Makran large earthquakes occurred at the border area between Iran and Pakistan with Mw 7.6 in 2013. The most prominent event occurred on November 28, 1945 with Mw 8.1. It was a tsunamigenic event that killed about 300 people. The tsunami influenced the coasts of Iran, Pakistan as well as Muscat, causing a considerable damage and loss of life along the coasts of Pakistan and Iran.
The eastern and the western sections of Makran Subduction Zone show variable seismicity patterns as the majority of this seismicity takes place in the eastern section, while the western section is left apparently quiet. suggested that these two sections are entirely separated by a spreading center at the Murray Ridge, dividing the easternmost corner of the Arabian Plate from the remainder by Sonne fault of Sonn This implies that a single event rupturing the entire Makran Seismic Zone is unlikely attributed the low seismicity in Western Makran to the large amount of unconsolidated and water saturated deposits, which may cause a low frictional coefficient, which impede seismicity
The largest observed earthquake at Owen Fracture Zone and Murray ridge reach magnitude 6.5 and 5.8 respectively. Earthquakes on this fracture zone are likely to be shallow, with focal depth less than 15 km. The few well constrained fault plane solutions along Owen fracture zone indicate a right lateral strike slip sense of motion, which becomes oblique normal faulting with a dextral component along Murray ridge.
The seismic activity in the Gulf of Aden is due to the differential motion between the Great African Rift, Gulf of Aden, and the Arabian Sea. The central axis is the most active area of the Gulf of Aden, along which the sea floor spreading process is taking place. Fault plane solutions show dominant normal and strike-slip faulting, indicating the activity of the spreading center and the perpendicular transform faults. This mechanism supports the extensible nature of the stress field in the Gulf of Aden.
Sites’ Susceptibility for Seismic Liquefaction
A total number of 1082 boreholes covering 12 districts as per the given location map Figure 6 were carefully examined for liquefaction susceptibility. The output gained from this step is to exclude sites where the liquefaction potentiality is unlikely and to include others into calculations where liquefaction is anticipated. Among many factors, the important ones that control the soil susceptibility at a site include the soil type, shape of soil particles, soil permeability, depth of water table, soil age, and the confining pressure. Additionally, soil layers with shear-wave velocity less than 250 m/sec at any investigated depth are considered as susceptible soils and are subjected to liquefaction analysis.
Al-Amirat region
The surface geology at Al-Amirat region shows two main categories of earth material types, the first is the loose sediments which are represented by a coat of Recent or Sub-Recent Aeolian sand, Recent alluvial fans and valley alluvium, and Sub-Recent alluvial fans terraces. The second surface cover type is the rocky outcrops represented by the banded metagreywacke and schist, chert, dolomite, silicified limestone, and mafic schist and amphibolite. Ninty boreholes, covering 45 sites within Al-Amirat region were examined. The water table is detected at depth ranging from 1.4 m to 8.05 m at the boreholes of 18 sites. Water table was not encountered in the remaining sites to the end of boring (10 m depth), reflecting low to very low liquefaction susceptibility. Regarding the strata aging at these sites, liquefaction susceptibility is moderate to very low. The likelihood that sediments covered some parts at Al-Amirat region would be susceptible to liquefy when getting saturated is very low due to the dense nature of the examined soil profiles reflected in the high N-values recorded.
Using the routine parameters of Geotechnical engineering (Seive and Atterberg Limits), the dense to very dense silty sandy gravel or gravelly sand with cobbles and occasional boulders are not likely to liquefy even with 100% saturation as the fine content (silt/clay) ranged from 20% to 37% and its Liquid Limit is more than 35% and reaching 47%, together with Plasticity Index exceeding 10%. Therefore, Al- Amirat region shows tendency not to liquefy under cyclic loading due to geological conditions, unsaturated soils, and unsuitable soil mechanical properties.
Al-Azaiba region
In this area, a data set of eleven sites with 32 boreholes were evaluated. The soil column, in general, shows a mixture of dense to very dense salty sand with gravel or sandy gravel with cobbles and occasional boulders. The N-values are very high, in most cases>50. The water table is encountered only at 8 sites at depth ranging from 0.7 m to 7.6 m depth. Two sites out of 8 (with water table) have the potentials to liquefy due to their suitable local soil properties and are subjected to the liquefaction evaluation, while the other 9 sites are not susceptible to liquefy.
Al-Khuwair region
Surface geology of this region shows a coating of Recent or Sub- Recent Aeolian sand or dunes, Khabra (depressions with Recent or Sub-Recent clay and silt), and few limestone. Seventy five boreholes at 32 sites were carefully examined, depicting a general soil column of loose to medium dense sand and gravel at the top 3 meters. The soil column become dense to very dense (cemented with depth) below 3 meters with N-value >50. The water table was encountered at 4 sites at depth ranging from 3.3 m to 9 m. The saturated soil column mainly of silty fine to medium sand, and organic soils (Peat) at these 4 sites make them likely to liquefy as the N-values are less than 50. Soils are expected not to liquefy at the remaining 28 sites due to undesired soil parameters and the lack of saturation as water table was not encountered to the end of boring, which attains 20 m depth at some sites.
Al-Mabela region
The central and southern parts of Al-Mabela region shows a coating of Recent and Sub-Recent Aeolian sand, Recent alluvial fans and valley alluvium, Sub-Recent alluvial fans, and ancient alluvial fans; terraces. The Northern part shows Khabra, coastal dunes, and beach sand. We examined 214 boreholes located in 104 sites, however none of these sites show tendency to liquefy. The water table was not encountered at 101 sites and the soil composition is mainly dense to very dense silty sand and gravel with cobbles and occasional boulders. The N-values are greater than 50 along the drilled depth. The remaining 3 sites where water table ranged from 5.4 m to 6.8 m depth, are not susceptible to liquefy due to the improper soil conditions.
Al-Qurum region
Eleven sites were investigated with 31 boreholes at Al-Qurum and Al-Wattayah regions. The geological units covering the study area are mainly; Harzburgite, black and massive limestone, layered gabbro, undifferentiated metamorphic, and metasediments. Other rock units appear at low relief area, such as Recent and Sub-Recent Aeolian sand, sub-Recent alluvial fans, Aeolian sand dunes. Water table was encountered at 4 sites, one of which is not likely to liquefy as it consists mainly of weak to moderately strong rock and rock fragments with N-values greater than 50. The other 3 sites have water table ranging between 4.45 m and 9.6 m deep and are subjected to liquefaction calculations. The remaining 7 sites are not expected to liquefy due to the absence of water table to the end of the drilled depth and their rocky composition (harzburgite and limestone) and in few cases very dense to cemented silty sand and gravel with cobbles and boulders with N values greater than 50.
Al-Mawaleh and Al-Hail regions
A total number of 72 boreholes in 32 sites were investigated. The region is close to Al-Mabela region and has similar geologic conditions with very few limestone and marle. The area in general is not susceptible to liquefy as the soil column mainly comprises very dense to cemented silty sand and gravel with cobbles and boulders. The N-values greater than 50 along the soil profile and the soils are dry in 25 sites out of 32 until the end of boring. Water table was detected in 7 sites, only 4 are recommended to further liquefaction analyses, where the depth of water table ranges between 0.85 m and 5.5 m. The other 3 sites are not favorable to experience liquefaction due to composition and the high compaction state of soil elements which are represented by very dense to cemented silty sand and gravel with N-value greater than 50 along the drilled depth, as well as conglomerates.
Al-Khoudh region
This region has a surface geology very similar to that of Al-Mawaleh and Al-Hail regions. Fifty one boreholes within 20 sites were reviewed. Water table was encountered at five sites at depth ranging from 1.9 m to 3.4 m with low compaction state across the granular soil section that may lead to liquefaction. The other 15 sites are dry, dense to very dense and slightly cemented with depth, consisting of silty sandy gravel with cobbles and occasional boulders (N>50). These conditions cause high resistance to shear failure during cyclic loading.
Baushar and Al-Ghoubrah regions
A total number of 148 boreholes covering 70 sites were examined at Baushar and Al-Ghoubrah regions. The region is close to El Khuwair, showing Aeolian sand, Recent to Sub-Recent dunes and sand, and Khabra. The dominant soil types are represented by silty sand, silty sandy gravel, and silty gravelly sand sometimes with cobbles and boulders. For 40 sites out of 70 within the investigated region, the water table was detected during boring at depth ranging from 1 m to 7.5 m and the soil profile shows loose to medium dense compaction state with low N-values with which calculations should be done to determine the factor of safety against liquefaction. For the remaining 30 sites, water table was not encountered to the end of boring and the soil column shows high compaction state reflected in the high N-values (higher than 50) in almost all penetrated depth. Therefore, these 30 sites are excluded from the liquefaction evaluation.
Greater Mutrah region
In this region, 209 boreholes covering 102 sites are investigated. The main geological units are, harzburgite rocks, block and massive limestone, layered gabbro and undifferentiated metamorphic, the valleys and coastal line that comprises Recent and Sub-Recent Aeolian sand, Sub-Recent alluvial fans, and Aeolian sand dunes 83 sites out of 102 are not susceptible to liquefy as water table is absent to the end of boring, which attains 15 m in some places. The rocky nature of the soil profile, harzbergite/limestone, in places and the very dense compaction of the silty sand and gravel in others make it difficult to lose the shear resistance of the soil elements under cyclic loading. The remaining 19 sites are recommended for further investigation and liquefaction calculations. Those are mainly close to the shore line and the low land which is covered with saturated loose sediments. The water table depth ranges from zero to 8.6 m and the N-values are very low due to the poor compaction state of the existing soil column.
Ghala region
Boring data obtained from 51 boreholes covering 24 sites within Ghala region were examined to evaluate their susceptibility to liquefaction. The surface geology shows a dominant coating of Recent to Sub-Recent Aeolian sand and dunes, Khabra, lower nodular limestone, and conglomerates. All the investigated sites in this area are not expected to experience liquefaction hazard due to many reasons. First of all, the region is characterized by a dry soil due to the absence of water table to the end of boring which reaches a depth of 15 m. At some sites, the soils are silty sand/gravel with cobbles and occasional boulders, dense to very dense and cemented with depth having N-values >50, and in other places the earth column is rock in composition with conglomerate and limestone. Water table was encountered at 3 sites; one at 4.5 m and the other two at 9.5 m depth. The high compact nature and high content of gravel, cobble and boulder ratio through the soil profiles of these 3 sites, make the soil element resistance high enough to overcome liquefaction.
Muscat express way
Along the path of Muscat Express Way at the south of the study area, a number of 14 sites with 52 boreholes were investigated. Almost all the drilled boreholes attained a depth of 20 m. The surface geological units, inferred from the geologic map of the study area, along the path varies from loose coating of Recent to Sub-Recent Aeolian sand and dunes, Sub-Recent alluvial terraces, to hard limestone, dolomite, undifferentiated metamorphics. Available N-values of SPT test reflect dense to very dense soils, which cements with depth. In most places calcarinite, limestone, and conglomerate were observed in the boring process, reflecting a rocky nature, which is consistent with the surface geology. The water table is not encountered in any site to the end of the boring. Therefore, the 14 sites along Muscat Express Way are not likely to liquefy.
Al-Seeb Cornish road
Eight sites with 57 boreholes reaching a depth of 27 m covered Al- Seeb Cornish Road, which extends along the northern coast of the study area from East to West. The surface geology along Al-Seeb Cornish Road shows a variety of loose coastal dunes, beach sand, Recent alluvial sand, Khabrah, and silt. Borehole data are in consistence with surface geology information and give a detailed subsurface description down to 27m. The loose sediments are highly saturated with water in all sites that have been investigated. Liquefaction is highly expected to occur because of the favorable subsurface site conditions and detailed evaluation for the seismic liquefaction hazard should be carried out for each site.
A total of 98 out of 1082 boreholes, as well as 20 sites are found to be susceptible to liquefy in terms of soil characteristics and shear wavevelocity respectively (Figure 7).
Methodology of Liquefaction
The seismic liquefaction potential at specific depth is evaluated using the factor of safety against liquefaction (FS) by comparing the earthquake loading action in terms of CSR to the soil strength against liquefaction in terms of CRR. Liquefaction is expected to occur if the CSR caused by earthquake is higher than CRR of the investigated soil. Therefore, the main task for most liquefaction studies is to define CSR and CRR for the sites of interest. Consequently, factors that control FS along the depth of soil profile include the peak ground acceleration (PGA) at the surface level, results of in-situ tests, earthquake magnitude, fines contents, total vertical overburden stress (♦0), and liquid limits.
Calculation of cyclic stress ratio (CSR)
The earthquake induced load is calculated using the simplified method, initially presented by Seed and Idriss. The members of a workshop on liquefaction resistance evaluation organized by NCEER in 1997 reviewed the formula to become as follows:
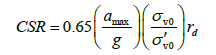
where, CSR is the cyclic stress ratio produced by a certain earthquake to identify the earthquake induced load on the soil, σv0 and σ’v0 are the total and effective stresses, amax is the ground surface Peak Horizontal Ground Acceleration (PGA) at the site of interest, g is gravitational acceleration, and rd is a stress reduction coefficient calculated by the equations defined by NCEER in 1997 for non-critical facilities.
The PGA values at the ground surface in the current study are taken after. Based upon the probabilistic hazard estimates at the bed rock levels, shear-wave velocity, and available geotechnical parameters provided and they estimated the amplification curves and the response spectra at the ground surface for 99 sites using SHAKE 91 software for damping level 5% at 475 and 2475 years return periods. The PGA along with 5% damped spectral acceleration values at various spectral periods were mapped so that ground surface spectral accelerations of important range of spectral periods are covered. The ground surface PGA for 2475 years return period, which is used in the present study, ranges from 0.14 g at the rocky areas to 0.29g at sites of soft soils at the northern coastal areas, where the thickness of the soft soils increases. Surface level PGA provided by these maps were used to calculate CSR at each susceptible site.
Calculation of Cyclic Resistance Ratio (CRR)
CRR is the second vital component of the simplified procedure that describes the capacity of the soil to resist seismic liquefaction. Four field tests are frequently considered to evaluate CRR, namely standard penetration test (SPT), cone penetration test (CPT), shear wave velocity (Vs), and Becker penetration test (BPT), CRR is calculated in the current study using in-situ tests namely the number of blows (N value) of the standard penetration test (SPT), and the shear wave velocity. The CRR versus liquefaction curves are developed for an earthquake with Mw 7.5 (CRR 7.5). To adjust CRR 7.5 for earthquakes with Mw differ from 7.5, FS is multiplied with a magnitude scaling factor (MSF).
Calculation of CRR from SPT: In this procedure, CRR 7.5 is in relation with a depth corrected number of blows of standard penetration test (N1) 60 for clean sand (sand with less than 5% fines content). Fines content is the percentage of clay and silt at particular depth. For sands comprising higher percentage of fines content, additional corrections are applied on (N1) 60. Therefore, the uncorrected SPT number of blows obtained from the site investigation (N) should be subjected to a series of corrections to get (N1) 60. First, a normalized SPT blow count to an effective overburden stress of 100 KPa (N1) is obtained by multiplying the uncorrected SPT blow count by a depth correction factor (Cn). Another correction is made to correct for a hammer energy efficiency of 60%. Additional correction factors may be needed to get the (N1) 60 as:
(N1) 60=NCnCeCbCrCs
Where N is the measured SPT raw data, Cn depth correction factor, Ce=correction for hammer energy efficiency correction factor, Cb borehole diameter correction factor, Cr rod length correction factor, and Cs is a correction for samplers. The overburden pressure correction Cn was applied utilizing the equation suggested.

Where Pa is the atmospheric pressure and σ'v0 is the effective overburden pressure at the time of the SPT test. NCEER in 1997 provided ranges of suggested values for each remaining correction. Appropriate factor for each correction is selected in the current study based upon available information on the drilling procedure and the machinery used.
Sands with higher percentage of fines contents than 5% are expected to be more liquefaction resistant, and further corrected for the fines content to get a clean sand equivalent using the equation proposed by Idress and Seed in NCEER in 1997.
(N1) 60f =α +β (N1) 60
α=0; β=1.0 for FC ≤ 5%
α=exp [1.76 - (190/FC2) ]; β = 0.99 + FC1.5/1000 for 5<FC<35%
α=5.0; β=1.2 for FC ≥ 35%
where (N1) 60f is the clean sand equivalent standard penetration resistance value and FC is the percentage of the fines content.
The equation provided by Blake to approximate the simplified base curve of expressing the CRR values, is used in the present study. This equation is recommended by NCEER Workshop in 1997 for clean sand and is expressed as follows:
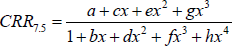
Where, x=(N1) 60f, a=0.048, b = - 0.1248, c = -0.004721, d=0.009578, e=0.0006136, f= - 0.0003285, g=-1.673·10-5, h=3.714·10-6.
Following the recommendations of Vancouver Task Force Report, resulted CRR 7.5 is multiplied by Kσ factor (a correction factor for effective overburden stresses ≥ 100 KPa). Kσ are determined using the equation of Hynes and Olsen:
Kσ=(σ΄vo/Pa) f-1
Where Pa is atmospheric pressure and f is calculated from the relative density (Dr) by:
f=1-0.005 × Dr for 40% < Dr < 80%
Dr ≤ 80% is calculate applying the following equation stated in NCEER in 1997:
Dr=100 × S (N1(60) /46)
Calculation of CRR from shear-wave velocity (Vs) : Shear-wave velocity in the current study is taken after who calculated Vs at 99 sites in Muscat, applying non-invasive technique of multichannel analysis of surface waves (MASW) 20 sites only out of 99 are considered susceptible for liquefaction hazard as they have layers with Vs less than 250 m/sec (Figure 7). The CRR 7.5 based on shear-wave velocity is calculated using the procedure recommended in the report of NCEER Workshop in 1997. Introduced a liquefaction evaluation method using VS data, normalizing the shear-wave velocity by:
VS1=VS (Pa/σ′vo) 0.25
where Pa is a reference stress of 100 kPa (almost atmospheric pressure), and σ′vo is expressed in kPa. The resulted normalized shearwave velocity is then used to calculate CRR 7.5 through the procedure of Andrus and Stokoe, who developed the following formula for the cyclic resistance ratio:
tav/σ′vo=CRR 7.5=a(VS1/100) 2+b/(VS1-VS1) -b/VS1c
where VS1c is the VS1 critical value that distinguishes liquefiable from non-liquefiable sites. The best fit values for the coefficients a and b were found to be 0.03 and 0.9 for earthquakes of Mw 7.5, while the best fit values of for VS1c were determined as follows:
VS1c=220 m/s for sands and gravels with FC<5%
VS1c=21 0 m/s for sands and gravels with FC of about 20%
VS1c=200 m/s for sands and gravels with FC greater than 35%
Calculation of factor of safety against liquefaction (FS)
The method for evaluating FS is well matured in NCEER in 1997 workshop on the evaluation of liquefaction resistance of soil, and is applied herein. FS is identified as follows:
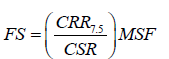
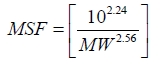
The subscript 7.5 denotes that CRR values are calculated for earthquakes of Mw 7.5. The magnitude scaling factor (MSF) is used to adjust the CRR values for Mw 6.0 earthquake used in the current study. MSF accounts for the duration effect of ground motions. Many MSF values have been developed empirically from wide datasets for sites at which liquefaction did or did not occur in past events. For the current liquefaction evaluation, the MSF values suggested by the revised Idriss formula in NCEER in 1997 are used for the analysis:
If FS is less than 1.0, the soil layer is generally classified as liquefiable, while the soil layer is classified as non-liquefiable if FS is greater than 1.0 by Seed and Idris. It is observed that a soil layer may liquefy due to seismic shaking for FS greater than 1.0. Therefore, a factor of safety of 1.2 is occasionally selected as a lower limit for the layer to be considered as non-liquefiable. Larger FS leads to more conservative liquefaction potentials. In the current study, the definition of was adopted. They classified soil layers with FS less than 1 as liquefiable layers, soils with FS between 1.0 and 1.2 as marginally liquefiable, and those with FS greater than 1.2 as non-liquefiable.
Post-liquefaction settlement
During the earthquake action at saturated granular soils, excess pore water pressure is generated, causing liquefaction. Soil densifying after the seismic event appears at the ground surface as settlement, which persists until the excess pore water pressure is completely dissipated.
The uneven liquefaction induced settlement is largely responsible for heavy damage to buildings, roads and underground lifelines.
The experimental charts developed by was utilized in the current study to estimate the liquefaction induced settlements of saturated and unsaturated soils for the given earthquake scenarios. This method models the volumetric strain values as a function of factor of safety against liquefaction (FS) and one of the soil properties (e.g. relative density Dr, corrected SPT, and cone penetration resistance (CPT).
Results
A representative example for the main outputs Figure 8 obtained by the analyses carried out at all the susceptible boreholes using the in-situ SPT. The borehole at the left panel of Figure 8 shows the soil profile at Seeb Cornish Bridge-1 site. The soil at the surface is medium dense silty sandy gravel down to depth 2.8 m with average blow counts of 12. The lithology changes to be loose to medium dense fine to medium sand with much lower average blow counts of 7 down to 8 m depth. Then, a layer of loose to medium dense very silty slightly clayey extends down to 15 m depth. Below 15 depth, this site is characterized by the presence of non-liquefiable very dense weakly cemented sands with blow counts greater than 50.
Discussion
Following the method explained above in details the earthquake load (CSR) is calculated using the 2475 years return period PGA at the ground surface level. Then SPT values were corrected to get (N1) 60. CRR for an earthquake of Mw 6.0 were calculated at all depths. Since the used earthquake scenario is different from 7.5, MSF factor is identified and FS values were calculated and shown in Figure 8. Two Fs (Fs1, Fs2) are identified, indicating liquefiable and marginal liquefiable zones. Shaded zone has a liquefaction potential. The most right panel in Figure 8 shows a total settlement of saturated and unsaturated sand of 24.7 cm, accumulated along a zone prone to liquefaction between 4 m and 10 m depth. Similarly, Figure 9 shows the main outputs using in-situ shear wave velocity test at site 28 of MASW survey. All the susceptible sites are subjected to similar analysis, resulting in different FS values.
A total of 47 out of the investigated 98 susceptible boreholes at 15 sites in addition to 6 sites out of 20 susceptible sites in terms of shearwave velocity have the potential to liquefy. This precludes the mapping of liquefaction hazard using interpolation of 1 site only to cover the huge area of the Muscat governorate. Therefore, sites with potential to liquefy are shown separately in Figure 10. The liquefaction potential is very unlikely in the eastern area at Muttrah, the western area of Al- Maebela, as well as the entire southern regions for all the investigated sites; mostly due to the nature of soil and/or the absence of the water table till the end of boring. Sites with high vulnerability to liquefaction are confined to the northern coast areas as a result of the presence of shallow ground water level and granular soils (Figure 10).
For the study area, factors of safety are determined along the entire depth considered, and the minimum FS ≤ 1.2 (liquefiable and marginally liquefiable layers) at different depth intervals (i.e., 2-4, 4-6, 6-8, and 8-10 m) are displayed in Table 1. With exception of one borehole at BH-SCB 1- 01, all absolute minimum FS values are observed at depths ≤ 10 m 39 absolute minimum FS is at depth ≤ 6 m while 23 ones are ranging between 6 and 10m. The absolute minimum FS value at BH-SCB 1- 01 is at 13 m depth.
| Site | Northing | Easting | Absolute Min FS | Depth (m) | Min FS 2-4 | Depth (m) |
Min FS 4-6 | Depth (m) |
Min FS 6-8 | Depth (m) |
Min FS 8-10 | Depth (m) |
Min FS=10 | Depth (m) |
Max vert. Settl. (cm) |
|---|---|---|---|---|---|---|---|---|---|---|---|---|---|---|---|
| MASW-24 | 2610770 | 641216 | 0.83 | 3.1 | 0.83 | 3.1 | 3.5 | ||||||||
| MASW-28 | 2610895 | 643058 | 0.95 | 4 | 0.95 | 4 | 3.17 | ||||||||
| MASW-33 | 2618325 | 622703 | 0.98 | 4.2 | 0.98 | 4.2 | 1.72 | ||||||||
| MASW-55 | 2613500 | 628214 | 0.92 | 8.9 | 1.07 | 7 | 0.92 | 8.9 | 8.1 | ||||||
| MASW-79 | 2611380 | 632913 | 0.64 | 3.5 | 0.64 | 3.5 | 2.38 | ||||||||
| MASW-81 | 2610536 | 637225 | 0.97 | 6.7 | 0.97 | 6.7 | 4.35 | ||||||||
| Azxaiba, Bausher_plot 810 & 811. PH-6 | 2610425 | 637274 | 0.45 | 2.4 | 0.45 | 2.4 | 8.53 | ||||||||
| Al-Seeb, Al Hail N-1 | 2616457 | 624334 | 1.2 | 6 | No | ||||||||||
| Al-Seeb, Al-Mawaleh N-1 | 2612511 | 628111 | 0.65 | 3 | 0.65 | 3 | 5.34 | ||||||||
| Al-Khurais, SEEB | 2616430 | 624380 | 0.76 | 8 | 0.83 | 7.98 | 0.76 | 8 | 0.34 | ||||||
| Sur Al-Hadid-1-SEEB | 2619588 | 618138 | 0.9 | 4 | 0.93 | 3.98 | 0.9 | 4 | 0.83 | ||||||
| Al-Ghubrah N- 6 | 2609527 | 642689 | 0.54 | 4.5 | 0.63 | 3.98 | 0.54 | 4.5 | 6.47 | ||||||
| Al-Ghubrah N- 7 | 2609529 | 642641 | 0.87 | 2.5 | 0.87 | 2.5 | 1.46 | ||||||||
| Al-Ghubrah N- 10 | 2609578 | 642662 | 1.07 | 3 | 1.97 | ||||||||||
| Al-Ghubrah N- 11 | 2609579 | 642679 | 0.81 | 3 | 0.81 | 3 | 0.86 | 4.5 | 3.42 | ||||||
| Al-Ghubrah N- 13 | 2609592 | 642731 | 0.94 | 6 | 0.96 | 5.98 | 0.94 | 6 | 1.04 | ||||||
| Al-Ghubrah N- 14 | 2609612 | 642729 | 1.02 | 5 | 0.24 | ||||||||||
| Al-Ghubrah N- 15 | 2609626 | 642723 | 1.11 | 4 | 0.18 | ||||||||||
| Al-Ghubrah N- 16 | 2609649 | 642697 | 1.2 | 2 | 0.19 | ||||||||||
| BH-QS-1 | 2613018 | 650282 | 0.7 | 10 | 0.7 | 10 | 3.29 | ||||||||
| BH-QS-2 | 2613035 | 650310 | 0.41 | 9 | 0.75 | 3.95 | 0.75 | 4 | 0.49 | 7.98 | 0.41 | 9 | 0.41 | 10 | 25.89 |
| BH-QS-4 | 2613064 | 650359 | 0.72 | 10 | 0.72 | 10 | 3.43 | ||||||||
| BH-QS-6 | 2613096 | 650408 | 0.57 | 7 | 1.13 | 5.95 | 0.57 | 7 | 0.81 | 9 | 3.45 | ||||
| BH-SCB 1- 01 | 2620636 | 617774 | 0.63 | 13 | 1.05 | 2.2 | 0.94 | 7.94 | 0.89 | 8.45 | 0.63 | 13 | 16.62 | ||
| BH-SCB 1- 02 | 2620627 | 617802 | 0.5 | 3.9 | 0.5 | 3.9 | 0.5 | 4 | 0.67 | 6 | 0.86 | 8.88 | 0.9 | 12.05 | 24.7 |
| BH-SCB 1- 03 | 2620618 | 617831 | 0.71 | 7 | 0.,81 | 3 | 0.93 | 5 | 0.71 | 7 | 0.75 | 8 | 0.96 | 12 | 20.1 |
| BH-SCB 1- 04 | 2620609 | 617860 | 0.63 | 4 | 0.63 | 3.95 | 0.63 | 4.03 | 0.76 | 7.98 | 0.75 | 8.03 | 0.72 | 12.02 | 19.66 |
| BH-SCB 1- 05 | 2620600 | 617888 | 0.57 | 8 | 0.95 | 3 | 0.58 | 7.98 | 0.57 | 8 | 0.61 | 13.02 | 21.09 | ||
| BH-SCB 1- 06 | 2620590 | 617919 | 0.62 | 9.8 | 0.71 | 7.98 | 0.62 | 9.8 | 0.62 | 10 | 16.29 | ||||
| BH-SCB 2- 01 | 2620274 | 619004 | 1.09 | 8 | 0.79 | ||||||||||
| BH-SCB 2- 02 | 2620265 | 619033 | 0.99 | 8 | 1 | 7.98 | 0.99 | 8 | 1.19 | ||||||
| BH-SCB 2- 03 | 2620256 | 619061 | 0.58 | 6 | 0.65 | 5.98 | 0.58 | 6 | 4.2 | ||||||
| BH-SCB 2- 04 | 2620246 | 619090 | 1.01 | 5 | 0.38 | ||||||||||
| BH-SCB 2- 05 | 2620236 | 619118 | 0.87 | 3 | 0.87 | 3 | 0.5 | ||||||||
| BH-SCB 2- 06 | 2620226 | 619147 | 0.88 | 10 | 0.92 | 7.93 | 0.88 | 10 | 1.63 | ||||||
| BH-SCB 3- 01 | 2619227 | 621260 | 0.9 | 2.1 | 0.9 | 2.1 | 2.83 | ||||||||
| BH-SCB 3- 03 | 2619200 | 621314 | 1 | 7 | 1 | 7 | 1.08 | 8.48 | 6.19 | ||||||
| BH-SCB 3- 04 | 2619187 | 621340 | 0.96 | 7 | 0.96 | 7 | 0.38 | ||||||||
| BH-SCB 3- 05 | 2619173 | 621367 | 1.17 | 8 | 0.11 | ||||||||||
| BH-SCB 3- 06 | 2619159 | 621394 | 0.97 | 3 | 0.97 | 3 | 1.11 | 5 | 1.03 | 6.98 | 0.38 | ||||
| BH-SCB 3- 07 | 2619145 | 621394 | 1.13 | 2.3 | 0.21 | ||||||||||
| BH-SCB 3- 08 | 2619132 | 621448 | 1.18 | 6 | No | ||||||||||
| BH-SCB 3- 10 | 2619105 | 621501 | 1.11 | 3 | 0.06 | ||||||||||
| BH-SCB 3- 12 | 2619078 | 621555 | 0.95 | 8 | 1.01 | 7.98 | 0.95 | 8 | 0.08 | ||||||
| BH-SCB 3- 14 | 2619054 | 621608 | 1.15 | 6 | 0.02 | ||||||||||
| BH-SCB 3- 15 | 2619037 | 621634 | 0.91 | 3 | 0.91 | 3 | 1.03 | ||||||||
| BH-SCB 3- 17 | 2619010 | 621688 | 0.92 | 3.03 | 0.92 | 3.03 | 1.13 | 4 | 1.87 | ||||||
| BH-SCB 3- 18 | 2619001 | 621708 | 0.88 | 6 | 0.9 | 5.98 | 0.88 | 6 | 1.43 | ||||||
| BH-SCB 4- 01 | 2618356 | 622651 | 1.07 | 7 | 1.39 | ||||||||||
| BH-SCB 4- 02 | 2618341 | 622677 | 1.15 | 6.1 | 0.38 | ||||||||||
| BH-SCB 4- 03 | 2618325 | 622703 | 1.19 | 7 | 0.2 | ||||||||||
| BH-SCB 4- 04 | 2618310 | 622728 | 0.97 | 7 | 0.97 | 7 | 1.08 | 8 | 0.79 | ||||||
| BH-SCB 4- 05 | 2618294 | 622754 | 0.91 | 8 | 0.92 | 7.98 | 0.91 | 8 | 2.4 | ||||||
| BH-SCB 4- 06 | 2618284 | 622771 | 0.63 | 4 | 0.63 | 4 | 0.97 | 7.98 | 0.92 | 8.48 | 4.85 | ||||
| BH-SCB 5- 01 | 2615350 | 626029 | 1.14 | 4 | 0.03 | ||||||||||
| BH-SCB 6- 01 | 2614661 | 627024 | 0.37 | 7 | 0.92 | 3.98 | 0.8 | 5.98 | 0.37 | 7 | 1.08 | 8 | 11.84 | ||
| BH-SCB 6- 02 | 2614649 | 627042 | 0.43 | 6 | 0.99 | 3 | 0.43 | 5.98 | 0.43 | 6 | 0.7 | 9.97 | 0.69 | 10 | 15.2 |
| BH-SCB 6- 03 | 2614632 | 627067 | 0.46 | 4 | 0.47 | 3.98 | 0.46 | 4 | 0.64 | 6 | 0.83 | 8 | 28.64 | ||
| BH-SCB 6- 04 | 2614619 | 627085 | 0.43 | 6 | 0.44 | 5.98 | 0.43 | 6 | 0.85 | 9 | 1.15 | 10 | 18.8 | ||
| SBH-02 | 2611015 | 641211 | 0.59 | 3 | 0.59 | 3 | 1.91 | ||||||||
| SBH-03 | 2611013 | 641236 | 0.55 | 3 | 0.55 | 3 | 0.79 | 5.98 | 0.78 | 6 | 1.13 | 8 | 10.45 | ||
| SBH-04 | 2611010 | 641261 | 0.68 | 2.9 | 0.68 | 2.9 | 0.87 | 4 | 7.34 | ||||||
| SBH-05 | 2611008 | 641274 | 0.73 | 2.5 | 0.73 | 2.5 | 4 |
Table 1: The detail of the 208-year repetition pattern is set out.
Conclusion
This study attempts to evaluate the liquefaction potential in terms of factors of safety against liquefaction (FS) in Muscat City using in-situ tests of SPT and Vs. FS values were evaluated to define the expected occurrence of damaging seismic liquefaction for an earthquake of Mw 6.0 at a distance of 10 km, using the site specific peak ground acceleration levels for return period of 2475 years. These ground motion levels may lead to what are thought to be reliable estimates for liquefaction assessments. Although no data on areas developed on reclaimed lands were provided to the authors, such areas are expected to be susceptible for liquefaction as they have large thickness of transferred soil deposits with shallow water table. Available results on sites of high potential of soil failure can be used for efficient liquefaction hazard mitigation. Results indicate that liquefaction phenomena critically needs to be considered when establishing facilities in the northern coastal zone and special liquefaction counter measurements have to be taken into account. Therefore, cooperation with Muscat municipality, who's responsible for past site investigation reports is essential for effective future studies.
References
- Ambraseys NN, Melville CP (1982) A history of Persian earthquakes. Cambridge University Press, Cambridge, UK. 120: 410.
- Ambraseys NN, Melville CP, Adams RD (2005) The seismicity of Egypt, Arabia and Red Sea. Cambridge University Press, Cambridge, UK. p: 204.
- Andrews DC, Martin GR (2000) Criteria for liquefaction of silty soils. In Proc., 12th World Conf. on Earthquake Engineering. Upper Hutt, New Zealand: NZ Soc. for EQ Engg.
- Andrus RD, Stokoe KH (1997) Liquefaction resistance based on shear wave velocity. Proceedings of NCEER Workshop on Evaluation of Liquefaction Resistance of Soils, Technical Report NCEER-97-0022, Youd TL and Idriss IM (eds), National Center for Earthquake Engineering Research, Buffalo. p: 89 -28.
- Bayer R, Chery J, Tatar M, Vernant PH, Abbassi M, et al. (2006) Active deformation in Zagros-Makran transition zone inferred from GPS measurements. Geophysical Journal International 165: 373-381.
- Berberian M (1995) Master ‘blind’ thrust faults hidden under the Zagros folds, active basement tectonics and surface morphotectonics. Tectonophys 241: 193-224.
- Blake TF (1997) NCEER:Â Proceedings of the NCEER workshop on evaluation of liquefaction resistance of soils. Technical report NCEER-97-0022, Youd TL and Idriss (eds) National Center for Earthquake Engineering Research, Buffalo, New York, USA.
- Deif A, Al-Shijbi Y, El-Hussain I, Ezzelarab M, Mohamed AME (2017) Compiling an earthquake catalogue for the Arabian Plate, Western Asia. Journal of Asian Earth Sciences 147: 345-357.
- Deif A, El-Hussain I (2012) Seismic moment rate and earthquake mean recurrence interval in the major tectonic boundaries around Oman. J Geophys Eng 9:773-783.
- Dobry R (1985) Liquefaction of soils during earthquakes. National Research Council (NRC), Committee on earthquake engineering, Report no CETS-EE-001, Washington D.C., USA.
- DrosteV (1997) Geological Excursion in the Muscat Area, PDO Exploration Note No. 210.
- El-Hussain I, Deif A, Al-Jabri K, Toksoz N, El-Hady S, et al. (2012) Probabilistic seismic hazard maps for Sultanate of Oman. Nat Hazards 64:173-210.
- El-Hussain I, Deif A, Al-Jabri K, Toksoz N, Sundararajan N, et al. (2012) Mitigation of seismic risk by microzonation in Muscat Area. Phase II, Project number 22409017, provided to ministers' cabinet, Oman.
- El-Hussain I, Deif A, Al-Jabri K, Mohamed AME, Al-Rawas G, et al. (2013) Seismic microzonation for Muscat region, Sultanate of Oman. Nat Hazards 69:1919-1950.
- Hessami K, Jamali F, Tabassi H (2003) Major active faults in Iran. Ministry of Science, Research and Technology, International Institute of Earthquake Engineering and Seismol. (IIEES), 1:250000 Scale Map.
- Huang P, Solomon S (1987) Centroidal depth and mechanisms of mid-oceanic ridge earthquakes in the Indian Ocean, Gulf of Aden and Red Sea. Journal of Geophysical Research 92: 1361-1382
- Hynes M E, Olsen R (1999) Influence of confining stress on liquefaction resistance. Physics and Mechanics of Soil Liquefaction, Lade PV and Yamamuro JA (eds), Balkema, Rotterdam, The Netherlands p: 145-152.
- Ishihara K, Shimuzu K, Yamada Y (1981) Pore water pressures measured in sand deposits during an earthquake. Soils Found 21: 85-100
- Ishihara K, Yoshimine M (1992) Evaluation of settlements in sand deposits following liquefaction during earthquakes. Soils and Foundations 32: 173-188.
- Jackson JA, McKenzie D (1984) Active tectonics of the Alpine-Himalayan Belt between western Turkey and Pakistan. Geophysical Journal Research Astronomical Society 77:185-264.
- Kusky T, Robinson C, El-Baz F (2005) Tertiary-Quaternary faulting and uplift in the northern Oman Hajar Mountains. Journal of Geological Society 162:871-888.
- Le Metour J, Bechennec F, Roger J, Wyns R (1995) Geology and mineral wealth of the Sultante of Oman. Directorate of minerals, ministry of petrpleum and minerals, Oman.
- Liao SS, Whitman RV (1986) A catalog of liquefaction and non-liquefaction occurrences during earthquakes. Research Report, Department of Civil Engineering, Massachusetts Institute of Technology, Cambridge, Massachusetts.
- Musson RMW (2009) Subduction in the Western Makran: The historian’s contribution. J Geol Soc London 166:387-391.
- Youd TL, Idriss IM (1997) Proceedings of the NCEER workshop on evaluation of liquefaction resistance of soils. Technical report NCEER-97-0022, edited by: National Center for Earthquake Engineering Research, Buffalo, New York, USA.
- Pararas-Carayannis G (2004) Seismo-dynamics of compressional tectonic collision-potential for tsunami genesis along boundaries of the Indian, Eurasian and Arabian plates. InAbstract submitted to the International Conference Hazards.
- Rabu D, Nehlig P, Roger J (1993) Stratigraphy and structure of the Oman Mountains. Documents - B. R. G. M.
- Robertson PK, Woeller DJ, Finn WD (1992) Seismic cone penetration test for evaluating The 14th World Conference on Earthquake Engineering October 12-17, 2008, Beijing, China liquefaction potential under cyclic loading, Canadian Geotechnical Journal 29: 686-695
- Rodgers A, Fowler A, Al-Amri A, Al-Enezi A (2006) The March 11, 2002 Masafi United Arab Emirates earthquake: insights into the seismotectonics of the northern Oman Mountains. Teconophysics 415: 57-64.
- Seed HB, Idriss IM (1971) Simplified procedure for evaluating soil liquefaction potential. Journal of Soil Mechanics and Foundation 97: 1249-1273.
- Seed HB, Tokimatsu K, Harder LF, Chung R (1985) Influence of SPT procedures in soil liquefaction resistance evaluations. American Society of Civil Engineers (ASCE), Journal of the Geotechnical Engineering Division 111: 861-878.
- Sonmez H (2003) Modification of the liquefaction potential index and liquefaction susceptibility mapping for a liquefaction-prone area (Inegol-Turkey). Environmental Geology 44: 862-871.
- Tokimatsu K, Seed HB (1987) Evaluation of settlements in sands due to earthquake shaking. Journal of Geotechnical Engineering, American Society of Civil Engineering 113: 861-878.
- Anderson DL, Byrne PM, De-Vall RH, Yan L (2007) Geotechnical design guidelines for buildings on liquefiable sites in accordance with NBC 2005 for Greater Vancouver Region, Canada.
- Wang W (1979) Some findings in soil liquefaction. Earthquake Engineering Department, Water Conservancy and Hydroelectric Power Scientific Research Institute, P.R.China.
- Youd TL, Idriss IM, Andrus RD, Arango I, Castro G, et al. (2001) Liquefaction resistance of soils: summary report from the 1996 NCEER and 1998 NCEER/NSF workshops on evaluation of liquefaction resistance of soils Journal of Geotechnical and Geoenvironmental Engineering, 127: 817-833.
Citation: El-Hussain I, Saad MG, Deif A, Mohamed AEM, Ezzelarab M (2018) Seismic Liquefaction Potential in Muscat, Sultanate of Oman. J Earth Sci Clim Change 9: 451. DOI: 10.4172/2157-7617.1000451
Copyright: © 2018 El-Hussain I, et al. This is an open-access article distributed under the terms of the Creative Commons Attribution License, which permits unrestricted use, distribution, and reproduction in any medium, provided the original author and source are credited.
Select your language of interest to view the total content in your interested language
Share This Article
Recommended Journals
Open Access Journals
Article Tools
Article Usage
- Total views: 9958
- [From(publication date): 0-2018 - Dec 06, 2025]
- Breakdown by view type
- HTML page views: 8818
- PDF downloads: 1140