Socio-Economic Impacts of Flood Disaster and Management Practices in Jigjiga Town, Ethiopia
Received: 01-Apr-2022 / Manuscript No. jescc-22-59326 / Editor assigned: 04-Apr-2022 / PreQC No. jescc-22-59326 (PQ) / Reviewed: 18-Apr-2022 / QC No. jescc-22-59326 / Revised: 22-Apr-2022 / Manuscript No. jescc-22-59326 (R) / Accepted Date: 22-Apr-2022 / Published Date: 29-Apr-2022 DOI: 10.4172/2157-7617.1000614
Abstract
Flooding is the most generally experienced natural hazard. Flooding is a natural phenomenon that will remain a major hazard as long as people live and work in flood prone areas. The United Nations International body for Strategy for Disaster Risk Reduction defines disaster, as “a serious interruption of the functioning of a community or a society causing widespread human, material, economic, or environmental losses which exceed the ability of the affected community or society to manage using its own resources”. Across the world, literatures that give emphasizes on the adaptation, vulnerability, and resilience as a core concept in the broader issue of sustainable livelihoods are growing. From the point of view of the subject under study, the populations in Jigjiga who lives in the selected kebeles that are highly affected by the floods were the target of the study, in this research data conducted in both quantities and qualitative tools. In quantities, the researcher used questionnaire in order to get enough representative respondents for the research topic. For qualitative tools, the researcher employed in-depth interview to gather detailed information of the research topic and to fill the defect and gap from collected quantities data. The researcher also employed observation techniques to observe situation on ground. This study concluded that flooding is an expected disaster in Jigjiga, since 2008, and the majority of the respondents together with the interviewed experts indicated their experience of witnessing flood event in the town, which is an indication of how flooding has been occurring the town. This study also revealed that flooding in the town is caused by the negligence of both the authority that administers the town and even the regional authorities. Multi sector flood mitigation measures should be created.
Keywords
Ethiopia; Floods; Impact; Socio-economy
Introduction
Background of the study
Flooding is the most generally experienced natural hazard. Flooding is a natural phenomenon that will remain a major hazard as long as people live and work in flood prone areas [1]. The United Nations International body for Strategy for Disaster Risk Reduction, defines disaster, as “a serious interruption of the functioning of a community or a society causing widespread human, material, economic, or environmental losses which exceed the ability of the affected community or society to manage using its own resources” [2]. Disasters should not be seen as the unavoidable consequence of a hazard’s impact but the state of the people at the time of impact makes it possible for a hazard to become a disaster. Disaster is therefore a result of a natural phenomenon affecting vulnerable people. In view of this, the study uses the term ‘disaster’ instead of ‘natural disaster’. The damage that is arising from natural disasters has increased significantly over the last decades with floods accounting 47% of all weather-related disasters from 1995-2015, affecting 2.3 billion people and killing 157,000. The top 15 effected countries that account for 80% of the population affected by flooding every year is the least developed or developing countries that located in Africa, Asia, and Latin America [3]. After the results of such disasters are observed, the people that are mostly affected are low-income families who are already struggling and they can be pushed into hardship since they have fewer assets, less diversified income sources and inadequate financial protection [4]. Hence, every effort should be made to achieve safeness of communities from natural disasters However, it has not always been safe globally and the most common and widespread risk that humankind faces and interrupts their way of life is the natural disasters happening all around the world. Many studies indicate that humankind have witnessed an increase in recent year in the incidence and influence of dangerous disasters in the world. While one of the reasons for that surge may stem from the use of nature and environment by the human such devastation of the forests, agricultural areas, fresh water sources and the like causes a lot of floods, fire storms and related types of disasters [5]. Although the impacts of natural disasters are different in both intensity and area coverage, still Natural disasters cause different problems in both developing and developed countries. The threats caused by the natural disasters always cause for the death of thousands of people also these disasters result the destruction of billions of dollars valued of properties every year. The increasing anthropogenic activities have also escalated both incidence and harshness of natural disasters [6]. Therefore, Flooding is a global phenomenon that causes widespread devastation. Floods are extreme weather events usually caused by the increasing global temperatures, which results in a heavy rainstorm, current increase of the ocean and the glacier melt that are typically caused by the intense prolonged rainfall, snowmelt or a mixture of these.
Now days the global warming is bringing chronic flooding events in many cities across the world. However, the impacts that these floods have on the lives of individuals is different. Urban flood creates many problems, including the spread of disease, interruption of school education and destruction of houses, assets and income [7].
According to [8] floods are the highest natural hazard in the world and account most of the fiscal disasters, particularly flood disasters leaded by river flooding in terms of intensity has been a main recent hazard worldwide. One of the continents that is worst affected by floods is Africa. Flood disasters are critical, national issues as a large number of African nations lack the necessary resources, both technologically and financially to fight the impacts of floods. Thus, River floods are the most dominant floods in Ethiopia; river floods affect the lives of both rural and urban residents in the form of flash and urban floods. As [9] mentioned in Ethiopia more than 500,000 people are vulnerable to floods, and more than 200,000 have been affected, with 639 people deaths, Thousands of livestock were killed and 228 tons of harvest were washed away. So all of these are showing how much flood disasters are dangerous in Ethiopia and the huge losses made by the flood disaster each year it occurs. Therefore, the frequent occurrence of disasters in Ethiopia has become a serious threat to the nation’s fragile economy and lives of many Ethiopians in the country. Disasters forced many Ethiopians to close down their business, render much jobless, damage the environment and disrupt economic activities and sometimes these disasters may cause some other impacts like health impacts since floods may spread some diseases after their occurrence. Supervisor [10] argues that one of the major factors that make people more vulnerable to flood disasters is high poverty levels that may make these people live in hazardous areas such as flood plains and steep hills. The people that live in high poverty levels worldwide have fewer economic resources that make them more vulnerable to flood disasters and they are less likely to get timely warnings. Moreover, if they get the necessary warnings, they have fewer options for reducing losses in a timely manner. He further argues that high levels of poverty affects the resilience and the measures taken in order to mitigate flood affects, make preparation and prevention process that can have adversely influences in addressing socio-economic impacts of floods.
Therefore, the frequency and intensity of floods have been increasing over the years, resulting many socioeconomic effects on the residents of the town such as loss of life, damage to property and the destruction of the environment. The number of affected people in the town has been growing each year and the majority of them are those that are in high poverty levels. Besides floods having devastating effects on the town, what make the situation worse are poor management practices of both residents of the town and the relevant authorities.
Thus, this study assessed how floods are socio-economically affecting the town and the management practices of the authorities and communities in the town make in order to reduce the negative impacts that flood disasters may have on the town. Thus the study mainly tries to find out the socio-economic effects flood disasters make of on the residents of the town and the management practices in order to reduce the negative impacts floods.
Description of the study area
The study will be conducted in the Somali regional capital city town of jigjiga which is located at 625 km from the capital city of the country Addis Ababa. Jigjiga is the capital city of the Somali regional state. The latitude of the city ranges between 1620 to 1720 meters.
Water body:the town has one large stream that goes through the center of the town and divides the town into two parts east and west. So far, the regional government or any other organization has not tried to utilize the water that goes through this stream, especially in raining season and the water goes largely to other zones of the region. Source of water that provides drinking water to the town are underground holes that are dug out in places that are both near and far from the stream.
Climate: Its climate is classified semi-arid which is characterized by high temperature and low rainfall that causes high evaporation. The mean maximum annual temperature of the city is 19.54c, while the monthly average temperature ranges between 25.24c in November, to 29.39 in March. The town is extremely wet and lush during rainy season. Additionally, there are two rainy seasons in the town these are the main raining season, which is meher that occurs from July to September, and the short belg rainy in April and May.
Population:
based on figures of the Central Statistical Agency in 2015. The town has an estimated total population of 250,000 whom 123,422 are men and 126,578 are women.
Ecology:the type of vegetation found in the areas around the town is grassland from the eastern and the southern of the directions of the town, this vegetation include Junipers and gum forest in higher altitudes in the northern and western part of the town. There was an extensive history of animal life in the past, although their number has decreased due to expanding human population.
Research Methodology
Under this chapter, combinations of different methods were employed in the collection of data for this study. Literature review, observation and assessment of the perception and opinion of the government officials, and opinions of the affected people through structured questionnaires, interview questions and observations, were the main methods used for the collection of data.
Research design
The study area for this research is Jigjiga. The population of the town and the study focused on those households that are always affected by the floods. From the households, the sample size was identified. Based on the method and approach of the research, this research employed deductive approach. Hence, based on the research environment real data or actual data from field was used to interview the respondents in the study area, in order to analyze the topic under study in the research, a descriptive type of research was used. Because of the time dimension, this research used questionnaire, interview as well as observation techniques. It used purposively various references and articles to collect relevant information from government office and other secondary sources to learn floods effect in this town socio-economically.
Method of data collection
From the point of view of the subject under study, the populations in Jigjiga who lives in the selected kebeles that are highly affected by the floods were the target of the study, in this research data conducted in both quantities and qualitative tools. In quantities, the researcher used questionnaire in order to get enough representative respondents for the research topic. For qualitative tools, the researcher employed in-depth interview to gather detailed information of the research topic and to fill the defect and gap from collected quantities data. The researcher also employed observation techniques to observe situation on ground. Therefore, under this study data was collected by different methods including.
Face to face, semi structural interview
Key informant interview
Questionnaires
Secondary data from different offices in the town
Sampling design
Based on the nature of this research both probability and nonprobability sampling design are suitable to select the respondents of the study. From probability sampling, the researcher used a simple random sampling to simply pick up respondents suitable to the research and every respondent had a chance to be selected. In qualitative sampling which is non-random sampling, the researcher purposively selected interviewee for their experts and information they have about the research topic.
Sampling frame
It is a specific set of units, from which the sample is essentially drawn. In this case, the sample frame of the study was selected from the total 24 kebeles of the town, particularly those that are most severely effected of 2016 flood disaster, which were kebeles 04 and 05. Hence, these kebeles were the actual sample frame of the study. Additionally different experts and key information from different offices of the town were included in the sample frame of the study.
Sampling technique
Both probability and non-probability sampling technique were used, which is suitable to selection of respondents in town, in the case of probability simple random sampling was employed to reduce bias and to select respondents from affected area.in the case of non-probability sampling purposive sampling was used to select the affected people, key informant, relevant sector government officials.
Sampling unit
Each household unit gender male or female and different age groups, which were selected as sample, who are also the sampling unit of the study. In addition to that, governmental offices concerning the research topic were one of the sample units.
Sample size
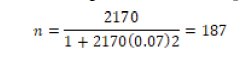
The population in Jigjiga was divided among the 24 kebeles the town contains, from which two kebeles were selected for sample size determination. In this study, a sample of 243 household was selected from the affected kebeles of the town. In order to select these respondents a two stage sampling approach was employed. First, two kebeles were selected out of the 24 kebeles of the town since most of these kebeles are not mostly affected by the floods through non-probability sampling. Second using simple random sampling method, households were selected from each kebeles proportionally to determine the sample size of the respondents from the selected kebeles, the study set the sample by using formula derived by Yemane in 1967. The formula is using 95% confidence level and presented as

Where n= required sample size N= the target population size 1= constant e= margin of error or sampling error expressed as a proportion.
source of data
The source of data for this study was both primary (questionnaire and interview) and secondary data. The secondary data that was used in this study was mainly from books, periodic articles, reports and any other literature related in the research topic.
Primary data sources
The primary data was collected through administration of questionnaires to individual respondents, government officials in the town and key informants.
Secondary data source
Secondary data was collected from concerned sectors of the town such as government and non-government office reports, review of other available source related to the research topic and annual reports of respective area of the target kebeles of the town.
Method of data analysis and interpretation
It is very crucial to analyze and interpret the data collected from the field in order the researcher communicate the research objectives of the study. Quantitative data were analyzed in statistical packages particularly SPSS. Thematic analyses were used to interpret and analyze Qualitative data. For thematic analyses approach the researcher used coding, categorizing, transcribing, selecting themes and narrating important information from the respondents.
Data presentation
Apart from the data analysis technique, the findings of the study was presented in the inform of a written report, charts, tables and graphs depending on the type of research questions to be addressed. In addition to that, interpretation and conceptual generalization were used for analyzing the qualitative data.
Result and Discussion
Introduction
This chapter delivers a discussion about the results of the research based on the primary and secondary data collected through different methods followed by the study. The chapter also highlights the socio-economic impacts of floods that affected on Jigjiga since 2016. Furthermore, it provides a discussion on the respondent rate, demographics, flood cause, flood disaster management, the possible solution of floods on the town and facilities available in the town to combat flood disaster impacts, and the availability of early warning systems.
The study targeted to collect data from 187 sample respondents with regard to the socio-economic impact of flood disaster and the management practice taken to combat flood problems in jigjiga town. From the study questionnaires were distributed for 181 sample respondents, since the remaining six sample respondents were selected to be experts of different departments of the government that have been in one way involving in the management of the flood problems in the town. Therefore, all of the distributed questionnaires were filled in and returned as shown in table 2 making the response rate 100%, in addition to this, all of the experts that were part of the sample respondents for this study successfully responded to the questions forwarded for them. Thus, the above response rate shows the respondents through their participation were more willing to have a society free from flood disaster problems and are willing to work with relevant authorities to achieve safety from such disaster.
Demographic data
The demographic data of the respondents, including, age, and the years of stay of the respondents in the town and these all are explained below.
Age distribution of the respondents
The above table 1 shows the age distribution of the respondents which is, 26% (n=47), of the respondents were less than 25 years of age, this age group form the smallest portion of the participants of the study in terms of age, the second largest respondents of the study, 33.1% (n=60), were aged 25-40 years. The largest portion of the participants of the study that is 40.9% (n=74), were also holding the oldest ages of the respondents. Thus, the oldest group of the respondents of the study was the most participants of the study, meaning as the age of the participants increase their willingness to participate was also increasing.
| Frequency | Percent | Valid Percent | Cumulative Percent | ||
|---|---|---|---|---|---|
| Valid | <25 | 47 | 26.0 | 26.0 | 26.0 |
| 25-40 | 74 | 40.9 | 40.9 | 66.9 | |
| >40 | 60 | 33.1 | 33.1 | 100.0 | |
| Total | 181 | 100.0 | 100.0 | ||
Table 1: Age distribution of the respondents.
Occupation of the respondents
The study revealed that, the sector which employs most of the respondents of the study, in other words most of the respondents of the research were engaged in the business sector, that is 34.3% (n=62) of the participants of the study were employed in the business sector, and this is a sign showing how the business sector is important for the town. The second largest group of the participants of the study were civil servants and they were 29.8% (n=54) of the participants, another important portion which is, 22.7% (n=41), of the participants were farmers, the fourth largest number of the participants of the study, 13.3% (n=24), were in the category of others, which means they were employed in different sectors other than the above mentioned occupations, (students, teachers, drivers etc) (Table 2).
| Frequency | Percent | Valid Percent | Cumulative Percent | ||
|---|---|---|---|---|---|
| Valid | civil servant | 54 | 29.8 | 29.8 | 29.8 |
| business | 62 | 34.3 | 34.3 | 64.1 | |
| farmer | 41 | 22.7 | 22.7 | 86.7 | |
| other | 24 | 13.3 | 13.3 | 100.0 | |
| Total | 181 | 100.0 | 100.0 | ||
Table 2: Occupation of the Respondents.
Duration of living in the effected kebeles
According to the above table, the respondents with the longest years of living in the affected kebele, are those of the participants with, 39.8% (n=72), and these respondents were living in these kebele for more than forty years, which means they were more important than the other respondents living in the area since they have more chance of witnessing flood disaster event than the other respondents of the study. The second largest group among the respondents who lived in this kebele with duration of forty years were 29.3% (n=53). Another respondents with 16% (n=29) were living in these kebele with duration of five years and these respondents were the least living participants in the areas among the respondents. Also, respondents with 14.9 % (n=27) were living in these cables of the town with duration of ten years. Therefore, the respondents with the longest years of living in these kebele were also with highest percentage and this helped the researcher to find more information from them.
The Experience of respondents of having worst flood event in the town
The study revealed that most of the respondents 36.5% (n=66), saw their worst flood events in these two kebelle in the year of 2018, according to this respondents the year of 2018 was a year that floods caused a devastating impact on the residents who were residing on the banks and areas near the stream. The second highest portion of the respondents 34.8% (n=63) told that the year they saw worst floods in the areas was the year of 2016, according to this respondents 2016 was also a year that caused flood problems which effected the town particularly on those two kebele very much. Another respondents of the study 17.1% (n=31) told when asked to the same question that they witnessed the worst flood event in the year of 2008. However, the least of the respondents of the study in terms of their number 11.6% (n=21), responded to the same question that, they experienced the worst floods before 2008 and this gives the highest respondents to those who answered that worst flood events occurred in the town on the year of 2018. In addition to this, the officials interviewed from the DPPB told the researcher that flood events is not considered a natural hazard unless, it is a threat to human lives or properties, the official added that, 2018 floods were recognized as a natural hazard, since it was the worst flooding event ever witnessed in Jigjiga. The researcher also observed houses and schools damaged by the floods of that year, which some of them are reconstructed, while others can be seen their ruins only.
Flood severity
In the above table most of the respondent of the study, 32% (n=58), rated the severity of floods in the effected kebele of the town, as high, while the second highest number of the respondents, 21.5% (n=39), rated the flood problems as very high, and these two groups of the respondents are made of more than fifty percent of the respondents, which solidifies their arguments, since more half the studied population gave to those ratings, 20.4% (n=37), of the respondents told the researcher that they feel the rate of severity of floods as being moderate. The fourth largest set of the respondents, that is 16.6% (n=30), gave the flood severity to the rating of low and 9.4% (n=17) of the respondents responded that flood severity of in the town as very low and these makes the respondents who responded with the rating of very high and high as the largest set of the respondents. According to the rating of the respondents that the flood problems is existing problem.
Impact of floods on human health
Whenever floods incidence occurs in Jigjiga, health issues become higher. Thus, 28.7% (n=52) of the respondents, which is highest percent of the participants of the study revealed that highest impact that floods have on residents of the town is its causing of death, another considerable number of the respondents, 22.7% (n=41) feel that the health issue that can raise after the flood occurrence is physical damage and diseases, the physical damage that floods may cause, include injuries, which individuals may face during flood events such as animal bite, damage from collapsed buildings and damages from sharp materials carried by the flood. The diseases, which erupt always after flood incidences include, malaria due to stagnant water, infectious diseases and the absence of health staff due to inaccessibility to their work places. An important number 20.4% (n=37) of the participant of the study indicated that flood events in the town create psychological health impact on the residents and these impacts include trauma for those who lost their loved ones (family and other relatives). Longterm health impact cannot be excluded from the negative impacts that floods cause on the residents of the town since 19.3% (n=35) of the respondents indicated the existence of such type of conditions and these impacts include the eruption of diseases that continues for a while such as diarrhea and 8.8% (n=16) of the respondents revealed the occurrence of other health impacts.
Social impact of floods on family life and social relations
The respondents responded to this issue as the following 33.1% (n=60), of the participants feels that, flooding displaces families from their place of living, 16.6% (n=30), of the respondent also told that their financial situation is disrupted by the floods, while another large percentage of the respondents that is 15.5% (n=28,) indicated that floods make difficult for the residents to meet their basic needs. The fourth largest respondents 14.4% (n=26), indicated also that floods make difficult to recover their damaged properties, 12.7% (n=23), of the respondents revealed to the existence of other factors that floods may have on families and their relations and the least respondents of this question 7.7% (n=14) also that floods make difficult in coping the health problems caused by floods which they suffer.
Flood impact on public utilities and community services
According to above table, majority of the respondents 33.7% (n=61), believe that floods create impacts on above services, whereas, 25.4% (n=46), of the respondents feel that floods have impact on the education system of the town, since flood disasters make education services difficult to access or impossible for at least days after its occurrence, 22.1% (n=40), believe that floods have impact on electricity and water services of the town and 18.8% (n=34), of the respondents also indicated that floods have impact on another important service which is the health service of the town.
The economic impacts of floods on buildings and other properties
The study required the respondents to indicate the economic impact of floods, particularly on buildings and properties and the respondents give the following responses, 29.3% (n=53), who were also the largest number of the respondents said that floods damage furniture and other appliances of the effected residences of the town, a great number of the respondents, 28.7% (n=52), also indicated that floods damage, and sometimes cause buildings to collapse which huge loss for them. Furthermore, 24.3% (n=44) of the respondents, reveal that floods partially damage buildings and 17.7% (n=32) of the respondents believe the existence of some other economic impact which floods have on buildings and other properties. According to the bureau of trade industry and transport of the town both 2016 and 2018 floods destroyed allot of buildings and badly affected the roads of the town some of them even destroyed, the expert told in the two years millions of money estimated properties was devastated by the disaster and the expert added that the economic impacts created by the floods was very.
The economic impact of floods on transport sector
According to the information given by the respondents, 43.6% (n=79), of them feel that floods have highest impact on transport by taking away the transport facilities of the town, whereas, 35.4% (n=64), of the respondents see the economic impact of floods on transport as damages caused by the disaster on roads, and, 21% (n=38), of the contributors of the study consider the existence of other economic impacts that floods have on the town (Table 3).
| Frequency | Percent | Valid Percent | Cumulative Percent | ||
|---|---|---|---|---|---|
| Valid | damage roads | 64 | 35.4 | 35.4 | 35.4 |
| take away transport facilities in the town | 79 | 43.6 | 43.6 | 79.0 | |
| others | 38 | 21.0 | 21.0 | 100.0 | |
| Total | 181 | 100.0 | 100.0 | ||
Table 3: The Economic Impact of Floods on Transport Sector
Economic impacts of floods on agriculture sector
Based on the above table, the respondents that were asked about the economic impact of floods on the agricultural sector, 45.3% (n=82), of them, who were their majority responded that floods have highest impact on the soil structure by causing damages through the creation of water erosion and the formation of gullies, 29.3% (n=53), of the respondents told that floods damage and cause the loss of crops. Third largest of the respondents also indicated that floods damage and create the loss of equipment used for farming and they indicated that each farmer in the area that effected by floods averagely lost three to four of this equipment, which huge loss for a farmer and have impact of the crop output. Floods have very high impact on floods and event when it occurs it washes away huge farms, according to the expert interviewed from the bureau of agriculture in 2018 alone many farms that are located near the stream was badly affected by the floods and the farms lost huge money because of the floods.
Economic impact of floods on livestock
Generally, the Somali regional economy is based on largely on the livestock sector; hence, the sector is the backbone of the regional economy. Therefore, productivity of the sector is crucial for the livelihood of the majority of the people of the region, so most of the respondents of the study 27.6% (n=50), believe that floods in the town cause the loss or the death of the livestock. Although, the number of livestock reared inside the town is smaller than those reared outside the town, still considerable number of all kinds of livestock is reared by some of the residents of the town. According to the respondents, 1200 of goat and sheep were taken away by the floods in 2016 alone. Since cows rearing are not common in the town, the respondents did not tell any loss of cows, but the death of 15 camels, was told by the respondents and this show how floods are devastating in the town and is effecting the live of the people of the region. Another number of the respondents, 25.4% (n=46), told the loss of an important amount of livestock products, such as milk and cheese, which caused by floods, 24.9% (n=45) of the respondents also indicate damages to and loss of grazing lands caused by the floods particularly areas near the town which used by the livestock reared inside the town and this creates shortage of forage for the livestock which will effect livestock and reduce its products, 22.1% (n=40), of the participants of the study told the existence of animal diseases created by floods which may cause the suffering or the death of livestock in town and some of these diseases mentioned by the respondents include, shoat pox, internal parasite, water borne diseases and blackleg (Table 4).
| Frequency | Percent | Valid Percent | Cumulative Percent | ||
|---|---|---|---|---|---|
| Valid | loss of livestock specify kind and number | 50 | 27.6 | 27.6 | 27.6 |
| loss of livestock product | 46 | 25.4 | 25.4 | 53.0 | |
| damage and loss of grazing land | 45 | 24.9 | 24.9 | 77.9 | |
| anima disease specify type of disease | 40 | 22.1 | 22.1 | 100.0 | |
| Total | 181 | 100.0 | 100.0 | ||
Table 4: Economic Impact of Floods on Livestock.
Management practices in the event of flood incidence
When asked the respondents whether they know any management practice to take before, during and after the occurrence of flood incidence, 56.4% (n=102), of the responded no and this is an indication of how the residents are at risk, since this percentage of them responded we do not know any management practice to take in the event of flood disaster, 43.6% (n=79), of the respondents responded to the same question when asked they yes, which means they know a management practice to take in the event of flood problems and before its occurrence. Therefore, those who have some concepts of responding to flood events are large in number and this may decrease flood problems in the town. Official from DPPB told that their institute has good action that indicates what needs to be done in the event of flood disaster, although this official were complaining about the reluctance of the residents of the town of taking this advises from them
Source of information for the residents of the town in the management of flood p
The study required respondents to indicate were they get from the necessary information and 27.6% (n=50) of the respondents tell that they get the necessary information about flood events from the national government that is an authority from the national government, while 24.9% (n=45), of the respondents tell that they get the information from local authorities in the town, 20.4% (n=37) of the respondents tell they get the required information from communities who are residing in the town, 16.6% (n=30), of them indicate that they get the information from none governmental organizations, and 10.5% (n=19), of the participants of the study tell they get information from other sources which are not included in the above mentioned sources.
The existence of any management authority in jigjiga town
The respondents were requested to tell whether they have flood management authority in the town or not and 56.4% (n=102) of them indicated the existence of such type of authority in the town, while 43.6% (n=79) of the respondents told the researcher that they do not have flood management authority in the town (Table 5).
| Frequency | Percent | Valid Percent | Cumulative Percent | ||
|---|---|---|---|---|---|
| Valid | yes | 79 | 43.6 | 43.6 | 43.6 |
| no | 102 | 56.4 | 56.4 | 100.0 | |
| Total | 181 | 100.0 | 100.0 | ||
Table 5: The existence flood management authority Jigjiga.
The existence of escape route in the event of flood disaster in jigjiga town
The study sought to find out whether the residents have escape route in the event of flood disaster and 57.5% (n=104) of the respondents told that they do not have escape route while, 42.5% (n=77), responded that they do not have an escape route to escape from flood disaster. Therefore, the majority said they do not have an escape route and this why the causalities are on rise every time of flood occurrence in the to
The existence of alarm system to alert when flood events are in progress in the town
To address the issue of alarm system to alert in case of flood event in order to make residents aware of the disaster when in progress, 61.3% (n=111), of the respondents told that they do not have such system where as 38.7% (n=70) responded that they have the alarm system and the respondents who indicate that they do not have the system are more and once again it could be said this is one of the aspects that increases the impact of the disaster.
Briefs for the upcoming flood events
The majority of the respondents 56.4% (n=102) revealed that there is no briefs for the upcoming flood events in the town, while the remaining of the respondents 43.6% (n=79) indicated the existence of briefs for the upcoming flood events which can decrease the risk.
Conclusion
The existing condition of floods in jigjiga
This study concluded that flooding is an expected disaster in Jigjiga, since 2008, and the majority of the respondents together with the interviewed experts indicated their experience of witnessing flood event in the town, which is an indication of how flooding has been occurring the town. This study also revealed that flooding in the town is caused by the negligence of both the authority that administers the town and even the regional authorities, since they have not been trying to make some flood disaster strategies such as diversion of the stream from the town to uninhibited lands, although it can be too cost. Beside the above-mentioned factors, the cause of floods in Jigjiga are human induced and natural factors, the natural factors that causes floods in the town include bursting of the stream, elevation, topography, and the size and the shape of the stream. The human induced factors can be included, the expansion of the town which causes some of the residents of the town especially the poor section of the community to reside areas near the stream, deforestation is also blamed to be a factor making the stream to expand its areas, the poor designing of the drainage of the town that causes the runoff flow of the rain to make the roads look like a stream is also largely said a main reason of the flooding in the town.
References
- Chibssa AF ( 2007) Flood Hazard Assessment Using GIS in Bacho Plain, Upper Awash Valley, Southwest of Addis Ababa. Addis Ababa University.
- Acquah R (2017) The 2015 June 3rd Twin-Disaster in Accra: A Situational Analysis of Ghana’s Disaster Preparedness. Uni of Agder 1-133.
- Berhane Z (2008) Determinants of the Livelihood Resilience of Rural Households in the Face of Flood Disasters in Ethiopia. A case of Dembia Wereda, North Gondar Zone of Amhara National Regional State. Addis Ababa University.
- Council M (2005) Natural Hazard Mitigation Saves: An Independent Study to Assess the Future Savings from Mitigation Activities. Multihazard Mitigation Council 1-11.
- Ozmen, F (2006) The level of preparedness of the schools for disasters from the aspect of the school principals. Disaster Prev Manag 15 (3): 383-395.
- Getaneh W (2007) Modeling of Flood hazard management for forecasting and emergency response of ‘Koka’ area within Awash River basin using remote sensing and GIS method. Addis Ababa University.
- Habtu EG (2011) Coping strategies of displaced flood Victims: the case of dire dawa. Addis Ababa University.
- Zewdie A (2007) Modeling of Flood hazard management for forecasting and emergency response of ‘Koka’ area within Awash River basin using remote sensing and GIS method. Addis Ababa University.
- Mohamed A (2018) Socio-economic impacts of flooding in Dollo Addo town, Somali Region, Ethiopia. Ethiopian Civil Service University 1-6.
- YANDE PM (2009) An Impact of Floods on the Socio-Economic Livelihoods of People: A Case Study of Sikaunzwe Community in Kazungula District of Zambia. Disaster Risk Management Training and Education Centre for Africa1-87.
Indexed at, Google Scholar, Cross Ref
Citation: Abdilahi AA (2022) Socio-Economic Impacts of Flood Disaster and Management Practices in Jigjiga Town, Ethiopia. J Earth Sci Clim Change, 13: 614. DOI: 10.4172/2157-7617.1000614
Copyright: © 2022 Abdilahi AA. This is an open-access article distributed under the terms of the Creative Commons Attribution License, which permits unrestricted use, distribution, and reproduction in any medium, provided the original author and source are credited.
Select your language of interest to view the total content in your interested language
Share This Article
Recommended Journals
Open Access Journals
Article Tools
Article Usage
- Total views: 4347
- [From(publication date): 0-2022 - Dec 21, 2025]
- Breakdown by view type
- HTML page views: 3675
- PDF downloads: 672