Spatiotemporal Analysis of Meteorological Drought at Bilate Basin, Southern Ethiopia
Received: 27-Aug-2022 / Manuscript No. jescc-22-73162 / Editor assigned: 29-Aug-2022 / PreQC No. jescc-22-73162 (PQ) / Reviewed: 12-Sep-2022 / QC No. jescc-22-73162 / Revised: 16-Sep-2022 / Manuscript No. jescc-22-73162 (R) / Accepted Date: 16-Sep-2022 / Published Date: 23-Sep-2022 DOI: 10.4172/2157-7617.1000638
Abstract
Drought indices are vital tools to play a significant role by monitoring drought in specific geographic environment/ over the globe. The major goal of this investigation is to assess the spatiotemporal variant of climatological drought using RDIst and SPI in Boricha District. This study adopted the long-term gridded rainfall and temperature information in six stations since (1985-2016). The spatial distribution of drought is mapping by using ArcGIS 10.3 spatial analysis tool and interpolated using IDW technique. During spring season two extreme droughts were located in station_2 and 3 with the same SPI values of (-2.26). During summer season in station_3, one extreme drought was detected with SPI values of (-2.32), in station_4 one extreme drought was noticed with SPI values of (-2.14). In 12months RDIst timescale, one extreme drought was identified in station_4 during 2012 with RDIst value of (-2.25), and in station_6 one extreme drought has been happened during 2009 with RDIst value of (-2.23). The study area is affected by slight/ mild to extreme droughts at all time scale. Analysis of correlation is conducted between SPI and RDIst to confirm the power of drought indices. MK trend test recognizes the tendency of drought was reduced and statistically insignificant in spring and annual timescales except station_1 at 12 months SPI. There is no weather station without drought in the region. All parts of the region are under drought risk, it needs immediate intervention by the regional and federal disaster risk preparedness and natural resource office to save residents and natural environment.
Keywords: Woynadega; Kola; Boricha; Ethiopia
Introduction
Background
Drought is hazardous and the least understood natural phenomena, affecting more people than any other hazards. It is characterized by wide spread occurrence, with slow on-set that has dreadful damage on various features on the environment, society, and economy in the world [1-2]. African countries were affected by drought risk. This is attributed the reality that widely held inhabitants be determined by precipitation provide for cultivation [3]. Hazard of drought is the potential for adverse effects or projected damages subsequent since the relations among risk of drought, drought exposure, and drought vulnerability [4]. Droughts are widespread in many parts of Africa. Ethiopia is the greatest drought-affected in African countries [5]. Drought is the common usual calamities in sub-Sahara African countries and leads to severe financial, social and ecological crises [6-8]. Drought influence be situated at Horn of Africa with spatiotemporal variability in seasonal rainfall [9]. Drought in developing countries is very catastrophic causing suffering, people dislocation, lack of nourishment, passing away in wildlife, and decline in production of agriculture, drying of water bodies, wildfires and stable plant distress [10, 11]. The rainfall variability is the cause for incidence of drought in northern, eastern, southern and southeastern part of Ethiopia [12, 13]. Now in current decades the spatiotemporal magnitude and incidence of drought was enlarged affecting water, financial and community expenditures [14]. Droughts in Ethiopia had extreme influences in production of agriculture that results huge deaths of animal’s actuality documented on various portions of the country. For example since (1984) famine on province of Wollo directed towards ninety four percent (94%) reduction of crop failure. Countryside people existing in moisture less parts were the most affected [15] in truly speaking several studies carried out to assess meteorological drought using drought indices including [16-17]. However, none of them studied on meteorological drought assessment in Boricha District, Southern Ethiopia. Therefore, this study was carried out with main objective of assessing the spatiotemporal difference in climatological droughts at Boricha District, Southern Ethiopia.
Research approach
Study area
It is located at Sidama Regional State and lies between 6º 46'N to 7º 01'North latitudes and 38º04’E to 38 º24’east longitudes. It is found at the distance of 31 kilometers from the Region capital city, Hawassa, and 311 kilometers from Addis Ababa, capital city of Ethiopia. The district covers 588.05 km2 and agro-ecologically categorized into two: Woynadega and Kola. The altitude of woreda ranges from 1,320 to 2,080 a.m.s.l.
Sources of data
Monthly gridded precipitation information were obtained from Ethiopia’s Nationally Meteorology Organization in the period (1985-2016) and used as an input to compute SPI and RDIst values. Six (6) Stations are designated for this study by considering the representativeness of agro-ecology of the study area. Improving, accessibility, and use of gridded rainfall and temperature data are being applied in Ethiopia in association between Ethiopia’s Nationally Meteorology Organization and Worldwide Investigation Organization designed for Weather and People in Columbia Institution of higher education in United States. The gridded data were evaluated by 32 years’ precipitation and temperature information revealed as follow.
Indices of drought
Recognize the complication of drought on the Earth Surface, different drought indices were used to analyze drought risk levels and characteristics. The most important drought indices were Palmer Drought Severity Index, Rain fall Anomaly Index (RAI), Standard Precipitation Index (SPI), Decile Index (DI). Standard Precipitation Index (SPI) is a meteorological drought index used to quantify the impact of rainfall deficit on soil moisture on which it responds to precipitation on a relatively short time scale. This study is conducted in semi-arid area where high temperature has huge inference on the usage of water resource. Then, it is correspondingly important to compute potential evapotranspiration (PET) to determine meteorological drought. Therefore, Reconnaissance Drought Index (RDI) which needs rainfall and PET as an input for drought risk analysis were characterized as a general meteorological drought index for drought risk assessment. As mandate for identifying towards for complication of drought on the Earth Surface different drought indices were used to analyze drought risk levels and characteristics. This study is conducted in semiarid area where high temperature has huge inference on the usage of rainwater supply. Then, the situation was correspondingly significant to compute potentials evapotranspiration to determine climatological inadequacies. Therefore, Reconnaissance Drought Index (RDI) which needs rainfall in addition compute potentials evapotranspiration as an contribution in drought risk assessment were categorized in overall climatological drought indices for drought risk analysis.
Standardized precipitation index (SPI)
It was commonly secondhand to compute precipitation shortage during a definite period of epoch and to monitor droughts worldwide and it was computed by means of the following formula:
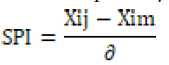
Where, Xij= is the seasonal rainfall and, Xim is its long-term seasonal average and ∂ is standard deviation
Reconnaissance drought index (RDI)
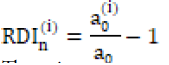
Reconnaissance Drought Index (RDI) stands climatological drought indices to display famine and ordered in terms of its preliminary value (αk) standardized value (RDIn) and standardized value (RDIst). The situation delivers a truthful demonstration of drought situations, as it integrates precipitation along with potential evapotranspiration (PET), andalso it is can monitor drought situations in areas with various weather conditions. For this reason, the model is unique, the RDI is commonly appropriate and it’s a general model related to further drought indices.
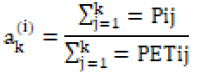
Where Pij and PETij stands for rainfall and capacity evapotranspiration in the month “j” of hydrological year “i” that usually starts from March in Boricha District and a next appearance, the Normalized RDI (RDIst) is calculated by means of the subsequent formula:
The primary preparation of RDI st secondhand the statement that αk standards track the Gamma dissemination. Therefore, RDIst is computed as:
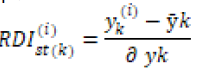
Where yk is the ln (αk (i), k is the arithmetic mean of yk and yk is the standard deviation.
Drought Indices Calculator was used for the computation of various types of drought indices. SPI and RDIst drought indices were calculated by means of Drought Index Calculator Software which was established by Nationwide Practical Institution of higher education of Greek’s in Workspace Recovery Mechanisms as well as Institute Water’s supply. This Drought Index Calculator application has been got on http: w.w.w.ewra.net.drinc. Both SPI and RDI were used to compute drought on seasonal and annual time scale. SPI and RDIst indices are used to measure drought incident throughout (Belg and Keremt) season and at annual timescale.
Mapping the spatial distributions of drought indices
Boricha District is further impacted via climatological drought. For better understand the frequency of drought at spring season, summer season and annual Time Scale. SPI and RDIst indices values are mapping by means of ArcGIS 10.3 in spatial analysis instrument more specifically by using Inverse Distance Weight (IDW) method. This study helps enhance meteorological drought monitoring system in Ethiopia in general and Boricha District in particular.
Analysis of Tendency
The Mann Kendall trend tests used by many researchers towards measure the trends of Rainfall and temperature data. Tendency examination various assessments are accessible through identification and assessment for the tendencies of precipitation plus temperature data. In this specific study, the trend test application is used and it was non-parametric technique that stands fewer perceptive towards peaks points in addition examine the tendency of successive data deprived of identifying either tendency exists in nonlinear or linear. Its formula is given as follow:
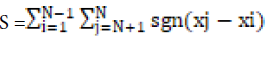
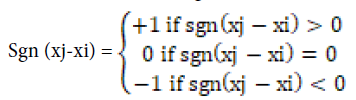
Where S is the Mann-Kendal’s test measurements; xi and xj were the successive information values of the time series in the years i and j (j >i) and N is the length of the time series. A positive S value shows an increasing trend and a negative value indicates a decreasing trend in the time series data. The sign function is stated as
The variance of S, for the situation where there may be ties (that is, equal values) in the x values is given as
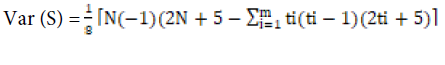
Where m is the number of tied groups in the data set and ti is the number of data points in the tied group. For n larger than 10, ZMK estimation the standard normal distribution and computed as follows:
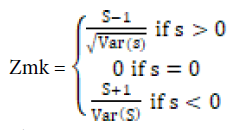
The existence of a statistically important tendency was evaluated by ZMK value. In a binary sided assessment to tendency, the null hypothesis (Ho) should be accepted if (ZMK) < Za-1/2 at a given level of importance. Z1-α/2 is the critical value of ZMK from the standard normal table. For instance, 5% significance level, the value of Z1-α/2 is 1.96.
Result and Discussion
The outcome of this study is presented with result and discussions, which pronounces about climatological drought strictness of Boricha District. The region is further drought susceptible parts of Sidama Regional State. Because of it’s found in Ethiopian Rift valley area. The outcome of this study includes the spatial and temporal variation of climatological drought in the study area.
Meteorological Drought temporal Variation in Spring Season
The 3months SPI states that short term as well medium term point out wetness situations and also it gives periodic and yearly assessment of precipitation in addition to this 12months SPI time scale reveals extended period of precipitation patterns. Several drought indices have various procedures, methods of calculation and it needs diverse information sets that can be appropriate for a few regions although inappropriate in another. This study includes the past (1985-2016) analysis of meteorological drought. Drought indices (SPI and RDIst) are done to examine the occurrence of drought in terms of their characteristics. Therefore, the above stated indices are examined in the study area at 3 and 12months time scale (Figure 1-5).

Figure 2: The integration station information with representations of rainfall.

Figure 3: Merging stations data with representations of temperature.

Figure 4: Location Map of Weather Stations in Boricha District, Southern Ethiopia.

Figure 5: 3month SPI and 3month RDIst Anomalies during Spring Season.
In the temporal analysis of drought events in all stations, SPI and RDIst were calculated. The result from both instruments indicates drought incidences with slight temporal variation across different stations. For instance, SPI result for the station_1 indicates that, the happening of two extreme droughts during 1999 through SPI value of (-2.10) and also during 2012 with SPI value of (-2.01).
In station_2, 3 and 4, an extreme drought was observed once through SPI standards of -2.26, -2.26 and -2.08 during 1999 and 2012 respectively (Left side of Figure 5). The outcome of investigation is consistent with the person stated about the spatial and temporal distribution of agricultural drought with varying SPI value having different intensities. In the case of RDI, the 3-months RDIst indicates there was an extreme drought by RDI results -2.18, -2.13 additionally -2.10 during 1999 for the station-2 and 2012 for station-3 and station-4 respectively (Right side of Figure 5). The information obtained from the household in the area confirms that, recurrent incidence of the drought confirmed to cause damage to the productivity of the agriculture of the area. The finding this study is similar to that, the drought adversely influenced natural resource and agricultural production.
Temporal variation of meteorological drought for summer season
Among North Eastern African Countries, Ethiopia is repeatedly impacted by drought starting from1970s to 1980s which causes in extensive food shortage, financial, ecological deprivation, exhaustion in domestic resources, plus intensification of deaths. Meteorological drought frequency prevalence causes severe drought that happens in all parts of the study area. Seasonal rainfall deficit would lead to drought conditions in the district. Short term drought analysis is characterized by the 3months timescale and derived from seasonal and annual SPI and RDIst values in the district (Figure 6).
In the summer season, the result of 3-months SPI also indicates some temporal variation of the drought. For instance, a drought with extreme SPI value of -2.32, and -2.14 was observed for station-3 and station-4 in the year 1993 while -2.05 was identified in the year 2009 for the station-6 (Figure 6). Except for the station-1 and station-4, all stations showed some value of extreme drought in different years. Staion-2, station-3, Station-5 and station-6 was identified for the extreme drought of severity of -2.18, -2.13, and -2.06 in the years 1999, 1993, and 2009 respectively. However, two extreme drought of varying severity of -2.20 and -2.02 was observed in the year 2009 and 2012 respectively (Figure 6).

Figure 6: 3month SPI and 3month RDIst Anomalies during Summer Season.
The SPI and RDIst result shows that most of the stations identified to have possible rainfall variability across the study region. This study is consistent with the previous research findings of who have reported high frequency of extreme drought that occurred during spring and summer season but its duration was less as compared with its frequency. The result shows the district is stricken through drought episode at all stations as shown in the (Figure 6).
In general, when we compare the incidences of drought events, severe and extreme events was occurring persistently associated with supplementary drought categories. Spatiotemporal patterns drought result reveals, the arid regions are more vulnerable than the highland. From the result, we have identified that the repeating period of the drought for Spring season was high between 2009-2015 while the lower frequencies was identified in the year between 1997-2003. Therefore, we conclude that, drought incidences are very frequent recently. The impact of the drought over different social and economic activities of the community was worsened since 2005. Recently, a report from the district also indicated that, recurrence of the drought incidence within the area repeatedly affecting agricultural productivity.
From the drought events of summer season, there were varying drought incidences across the study time frame. Unlike to that of the season, for both SPI and RDI, high severe drought was happened from 1987-1995 while relatively mild to no drought events was registered during 1997-2005. From 2005-2015 drought events showed no uniform temporal patterns. Thus, the spatiotemporal pattern of the drought has relatively less impact as compared to the spring season.
Temporal variation of 12months SPI and 12months RDIst result at annual timescale
The frequency of extreme drought in 12months SPI and RDIst or at annual timescale is the highest in the study area. Excluding station one and two, each station is affected by one extreme drought incident annually (Figure 7).
Based on 12-month SPI analysis made for the stations, station-3, and station-4 was observed having a drought through SPI result -2.11 and -2.24 at the same time during 2012. In contrary to the other stations, two extreme droughts were recorded in the station-5 with value of -2.26 and -2.04 in the year 2009 and 2012 respectively. For 12month RDIst values shows that, extreme drought was observed at station_3 and station-4 with -2.10 and -2.25 in the same year 2012. However, station-5 was identified with two extreme droughts record with -2.20 and -2.02 in the year 2009 and 2012 respectively. Station-6 was observed for dangerous drought that has been happened in 2009 through RDIst outcome is (-2.23) Figure 7.This study result agreed with the previous research conducted by who reports that the frequent drought incident has various magnitude in the Ethiopian Rift Valley Lakes Region and extreme drought events are recorded almost in all stations at 12month RDI timescale.

Figure 7: 12 month SPI and 12month RDIst Anomalies at Annual Timescale.
Correlation between SPI Vs RDIst at seasonal and annual timescale
The Scatter plot demonstrates the correlation between seasonal and annual SPI and RDIst values across the study region. The Pearson’s “r” association among spring season, summer season and annual timescale of SPI and RDIst values are evaluated by using statistical package for social science Version 20 and two tailed P value is used to determine its importance. This study result indicates that SPI and RDIst drought indices are positively correlated in 3 month and 12 month time scale as indicated in (Figures 8-10).
The above figure indicates association between SPI and RDIst outcomes for 3-months and 12 months’ timescale over the study area. The result shows that SPI and RDIst drought indices are strongly correlated in 3 months and 12 months’ time scale as indicated in (Figure 8-10). Accordingly, seasonal SPI and RDIst value of the whole district since 1985-2016 was assessed then the outcome indicates the presence of very strong relationship in spring season (r = 0.99) between 3month SPI and 3month RDIst as indicated Figure 9. The scatter plot Figure 10 shows that, summer season SPI and RDIst and their correlation is very strong at (r = 0.99) which shows the growing tendency of drought in both seasons.

Figure 8: Correlation between Spring 3month SPI Vs 3month RDIst.

Figure 9: Correlation between Summer 3month SPI Vs 3month RDIst.

Figure 10: Correlation between 12months SPI Vs 12months RDIst.
The correlation between 12 month SPI and 12month RDIst indicates 99% of SPI explained by RDIst value (Figure 10). This indicates the growing tendency of drought together with in 12 month SPI andalso 12month RDIst having a strong positive correlation (r = 0.99) besides its important at (P = 0.01). This study similar with the previous research study conducted by who stated that this very strong correlation would agree to assessing the shortage of rainfall for 3 Month and 12 month SPI and RDIst timescales.
The Spatial Distribution of Meteorological Drought in Boricha District Sex
To produce, the spatial distribution of drought frequency maps, SPI and RDIst values are used as an input into ArcGIS. Spatial pattern is well done for spring season, summer season and annually as depicted in (Figures 11-16). The spatial distribution of drought both spring and summer season have shown some common characteristics for SPI and RDIst based analysis. The frequencies and the condition of the spatial distribution of the drought have spread slight variation. That is due to the fact the spatial variation of the agro-ecology to which drought occurred in and amount of rainfall that each region receives in different seasons.

Figure 11: Spatial distributions of drought frequency spring season3month SPI in Boricha District: a slight drought, b moderate drought, c severe drought, d extreme drought.

Figure 12: Spatial distributions of drought frequency spring season 3Month RDIst in Boricha District: a mild drought, b moderate drought, c severe drought, d extreme
drought.

Figure 13: Spatial distributions of drought frequency summer season 3Month SPI in Boricha District: a slight drought, b moderate drought, c severe drought, d extreme
drought.

Figure 14: Spatial distributions of drought frequency summer season 3Month RDIst in Boricha District: a mild drought, b moderate drought, c severe drought, d extreme
drought.

Figure 15: Spatial distributions of drought frequency at annual timescale in Boricha District: a mild drought, b moderate drought, c severe drought, d extreme drought.

Figure 16: Spatial distributions of drought frequency at annual timescale in Boricha District: a mild drought, b, moderate drought, c severe drought, d extreme drought.
Spatial distribution of meteorological drought in spring season 3 months SPI
In spring season, 3months SPI displays severe intensity of drought frequency and it affects Western, Southern, Southwestern, Northwestern, Southeastern, Northern, and Northeastern tips of the Region. The Southwestern tips, Northern, Western, all Eastern parts are striken by Extreme drought intensity as shown (Figure 11 c-d). The result get from 3months SPI, in the spring season the highest frequency of extreme drought is detected at station_1 which covers about 11.54% from the whole region (Tables 1-4).
| ID | Station’s Name | Latitude (N) | Longitude (E) | Elevation (M) |
|---|---|---|---|---|
| ST_1 | Station_1 | 6.7875 | 38.1 | 1361 |
| ST_2 | Station_2 | 6.825 | 38.175 | 1666 |
| ST_3 | Station_3 | 6.8625 | 38.2875 | 1831 |
| ST_4 | Station_4 | 6.9 | 38.175 | 1651 |
| ST_5 | Station_5 | 6.9375 | 38.325 | 1871 |
| ST_6 | Station_6 | 6.975 | 38.2125 | 1754 |
Table 1: List of weather stations and their geographic coordinate.
| SPI Values | Drought conditions SPI |
|---|---|
| -0.99 – -0.99 | near normal |
| -1.00 – (-1.49) | Moderate drought |
| -1.50 – (-1.99) | Severe drought |
| < -2.00 | Extreme drought |
Table 2: Standard Precipitation Index (SPI) Value classification. Adapted from [31]
| RDI Values | Drought Conditions in RDI |
|---|---|
| 0.5- -1.0 | mild drought |
| 1.0- -1.5 | Moderate drought |
| 1.5- -2.0 | Severe drought |
| Extreme drought |
Table 3: Reconnaissance Drought Index (RDI) Value classification.
| Slight Drought Frequency | Area (km2) |
Area (%) |
Moderate Drought Frequency | Area (km2) | Area (%) | |||
|---|---|---|---|---|---|---|---|---|
| 10 | 87.53 | 14.88 | 2 | 151.81 | 25.82 | |||
| 11 | 193.62 | 32.93 | 3 | 193.94 | 32.98 | |||
| 12 | 140.84 | 23.95 | 4 | 242.29 | 41.20 | |||
| 13 | 166.03 | 28.24 | Total | 9 | 588.04 | 100 | ||
| Total | 46 | 588.02 | 100 | |||||
| Severe Drought Frequency | Area (km2) |
Area (%) | Extreme Drought Frequency | Area (km2) | Area (%) | |||
| 0 | 224.58 | 38.19 | 0 | 62.27 | 10.59 | |||
| 1 | 124.96 | 21.25 | 1 | 458.00 | 77.88 | |||
| 2 | 101.58 | 17.27 | 2 | 67.85 | 11.54 | |||
| 3 | 136.91 | 23.28 | Total | 3 | 588.12 | 100 | ||
| Total | 6 | 588.03 | 100 |
Table 4: The Area Affected by Spring Season Meteorological Drought in Boricha District.
Spatial distribution of meteorological drought in spring season 3months RDIst
In the spring season, 3months RDIst value indicates maximum extreme drought frequency is observed at station_2,3 and 4, it covers about 26.60% from the total area (Table 5) while the remaining stations experienced no extreme drought (Figure 12d). The highest frequency of the drought categories of mild, moderate and severe drought is observed at station 1 and 2; where some part of station 5 and 6 are exposed for severe drought. The RDIst value of the spring season indicates relatively low frequencies of extreme drought. Except station 1, 5 and 6, almost all stations are facing extreme drought (Figure 12ad). Similarly, three severe drought frequencies are observed at station_5 and it covers about 10.08% from the study region (Table 5). In general, Station 2 and 3 are frequently hitted by varying drought magnitude while station_1 was less frequently stricken by drought as compared other stations.
| Mild Drought Frequency | Area (km2) |
Area (%) | Moderate Drought Frequency | Area (km2) |
Area (%) | |||
|---|---|---|---|---|---|---|---|---|
| 3 | 171.84 | 29.22 | 2 | 185.91 | 31.61 | |||
| 4 | 176.55 | 30.03 | 3 | 402.17 | 68.39 | |||
| 5 | 149.11 | 25.36 | Total | 5 | 588.08 | 100 | ||
| 6 | 57.23 | 9.73 | ||||||
| 7 | 33.28 | 5.66 | ||||||
| Total | 25 | 588.00 | 100 | |||||
| Severe Drought Frequency | Area (km2) |
Area (%) | Extreme Drought Frequency | Area (km2) |
Area (%) | |||
| 0 | 119.12 | 20.25 | 0 | 431.68 | 73.40 | |||
| 1 | 290.29 | 49.36 | 1 | 156.46 | 26.60 | |||
| 2 | 119.43 | 20.31 | Total | 1 | 588.14 | 100 | ||
| 3 | 59.28 | 10.08 | ||||||
| Total | 6 | 588.12 | 100 |
Table 5: Drought frequency area during spring 3 months RDIst in Boricha District.
Size spatial distribution of meteorological drought in the summer season 3months SPI
In Boricha district, the dissemination of extreme drought frequency in summer season is not commonly registered like that of the spring season. For instance, the highest severe drought frequency is observed at station 1, 2 and 5, extreme drought frequency is witnessed at station 3, 4 and 6 and it covers about 64.92% and 42.16% respectively (Table 6). Similar to that of the spring season, the tendency of vulnerability to slight drought is higher while extreme drought shows less frequency. 3months SPI value of the summer season indicates high frequency of drought. Moderate drought frequency for the summer season is higher as compared to spring season moderate drought frequency (Figure 13). Summer season 3month SPI result shows high drought incident frequency extremely affect the growing stages of summer season agricultural crops.
| Slight Drought Frequency | Area (km2) | Area (%) | Moderate Drought Frequency | Area (km2) | Area (%) | |||
|---|---|---|---|---|---|---|---|---|
| 9 | 64.55 | 10.98 | 1 | 77.52 | 13.18 | |||
| 10 | 150.64 | 25.62 | 2 | 322.39 | 54.82 | |||
| 11 | 58.23 | 9.90 | 3 | 122.99 | 21 | |||
| 12 | 151.05 | 25.69 | 4 | 31.57 | 5.37 | |||
| 13 | 102.54 | 17.44 | 5 | 33.66 | 5.72 | |||
| 14 | 60.98 | 10.37 | Total | 15 | 588.13 | 100 | ||
| Total | 69 | 588.0 | 100 | |||||
| Severe Drought Frequency | Area (km2) |
Area (%) |
Extreme Drought Frequency | Area (km2) |
Area (%) |
|||
| 1 | 206.28 | 35.08 | 0 | 340.17 | 57.84 | |||
| 2 | 381.78 | 64.92 | 1 | 247.93 | 42.16 |
Table 6: Drought frequency area in summer using 3month SPI in Boricha District.
Spatial distribution of meteorological drought in the summer season 3months RDIst
In summer season, 3months RDIst value indicates the highest moderate drought frequency is occurred in station_2, 3, and 5, it increases the spatial coverage in Eastern, Southern, Southwestern and Northeastern parts of the area and it covers about 47.38% of the area as depicted in (Table 7). Severe drought frequency is occurred in all stations and it affects Southern, Northeastern, Western, Northeastern, Southeastern, Southwestern, Southern and Northern parts of the District. Extreme drought frequency is happened in station_3 and 6, it covers about 62.52% from the total area (Table 7). Its impact increases in all Northern, and Southern portions of the district as indicated in (Figure 14 a-d).
| Mild Drought Frequency | Area (km2) |
Area (%) | Moderate Drought Frequency | Area (km2) |
Area (%) | |||
|---|---|---|---|---|---|---|---|---|
| 5 | 79.26 | 13.48 | 2 | 109.64 | 18.65 | |||
| 6 | 274.00 | 46.59 | 3 | 199.78 | 33.97 | |||
| 7 | 107.26 | 18.24 | 4 | 278.62 | 47.38 | |||
| 8 | 127.54 | 21.69 | Total | 9 | 588.03 | 100 | ||
| Total | 26 | 588.07 | 100 | |||||
| Severe Drought Frequency | Area (km2) |
Area (%) | Extreme Drought Frequency | Area (km2) |
Area (%) | |||
| 1 | 389.87 | 66.29 | 0 | 220.40 | 37.48 | |||
| 2 | 198.17 | 33.70 | 1 | 367.69 | 62.52 | |||
| Total | 3 | 588.04 | 100 | Total | 1 | 588.09 | 100 |
Table 7: Drought frequency area in summer 3months RDIst in Boricha District.
Spatial distribution of drought event at 12month SPI
The spatial distributions of drought frequency incidence is higher in all parts of the district and it is presented by 12months SPI at station_1,3 and 4 have shown ten slight drought frequency episodes take place in Southern, Southwestern and Western tips which estimated to cover about (4.02%) of the area. The highest moderate drought frequency is observed at station 1 and 2 parts of the study area (Figure 15) and it covers about 2.47% and 6.57% from the total area respectively (Table 8).
| Slight Drought Frequency | Area (km2) |
Area (%) |
Moderate Drought Frequency | Area (km2) |
Area (%) |
|||
|---|---|---|---|---|---|---|---|---|
| 6 | 123.29 | 20.96 | 1 | 300.05 | 51.03 | |||
| 7 | 348.26 | 59.22 | 3 | 234.81 | 39.93 | |||
| 8 | 53.48 | 9.09 | 4 | 14.53 | 2.47 | |||
| 9 | 39.42 | 6.70 | 6 | 38.65 | 6.57 | |||
| 10 | 23.66 | 4.02 | Total | 21 | 588.05 | 100 | ||
| Total | 40 | 588.12 | 100 | |||||
| Severe Drought Frequency | Area (km2) |
Area (%) | Extreme Drought Frequency | Area (km2) |
Area (%) | |||
| 2 | 322.18 | 54.78 | 0 | 176.25 | 29.97 | |||
| 3 | 265.91 | 45.22 | 1 | 179.24 | 30.48 | |||
| Total | 5 | 588.09 | 100 | 2 | 232.60 | 39.55 | ||
| Total | 3 | 588.09 | 100 |
Table 8: Drought frequency area using 12month SPI in Boricha District.
The dissemination of meteorological drought event in boricha district at 12Months RDIst
In belongings to 12months RDIst, the highest severe drought frequency is observed in station_2, 3, 4, and 6. It covers about 32.06% from the region’s total area (Table 9). The intensity of drought is very high in southern and south eastern parts of the region. The northern and northeastern part is relatively remaining an area with low drought frequencies (Figure 16). The value of both SPI and RDIst indicates an increasing tendency of drought incident in summer season and spring season as compared with annual timescale. During annual timescale all weather stations have been a corresponding quantity of drought incidents extending from 11-15 number of drought frequencies.
| Mild Drought Frequency | Area (km2) |
Area (%) | Moderate Drought Frequency | Area (km2) |
Area (%) | |||
|---|---|---|---|---|---|---|---|---|
| 2 | 254.96 | 43.36 | 0 | 182.55 | 31.04 | |||
| 3 | 200.03 | 34.02 | 1 | 58.12 | 9.88 | |||
| 4 | 86.82 | 14.76 | 2 | 54.13 | 9.21 | |||
| 5 | 46.22 | 7.86 | 3 | 116.89 | 19.88 | |||
| Total | 14 | 588.03 | 100 | 4 | 118.64 | 20.18 | ||
| 5 | 57.72 | 9.82 | ||||||
| Total | 15 | 588.05 | 100 | |||||
| Severe Frequency | Area (km2) |
Area (%) | Extreme Drought Frequency | Area (km2) |
Area (%) | |||
| 2 | 399.57 | 67.94 | 0 | 122.84 | 20.89 | |||
| 3 | 188.58 | 32.06 | 1 | 158.43 | 26.94 | |||
| Total | 5 | 588.15 | 100 | 2 | 306.87 | 52.18 | ||
| Total | 3 | 588.14 | 100 |
Table 9: Drought frequency area using 12months RDIst in Boricha District.
Tendencies in Meteorological Drought Episode
The trends of meteorological drought at seasonal and annual timescale were provided in the Table 10. In the spring, SPI and RDIst, for 3-months, and 12months revealed that there is a tendency of decreasing trend of drought episodes in most stations. However, 12-months SPI indicated, there was an increasing in most of the station (Table 10). For the summer 3month SPI and 3month RDIst, there was statistically non-significant increasing trends in majority of the stations except station-5 and 6. This study agreed with the study conducted by who reported that Mann-Kendall trend test detects increasing the tendency of drought risk during spring and summer season time-steps. For RDI, all stations for spring season showing a decreasing trend with non-significant manner while station 1 and 2 tend to show a relative increasing trend. At annual scale, all stations showing non-significant decreasing trend.
| ID |
Seasons
Stations |
Spring SPI 3 MK test |
Summer SPI 3 MK test |
12Month SPI MK test |
||
|---|---|---|---|---|---|---|
| S_1 | Station_1 | -0.29 | 0.99 | 0.00 | ||
| S_2 | Station_2 | -0.37 | 0.21 | -0.54 | ||
| S_3 | Station_3 | -0.21 | 0.00 | -0.04 | ||
| S_4 | Station_4 | -0.25 | 0.04 | -0.29 | ||
| S_5 | Station_5 | -0.91 | -0.70 | -1.36 | ||
| S_6 | Station_6 | -0.62 | -0.33 | -1.24 | ||
| ID |
Seasons
Stations |
Spring RDIst 3 MK test |
Summer RDIst 3 MK test |
12Month RDIst MK test |
||
| S_1 | Station_1 | -0.45 | 0.95 | -0.04 | ||
| S_2 | Station_2 | -0.70 | 0.12 | -0.29 | ||
| S_3 | Station_3 | -0.45 | -0.12 | -0.29 | ||
| S_4 | Station_4 | -0.62 | -0.04 | -0.54 | ||
| S_5 | Statiofn_5 | -1.11 | -1.03 | -1.44 | ||
| S_6 | Station_6 | -0.87 | -0.54 | -1.19 |
Table 10: Tendency of meteorological drought at spring, summer and annual timescales.
Conclusion
The result shows there was a spatiotemporal variation of drought that ranges from slight to extreme drought incidences. Evidently, the result of both SPI and RDI output indicated, droughts incidents are frequently happening in the area having slight spatiotemporal variation of magnitude and strength. Meteorological drought was variable under different years and varying with magnitude across different stations in different seasons. During the spring season, except for 5 and 6, all stations were identified to experience extreme intensity of droughts in the year 1999 and 2012. Similarly, in the summer season, except station_1, all stations have observed with an extreme drought record mainly in the year 1999, 1993 and 2009. In the same token, both SPI and RDIst of 12 months indicated an extreme drought incidences majority of stations during 2009 and 2012. The Mann-Kendall trend test also confirms an increasing tendency of drought of varying magnitude for spring and annual timescale in majority of stations. Moreover, an outcome of scatter plot correlation analysis also confirms that, the result of SPI and RDIst drought indices in different timescales have strong correlation. Rainfall during the spring and summer season showing a steady decline and it inevitably causing challenge to agricultural productivity.
Declarations
Availability of data and materials
The datasets used in this study were present from the consistent writer on reasonable demand.
Competing interest
The authors state that there is no conflict interest.
Funding
Not applicable
Author contribution
GE, collected data in the research and performed analysis of the major finding. AL, YM and DL read the paper and made edition and corrections.
Acknowledgement
The authors were grateful to the Ethiopian Nationwide Meteorological Organization (ENMA) for providing Gridded monthly and annual rainfall, minimum and maximum temperature data
References
- Bethel G (2018) Analysis of Meteorological Drought Using SPI and Large-Scale Climate Variability (ENSO)-A Case Study in North Shewa Zone, Amhara Regional State, Ethiopia. Hydro Current Res 9: 1-9.
- Deressa T, Rashid MH, Claudia R (2008) Measuring Ethiopian farmers' vulnerability to climate change across regional states. Intl Food Policy Res Inst 1-11.
- Devereux S (2000) Food insecurity in Ethiopia. A discussion paper for the Department for International Development. Great Britain UK 1-10.
- Datt G, Simler K, Mukherjee (2000) Determinants of Poverty in Mozambique: 1996-97. IFPRI 70-78.
- Edwards Jones G, MilàCanals L, Hounsome N, Truninger et al. (2009) Testing the assertion that ‘local food is best’: the challenges of an evidence-based approach. Trends Food Sci Technol 19: 265-274.
- FAO (2013) The Sate of Food Insecurity in the World: The Multiple Dimensions of Food Security. FAO 4-6.
- Hassan A, Bhuiyan AB (2013) Microcredit and Sustainable livelihood: An Empirical Study of Islamic and Conventional Credit on the Development of Human Capital of the Borrowers in Bangladesh. J Econ Cooperation Dev 34: 101-128.
- Mekuanent M (2014) Determinants of Household Food Security among Southwest Ethiopia Rural Households. Food Sci Technol 2: 93-100.
- Planning and Development Commission. (2018) Poverty and Economic Growth in Ethiopia 1995/96-2015/16.
- Obayelu OA, Adepoju AO, Idowu T (2014) Factors Influencing Farmers‟ Choices of Adaptation to Climate Change in Ekiti State, Nigeria. J Agric Environ Int Dev 108: 3-16.
- Olsen C, George M (2004) Cross-Sectional Study Design and Data Analysis. Yes Comp 2-53.
- Paulos A, Belay S (2017) Household and plot-level impacts of sustainable land management practices in the face of climate variability and change: empirical evidence from Dabus Sub-basin, Blue Nile River, Ethiopia. Agric Food Secur 6: 1-12.
- World Bank (2006) Ethiopia: Managing Water Resources to Maximize Sustainable Growth a World Bank Water Resources Assistance Strategy for Ethiopia. Water P-Notes 13.
- Edwards Jones G, MilàCanals L, Hounsome N, Truninger (2009) Testing the assertion that ‘local food is best’: the challenges of an evidence-based approach. Trends Food Sci Technol 19: 265-274.
- Bhuiyan AB (2013) Microcredit and Sustainable livelihood: An Empirical Study of Islamic and Conventional Credit on the Development of Human Capital of the Borrowers in Bangladesh. J Econ Cooperation Dev 34: 101-128.
- Mekuanent M (2014) Determinants of Household Food Security among Southwest Ethiopia Rural Households. Food Sci Technol 2: 93-100.
- Devereux S (2000) Food insecurity in Ethiopia. A discussion paper for the Department for International Development. Great Britain UK 1-10.
Indexed at, Google Scholar, Crossref
Indexed at, Google Scholar, Crossref
Indexed at, Google Scholar, Crossref
Indexed at, Google Scholar, Crossref
Indexed at, Google Scholar, Crossref
Indexed at, Google Scholar, Crossref
Indexed at, Google Scholar, Crossref
Indexed at, Google Scholar, Crossref
Citation: Engdaw G, Legesse A, Mohammed Y, Likisa D (2022) Spatiotemporal Analysis of Meteorological Drought at Bilate Basin, Southern Ethiopia. J Earth Sci Clim Change, 13: 638. DOI: 10.4172/2157-7617.1000638
Copyright: © 2022 Engdaw G. This is an open-access article distributed under the terms of the Creative Commons Attribution License, which permits unrestricted use, distribution, and reproduction in any medium, provided the original author and source are credited.
Select your language of interest to view the total content in your interested language
Share This Article
Recommended Journals
Open Access Journals
Article Tools
Article Usage
- Total views: 2604
- [From(publication date): 0-2022 - Nov 08, 2025]
- Breakdown by view type
- HTML page views: 2123
- PDF downloads: 481