Standards for Fetal Abdominal Circumference and Estimated Fetal Weight in Shanghai, China
Received: 27-Sep-2017 / Accepted Date: 09-Oct-2017 / Published Date: 16-Oct-2017 DOI: 10.4172/2376-127X.1000352
Abstract
Introduction: While current evidence suggests that fetal skeletal parameters do not vary considerably across populations, there is uncertainty about the standards of abdominal circumference (AC) and estimated fetal weight (EFW), which are the basis of clinical guidelines for the management of fetal growth restriction. The use of different algorithms for mapping ultrasound parameters to fetal size parameters also make it difficult to make local applications of growth standards developed elsewhere. Therefore, we aimed to construct standards of AC and EFW for use in China.
Methods: This is an analysis of pregnant women who received antenatal care from 2009 to 2013 in Shanghai, China. A healthy cohort of 2529 singleton pregnancies defined by maternal, pregnancy and fetal characteristics and birth outcomes were selected for analysis. Ultrasound measurement was used to estimate gestational age and the Hadlock algorithm was used to calculate EFW.
Results: A linear increase of AC was observed from 16 to 35 weeks, after which the increase slightly flattened out. An accelerating increase of EFW was observed from 16 to 27 weeks, after which the increase became linear and then flattened out around 36 weeks. Model diagnostics showed sufficient goodness-of-fit of the standards.
Conclusion: Standards of AC and EFW are available to monitor fetal growth for pregnancy in China. Comparability with other cohorts cannot be conclusive as different analysis methods were used across studies.
Keywords: Abdominal circumference; Estimated fetal weight; Growth charts; Growth standards; Ultrasound; Chinese
Abbreviations
AC: Abdominal Circumference; APTD: Anteriorposterior Trunk Diameter; BPD: Biparietal Diameter; CI: Confidence Interval; CRL: Crown-rump Length; EFW: Estimated Fetal Weight; FGR: Fetal Growth Restriction; FL: Femur Length; GA: Gestational Age; HC: Head Circumference; SD: Standard Deviation; SGA: Smallfor- gestational-age; TTD: Transverse Trunk Diameter
Introduction
Ultrasound measurement of fetal biometry is an important and commonly used tool in antenatal care. It measures biometric parameters such as biparietal diameter (BPD), head circumference (HC), abdominal circumference (AC) and femur length (FL). Estimated fetal weight (EFW) can be calculated based on multiple biometric parameters using established formulae [1]. It is important not only to measure fetal biometric parameters accurately, but also to interpret the results appropriately. It helps to predict or diagnose fetal health problems.
Fetal growth restriction (FGR), conventionally defined as estimated fetal weight that is less than the 10th percentile for gestational age and small-for-gestational-age (SGA), conventionally defined as birth weight less than the 10th percentile for gestational age, are conditions that have been associated with increased risk of perinatal morbidity and mortality and increased metabolic and cardiovascular disease risk in later life [2-5]. The reduction of such risk depends on improved antenatal detection and careful clinical management [6]. Various studies have demonstrated that AC and EFW are preferred parameters to diagnose FGR or predict SGA [7,8]. Below 10th percentiles of AC or EFW standards has also been recommended as diagnostic criteria by recent national clinical guidelines [2,6,9].
Many fetal biometric standards are derived from Caucasian populations in Western Europe or North America. The INTERGROWTH-21 project has shown that skeletal size parameters, such as crown-rump length, fetal head circumference and newborn birth length, are similar across diverse geographical areas [10]. However, similarities across countries in AC or EFW have not been established.
There are limited numbers of fetal biometric standards derived from Chinese population. Two studies were conducted for Singaporean Chinese and another two studies for Hong Kong Chinese [11-14]. Environmental and social factors can affect pregnancy outcomes [15]. This urges the development of fetal biometric standards for the Chinese population in mainland China, where about 19% of the world’s population reside [16]. One study conducted in central-south China provided median AC using data from 1992 to 1993 [17]. However, they did not provide the 5th or 10th percentile of AC or EFW that are needed in diagnosis of FGR or prediction of SGA or the top percentiles that are useful for predicting macrosomia. In addition, their data were more than 20 years old and may not be the best evidence for current clinical practice given environmental and socio-economic changes in the past two decades in China. To assist clinical management of FGR and SGA in mainland China, growth standards of AC and EFW using most recent data are needed.
The aim of this study is to construct standards for AC and EFW for the Chinese population in mainland China, using ultrasound observations obtained in Shanghai, China, during 2009-2013.
Materials and Methods
Data for analysis were extracted from a routine clinical and ultrasound database for standard health care procedures of pregnant women who had their antenatal visits at the maternal unit of International Peace Maternity and Child Health Hospital, Shanghai, China from 2009 to 2013 [18]. Patient identifiers were removed from the dataset before analysis and ethical approval for the analysis was granted by the hospital’s Institutional Review Board.
Women were advised to have ultrasound scans at gestational ages of 16th week, 24th week, 34th week and 38th week according to standard schedule of antenatal care at Shanghai, China. Crown-rump length (CRL), biparietal diameter (BPD), femur length (FL), anteriorposterior trunk diameter (APTD) and transverse trunk diameter (TTD) were measured in the antenatal ultrasound scans according to a protocol widely used in China [19]. Briefly, CRL was measured based on frozen image taken on stretched body at first antenatal visit for gestational age estimation. The maximum distance between crown and rump were recorded. AC was based on measurements of APTD and TTD and computed by the formula (APTD+TTD)*1.57 [20]. Head circumference was measured using the ellipse facility on the outer border of the skull. Femur length was measured using a longitudinal view of the fetal thigh closest to the probe and with the femur as close as possible to the horizontal plane. Fetal ultrasonography was performed using a GE Voluson E8 color Doppler ultrasonic diagnostic apparatus (GE Ultrasound, USA), equipped with a 3.5 MHz transabdominal transducer.
For the purpose of developing growth standards, a ‘healthy’ cohort of women with singleton pregnancy who conceived naturally was selected for analysis. Mothers or pregnancies with the following characteristics were excluded: Maternal age <18 or >35 years, selfreported pre-pregnancy BMI<17.0 kg/m2 or >27.0 kg/m2 at their first antenatal visits, cesarean section delivery due to clinical indication (not due to lifestyle choice), previous miscarriage and diagnosis of preeclampsia, pregnancy-induced hypertension, diabetes and gestational diabetes. In addition, fetuses with the following characteristics or birth outcomes were also excluded: Birth weight <2.3 kg or >4.5 kg, delivery before 37.0 weeks or after 42.0 weeks, still birth, fetal death and/ or congenital fetal anomaly indicated by ultrasound scans. Birth weight of 2.3 kg was chosen as the cut-off because 2.3 kg was the first percentile of birth weight in healthy newborns according to the WHO Multicentre Growth Reference Study Group [21].
Gestational age (GA, in exact weeks) at participants’ first antenatal ultrasound visit was estimated by CRL using formula 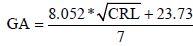 if CRL was available and not larger than 84 mm [22,23]. Otherwise, GA at first antenatal ultrasound visit was estimated by a combination of BPD, AC and FL using formula
 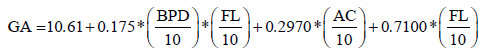 [22,24].
AC was estimated by APTD and TTD using formula AC = (APTD+ TTD)*1.57 [20]. Estimated fetal weight (in grams) was estimated by a combination of AC, FL and BPD using the Hadlock algorithm,
Ultrasound biometric data from the first antenatal visits were used only for GA estimation, not for estimation of fetal growth trajectories.
Statistical methods for development of growth standards
Since there are multiple measurements per pregnancy, mixed effect linear regression models for repeated measurements were used to develop the standards [25,26]. In our study, women had different number of antenatal ultrasound visits. The approach of mixed effect models weights data from women with more ultrasound measurements less heavily. This prevents statistical parameters from gravitating towards women with more ultrasound measurements. A Box-Cox transformation was applied to account for non-normal distribution in biometric measurements (AC and EFW), with adjustment for a cubic function of GA and indicator variables for women [24]. Fractional polynomials was applied to find a power function of GA such that a linear relationship between the function of GA and the transformed biometric measurements could be formed. A linear mixed effect model of the transformed biometric measurements was then generated to estimate parameters that were needed for z-scores and percentiles (5th, 10th, 50th, 90th and 95th percentiles), as described by Royston [25].
Detrended Q-Q plot, also known as worm plot, was created for checking the normality of z-scores [27]. Proportions of observed AC and EFW below the 10th or above the 90th percentiles across all gestational ages were calculated to assess if they did cover 10% of the observations as intended, with 95% confidence interval (CI) obtained by generalized linear models with an identity link function and binary distribution. Logistic regression was used to check whether the proportions below (or above) the specified percentiles were independent of gestational ages as intended. Huber-white robust standard error estimator was used in the analyses to adjust for correlated data (multiple ultrasound scans per woman). Statistical analyses were performed using the R 3.1.2.
Results
Out of a total of 11463 women with singleton pregnancies in the database, 2529 women qualified for the healthy cohort for the purpose of the analysis. Excluding the ultrasound data from the GA dating visit, there were 6837 and 6832 ultrasound measurements of AC and EFW for the development of the standards, respectively. Five criteria that accounted for 70% of the exclusion were maternal age <18 or >35 years old, self-reported pre-pregnancy BMI<17.0 or >27.0, delivery before 37.0 weeks or after 42.0 weeks, cesarean section delivery due to clinical indications and miscarriage in the past.
Mean (SD) age, height and weight of women at first antenatal visit was 28.8 (2.8) years, 163.3 (5.4) cm and 56.8 (6.7) kg, respectively. Mean (SD) GA at first antenatal ultrasound visit and at delivery was 17.4 (5.7) weeks and 39.4 (1.0) weeks, respectively. The number of ultrasound visits excluding GA dating visit was on average 2.7.
Statistical modelling of repeated measurements
The Box-Cox transformation gave estimates of power transformation parameter  = 0.46 (95% CI: 0.37 to 0.56) for AC and = 0.13 (95% CI: 0.096, 0.17) for EFW, respectively. Thus we used AC0.5 and EFW0.1 in the analysis after rounding to one significant digit.
The nonlinear relation between AC0.5 and GA can be described by a second-degree fractional polynomial model with powers 1 and 2. The estimated linearizing function  where
where 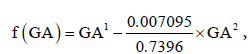 provided an approximately linear relationship between AC0.5 and f(GA). The estimated regression coefficients were AC0.5 = 0.05597 + 0.7374×f (GA) . The non-linear relation between EFW0.1 and GA can be described by a second-degree fractional polynomial model with powers 1 and 3. The estimated linearizing function 0.04281×GA1 − 6.8997×10⁻⁶ ×GA3 = 0.04281×f (GA) ,where
 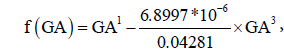 provided an approximately linear relationship between EFW0.1 and f(GA). The estimated regression coefficients were: EFW0.1 = 0.9734 + 0.04263×f (GA) (Table 1).
| Step | Parameter | Value | |
|---|---|---|---|
| AC0.5 | Fractional polynomial transformation of GA | p1 | 1 |
| p2 | 2 | ||
| ?1 | 0.7396 | ||
| ?2 | -0.007095 | ||
| Mixed-effect model regression of AC0.5 on f(GA)=GA1+(?2/?1)GA2 | b0 | 0.05597 | |
| b1 | 0.7374 | ||
| var (β0i) | 0.1950 | ||
| var (β1i) | 0.0006903 | ||
| cov (β0i, β1i) | -0.01049 | ||
| var (eij) | 0.09094 | ||
| EFW0.1 | Fractional polynomial transformation of GA | p1 | 1 |
| p2 | 3 | ||
| ?1 | 0.04281 | ||
| ?2 | -6.8997*10-6 | ||
| Mixed-effect model regression of EFW0.1 on f(GA)=GA1+(?2/?1)GA3 | b0 | 0.9734 | |
| b1 | 0.04263 | ||
| var (β0i) | 3.2231*10-4 | ||
| var (β1i) | 6.7377*10-7 | ||
| cov (β0i, β1i) | -1.0360*10-5 | ||
| var (eij) | 2.7306*10-4 |
Fetal growth charts
The standards for AC and EFW are shown in Figures 1 and 2 in terms of percentiles. For AC, an approximately linear increase was observed from 16 to 35 weeks, after which the increase slightly decelerated. Differences between percentiles of AC increased slowly over time. At 20th, 24th, 36th, 40th weeks, median AC was around 114 mm, 188 mm, 303 mm and 332 mm respectively. For EFW, an accelerating increase was observed from 16 to 27 weeks, after which the rate of increase became approximately constant and it slowed down around 36 weeks. Differences between percentiles of EFW increased rapidly over time. At 20th, 24th, 36th and 40th weeks, median EFW was around 308 g, 619 g, 2511 g and 3167 g, respectively (Figures 1 and 2).

Figure 1: Standards for abdominal circumference.
*Solid line: 50th percentile, dotted and dashed line: 25th and 75th percentiles, dotted lines: 10th and 90th percentiles, dashed lines: 5th and 95th percentiles.

Figure 2: Standards for estimated fetal weight.
*Solid line: 50th percentile, dotted and dashed line: 25th and 75th percentiles, dotted lines: 10th and 90th percentiles, dashed lines: 5th and 95th percentiles.
Model diagnostics
Detrended Q-Q plots for standard of AC showed that most of the data were around the horizontal line and within the 95% CI, indicating approximate normal distribution of the z-scores. The proportions of observed AC classified below the 10th percentile or above the 90th percentiles of the standard were 10.7% (95% CI: 9.8 to 11.6%) and 10.0% (95% CI: 9.1 to 10.8%) as intended, respectively. Logistic regression assessing the association between GA and the classification of AC below the 10th percentile gave p-value of 0.658. That between GA and AC above the 90th percentile was 0.041. Despite the statistically significant association between GA and AC above the 90th percentile, the odds ratio was only 0.987 per week increase in GA and it induced practically little deviation from the targeted 10% coverage (Figure 3).

Figure 3: Worm plots for Z scores for AC.
*The plot consists of detrended Q-Q plots for 16 subgroups of Z scores for AC with equal size ranked by earliest to latest GA from upper-left panel to lower-right panel. Data around horizontal line indicates approximately normal distribution. Dash lines indicate 95% confidence interval
Detrended Q-Q plots for standard of EFW showed that most of the data points were around the horizontal line and within the 95% CI, except in one of the 16 GA intervals. The z-scores mostly were normally distributed. The proportions of observed EFW classified below the 10th percentile or above the 90th percentiles of the standard were 10.2% (95% CI: 9.3 to 11.2%) and 9.2% (95% CI: 8.4 to 10.0%), respectively. Logistic regression assessing the association between GA and the classifications of EFW below the 10th percentile and above the 90th percentile gave p-values of 0.409 and 0.723, respectively (Figure 4).

Figure 4: Worm plots for Z scores for AC.
*The plot consists of detrended Q-Q plots for 16 subgroups of Z scores for EFW with equal size ranked by earliest to latest GA from upper-left panel to lower-right panel. Data around horizontal line indicates approximately normal distribution. Dash lines indicate 95% confidence interval
Comparison with other growth standards
| Study site | AC algorithm | Median AC (mm) at Gestational Weeks | |||
|---|---|---|---|---|---|
| 20th week | 24th week | 36th week | 40th week | ||
| Shanghai | Estimated by APTD and TTD | 144 | 188 | 303 | 332 |
| Singapore [11] | Estimated by APTD and TTD | 145 | 188 | 303 | 334 |
| Central-south China [17] | Estimated by APTD and TTD | 150 | 188 | 301 | 325 |
| Singapore [12] | Measured directly | 146 | 197 | 317 | Not reported |
| UK [28] | Measured directly | 153 | 187 | 320 | 355 |
| Study site | EFW algorithm | Median EFW (g) at Gestational Weeks | |||
|---|---|---|---|---|---|
| 20th week | 24th week | 36th week | 40th week | ||
| Shanghai | Hadlock (I) | 308 | 619 | 2511 | 3167 |
| Singapore [12] | Hadlock (II) | 312 | 606 | 2644 | Not reported |
| Congo [29] | Hadlock (II) | 315 | 635 | 2646 | 3403 |
| UK [28] | Hadlock (II) | 344 | 697 | 2880 | 3633 |
Table 3: Comparison of median EFW at different gestational weeks.
Tables 2 and 3 compare the median AC and EFW at different gestational weeks between our study and others. In terms of AC, the previous study conducted in central-south China and the Singaporean Chinese study published in 1995 used the same algorithm as our study to derive AC from APTD and TTD [11,17]. Throughout 20th to 40th weeks, both studies had medians similar to ours. The recently published Singapore Chinese study and a Caucasian study in London, UK used direct AC measurements and they shared similar medians [12,28]. The medians in our study tended to be lower than theirs (Table 2).
In terms of EFW (Table 3), our study used the Hadlock (I) formula that only involves AC, FL and BPD to derive EFW, as HC was not measured in our study [1]. A Congolian study, the Singapore Chinese study and a UK study used the Hadlock formula involving AC, FL, BPD and HC (Hadlock (II)) instead [12,28,29]. Esinler et al. compared different EFW algorithms and suggested that Hadlock (I) and Hadlock (II) had good and similar degree of accuracy [30]. Our study, the Singapore Chinese study and the Congolian study showed similar EFW at 20 and 24 weeks, but at 36 weeks our study showed lower EFW. The UK study showed higher median of EFW throughout 20th to 40th weeks. The previously mentioned central-south Chinese study and Singapore Chinese study who shared similar medians of AC with our study did not provide standards for EFW, so we were unable to compare EFW with these two Chinese studies.
Discussion
We have developed standards for both AC and EFW for singleton pregnancies in Shanghai, China. By using only data from a ‘healthy cohort’, the standards describe the growth trajectories for healthy pregnancy and birth outcomes. Model diagnostics show sufficient goodness-of-fit. Considering the agreement between the median AC curves from our study and the previous study conducted in centralsouth China, we believe that the standards from our study is widely usable in China.
In our study, AC was not directly measured, it was based on measurements of APTD and TTD. Median AC in this study tended to be lower than the Caucasian study in London, UK, where AC was directly measured [28]. This difference may be partly attributed to the difference between AC algorithms as direct measurement method of AC tends to result in values that are greater than the indirectly estimated AC [31-33]. AC derived from APTD and TTD is the current common practice in China and growth standards using this algorithm will provide clinical guidance to health care professionals in China. However, in places where AC is directly measured, caution must be taken when using the growth standards developed in this analysis.
Reasons of Chinese fetus having smaller EFW in the third trimester than other cohorts need to be further studied. Given that AC was similar between this study and the earlier Singapore Chinese study, the present population may not be truly much smaller in EFW than other cohorts. An alternative explanation could be the impact of different EFW algorithms. HC was not measured in this study. Therefore, we did not use the Hadlock formula involving HC which was applied in the studies in Congo, Singapore and UK. It may be that the algorithm used in our study underestimated EFW or the algorithm used in other study overestimated EFW in the third trimester. This is a speculation and further studies need to be done before any firm conclusion is made.
A strength of our study is that, even after stringent selection to define a healthy cohort for the purpose of developing fetal growth standards, there was still a sufficient sample size of 2529 pregnancies/fetuses included in our statistical analysis. The pregnancies/fetuses included were not supposed to represent the excluded pregnancies/fetuses. Instead, they were chosen to represent a healthy pregnancy cohort, which is commonly used in the development of growth standards. The large sample size offers sufficient precision for the development of the standards.
Conclusion
In summary, we have developed growth standards for clinical use to monitor fetal AC and EFW for Chinese population in China. Compared to standards developed elsewhere, our standards indicate that Chinese fetus in Shanghai, China, had similar AC compared to other Singapore and Chinese cohorts. Variation in EFW across populations cannot be conclusively determined due to differences in EFW estimation algorithms.
Acknowledgement
YZ, LW and QH collected the data. YW, WY and YBC conceived and conducted this analysis. YW, WY and YBC drafted the first version of the article. All authors participated in the critical review and revision of the article. All authors approved the submission. This work is supported by National Natural Science Foundation of China, Grant No. 81273168 and the 2nd Shanghai new one-Hundred Person Project, Grant No. XBR2013101.
References
- Hadlock FP, Harrist RB, Sharman RS, Deter RL, Park SK (1985) Estimation of fetal weight with the use of the head, body and femur measurements - A prospective study. Am J Obstet Gynecol 151: 333-337.
- American College of Obstetricians and Gynecologists (2013) Practice bulletin no. 134: Fetal growth restriction. Obstet Gyneco 121: 1122-1133.
- Dobson PC,Abell DA,Beischer NA (1982) Antenatal pregnancy complications and fetal growth retardation. Aust N Z J Obstet Gynaecol 22: 203-205.
- Tenovuo AH,Kero PO,Korvenranta HJ,Erkkola RU,Klemi PJ, et al. (1988) Risk factors associated with severely small for gestational age neonates. Am J Perinatol5: 267-271.
- Barker DJP (1998) Mothers, babies and health in later life. Edinburgh. Churchhill Livingstone.
- New Zealand Maternal Fetal Medicine Network (2013) Guideline for the management of suspected small for gestational age singleton pregnancies after 34 weeks gestation. Auckland: NZMFMN.
- Chang TC,Robson SC,Boys RJ,Spencer JA (1992) Prediction of the small for gestational age infant: Which ultrasonic measurement is best? Obstet Gynecol 80: 1030-1038.
- Miller JM Jr,Gabert HA (1992) Comparison of dynamic image and pulsed Doppler ultrasonography for the diagnosis of the small-for-gestational-age fetus. Am J Obstet Gynecol166: 1820-1826.
- Royal College of Obstetricians and Gynaecologists (2013) The investigation and management of the small-for-gestational-age fetus. Guideline no. 31. 2nd Edition. London, UK: RCOG
- Villar J, Papageorghiou AT, Ohuma EO, Ismail LC, Barros FC, et al. (2014) The likeness of fetal growth and newborn size across non-isolated populations in the INTERGROWTH-21st Project: The fetal growth longitudinal study and new-born cross-sectional study. Lancet Diabetes Endocrinol 2: 781-792.
- Lai FM, Yeo GS (1995) Reference charts of foetal biometry in Asians. Singapore Med J36: 628-636.
- Xu Y,Lek N,Cheung YB,Biswas A,Su LL, et al. (2015) Unconditional and conditional standards for fetal abdominal circumference and estimated fetal weight in an ethnic Chinese population: A birth cohort study. BMC Preg Childbirth15: 141.
- Leung TN, Pang MW, Daljit SS, Leung TY, Poon CF, et al. (2008) Fetal biometry in ethnic Chinese: Biparietal diameter, head circumference, abdominal circumference and femur length. Ultrasound Obstet Gynecol 31: 321-327.
- Pang MW, Leung TN, Sahota DS, Lau TK, Chang AM (2003) Customizing fetal biometric charts. Ultrasound Obstet Gynecol 22: 271-276.
- Lei H, Wen SW (1998) Ultrasonographic examination of intrauterine growth for multiple fetal dimensions in a Chinese population. Central-south china fetal growth study group. Am J Obstet Gynecol 178: 916-921.
- Owen P, Burton K, Ogston S, Khan KS, Howie PW (2000) Using unconditional and conditional standard deviation scores of fetal abdominal area measurements in the prediction of intrauterine growth restriction. Ultrasound Obstet Gynecol 16: 439-444.
- Zhou Y, Guo W (2006) Ultrasound Medicine. 4th Edition (in Chinese). Science and technology literature press. Beijing.
- Sanders RC, Winter TC (2007) Clinical sonography: A practical guide. Lippincott Williams & Wilkins.
- WHO Multicentre Growth Reference Study Group (2006) WHO child growth standards: Length/height-for-age, weight-for-age, weight-for-length, weight-for-height and body mass index-for-age: Methods and development. Geneva, Switzerland: WHO Press.
- Butt K,Lim K (2014)Determination of gestational age by ultrasound. J Obstet Gynaecol Can36: 171-181.
- Robinson HP,Fleming JE (1975) A critical evaluation of sonar "crown-rump length" measurements. Br J Obstet Gynaecol 82: 702-710.
- Hadlock FP,Deter RL,Harrist RB,Park SK (1984) Estimating fetal age: Computer-assisted analysis of multiple fetal growth parameters. Radiology 152: 497-501.
- Royston P, Altman DG (1995) Design and analysis of longitudinal studies of fetal size. Ultrasound Obstet Gynecol 6: 307-312.
- Cheung YB (2014) Statistical analysis of human growth and development. CRC Press.
- Van-Buuren S, Fredriks AM (2001) Worm plot: A simple diagnostic device for modelling growth reference curves Stat Med 20: 1259-1277.
- Gallivan S, Robson SC, Chang TC, Vaughan J, Spencer JA (1993) An investigation of fetal growth using serial ultrasound data. Ultrasound Obstet Gynecol 3: 109-114.
- Landis SH,Ananth CV,Lokomba V,Hartmann KE,Thorp JM, et al. (2009) Ultrasound-derived fetal size nomogram for a sub-Saharan African population: A longitudinal study. Ultrasound Obstet Gynecol34: 379-86
- Esinler D, Bircan O, Esin S, Sahin EG, Kandemir O, et al. (2015) Finding the best formula to predict the fetal weight: Comparison of 18 formulas. Gynecol Obstet Invest.
- Cheon K, Albert PS, Zhang Z (2012)The impact of random-effect misspecification on percentile estimation for longitudinal growth data.Stat Med31: 3708-3718.
- Watson WJ,Chescheir NC,Seeds JW (1990) Ultrasound determination of fetal abdominal circumference: A comparison of measurement methods. Am J Perinatol 7: 182-183.
- Tamura RK,Sabbagha RE,Pan WH,Vaisrub N (1986) Ultrasonic fetal abdominal circumference: Comparison of direct versus calculated measurement. Obstet Gynecol67: 833-835.
Citation: Wei Y, Wang L, Zhang Y, Huang Q, Yan W, et al. (2017) Standards for Fetal Abdominal Circumference and Estimated Fetal Weight in Shanghai, China. J Preg Child Health 4: 352. DOI: 10.4172/2376-127X.1000352
Copyright: © 2017 Wei Y, et al. This is an open-access article distributed under the terms of the Creative Commons Attribution License, which permits unrestricted use, distribution, and reproduction in any medium, provided the original author and source are credited.
Select your language of interest to view the total content in your interested language
Share This Article
Recommended Journals
Open Access Journals
Article Tools
Article Usage
- Total views: 22693
- [From(publication date): 0-2017 - Dec 20, 2025]
- Breakdown by view type
- HTML page views: 21415
- PDF downloads: 1278