Summaries, Analysis and Simulations of COVID-19 Epidemics in Shanghai
Received: 25-Feb-2022 / Manuscript No. JIDT-21-51935 / Editor assigned: 27-Feb-2022 / PreQC No. JIDT-21-51935(PQ) / Reviewed: 13-Mar-2022 / QC No. JIDT-21-51935 / Revised: 20-Mar-2022 / Manuscript No. JIDT-21-51935(R) / Published Date: 27-Mar-2022 DOI: 10.4173/2332-0877.22.S1.005
Abstract
Background: Globally COVID-19 epidemics have caused tremendous disasters. As the best city to prevent the COVID-19 infection in China, Shanghai experienced five wave COVID-19 epidemics but only has 388 confirmed cases and 7 deaths from January 20 2020 to January 4, 2022.
Methods: This study summarizes, analyzes and simulates COVID-19 epidemic in Shanghai, estimates transmission rates and blocking rates to symptomatic infections.
Results: Key findings for simulations were that for five waves of epidemics, after reaching the infection turning point, the blocking rate of symptomatic infection is over 99%. Keeping the blocking rate (approximate 95%) just reaching the infection turning point cannot against the spreads of COVID-19 epidemics.
Conclusion: Strict prevention and control strategies implemented in Shanghai authority are not only effective but also necessary. To avoid multiple outbreaks of an epidemic, authorities should at least maintain preventive and control measures implemented 7 days after inflection turning point until all new infections have been cleared.
Keywords: COVID-19; Infection transmission rates; Infection blocking rates; Modeling; Simulations
Introduction
Over the past two years, the 2019 coronavirus disease (COVID-19) has placed tremendous pressures onto the prevention, control, and healthcare systems worldwide. Many countries have experienced multiple outbreaks of the COVID-19 epidemic due to incomplete preventive measures and virus variants. As of January 8, 2022, there are more than 298.9 million confirmed cases of COVID-19 with just under 5.5 million deaths globally. Mathematical models have played important roles in the formulation, evaluation, and prevention of control strategies to epidemic infectious diseases. Modelling the dynamics of spread of disease can help people to understand the mechanism of epidemic diseases, formulate and evaluate prevention and control strategies, and predict tools for the spread or disappearance of an epidemic [1]. Since the outbreak of COVID-19 in Wuhan, many scholars have published a large numbers of articles on the modeling and prediction of COVID-19 epidemic [2-10]. Shanghai is the best city to prevent the spread of COVID-19 in China. This paper summarizes, analyzes the five waves of the COVID-19 epidemic in Shanghai, estimates infection transmission rates, infection blocking rates, and preventive measures through modeling and numerical simulations
Materials and Methods
The dataset of the Shanghai COVID-19 epidemics from January 20 2020 to January 4, 2022 was collected and edited from the official website [11]. Using differential equation models stimulates the outcomes of the current symptomatic individuals and cumulative recovered symptomatic individuals. Equation parameters were determined by so-called minimization error square criterion described in references [12,13]. Simulations and figure drawings were implemented via Mat lab programs.
Summary of five wave COVID-19 epidemics in Shanghai
Since 2020, there have been five waves of epidemics in Shanghai (more than three infected people). The Shanghai epidemics are summarized as follows:
• The first wave epidemic: From January 20 to May 2, 2020, there were 339 infected people, seven of whom died. There were no new infections after 63 days. The highest number of people hospitalized with symptoms was 255 (days 23-24). The largest daily increase in infections was 27 on day 10. The first person recovered on day 4. Up to 34 people recovered on day 26. All hospitalized patients recovered after day 103.
• During the period from May 3 to July 19, 2020, on May 17, May 20 and June 29, three imported symptomatic cases from other provinces were reported, and they were recovered on May 27, May 31, and July 19, respectively. No new infections reported from July 19 to November 8, 2020.
• The second wave epidemic: From November 9, 2020 to January 2, 2021, cumulative seven people were infected and no deaths were reported. There were no new infections after the 14th day. The highest number of people hospitalized with symptoms was 7 (on days 14-19). The largest daily increase in infections was on days 11 and 13, with two infections. The first patient recovered on day 20. Up to 2 individuals recovered on day 26. All hospitalized patients cleared after day 56.
• No infections were reported between January 3 and January 19, 2021.
• The third wave epidemic: From January 20 to March 17, 2021, cumulative 22 people were infected and no deaths were reported. There were no new infections after the 16th day. The highest number of people hospitalized with symptoms was 22 (on days 14-16). The largest daily increase in infections was on the 1st day, with 4 infections. The first two patients recovered on day 18. Up to 3 individuals recovered on day 35. All hospitalized patients cleared after day 55.
• No new infections were reported between March 18 and August 1, 2021.
• The fourth wave epidemic: From August 2, 2021 to September 28, 2021, cumulative 10 people were infected and no deaths were reported. There were no new infections after the 24th day. The highest number of people hospitalized with symptoms was 9 (on days 24-34). The largest daily increase in infections was on day 19, with 3 infections. The first patient recovered on day 18. Up to 2 individuals recovered on days 44 and 48. All hospitalized patients cleared after day 57.
• No infections were reported between September 29 and November 24, 2021.
• The fifth wave epidemic: From November 25, 2021 to January 4, 2022, cumulative 7 people were infected and no deaths were reported. There were no new infections after the 22th day. The highest number of people hospitalized with symptoms was 7 (on days 22-26). The largest daily increase in infections was on the 1st day, with 3 infections. The first patient recovered on day 27. There was one recovered individual on days 27, 31, 32, 34, 36, 37 and 40 respectively. All hospitalized patients cleared after day 40. There are still 8 asymptomatic individuals under investigations.
• In summary, during January 20, 2020 to January 4, 2022, Shanghai reported 388 COVID-19 infected individuals, 381 individuals recovered and seven died. There are 8 asymptomatic individuals to be investigated.
Analysis and simulations of COVID-19 epidemics in Shanghai
The first Shanghai epidemic infected 399 individuals and lasted 103 days. However the following four epidemics infected 7, 22, 10, and 7 individuals, and lasted 56, 55, 57, and 40 days, respectively. The time of clearing new infections of the first Shanghai epidemic was 64 day. However the times of clearing up new infections of the four epidemics were 14 day, 15 day, 24 day, and 22 day, respectively. The reported data suggest that after the first epidemic, the Shanghai authority has implemented very effective prevention measures such that decreased largely infected individuals, healthcare expenditures and workloads.
In order to estimate numerically the transmission rates and blocking rates to symptomatic infections, we need to set up mathematic models to simulate the dynamics of spread of infection disease.
For the first epidemic, the symptomatic infected individuals (I) and the asymptomatic infected individuals (Ia) infect the susceptible population (S) with the transmission rates of β11 and β21, respectively, making S become symptomatic infected individuals, and with the transmission rates of β12 and β22, respectively, making S become asymptomatic individuals. Then, a symptomatic individual is cured at a rate κ, an asymptomatic individual returns to normal at a rate κa. An infected individual dies at a rate α. Here all parameters are positive numbers. Assume that the dynamics of an epidemic can be described by m-time intervals, which corresponds different prevention and control measures, and medical effects. At ith time interval, the model has the form [12,13]:
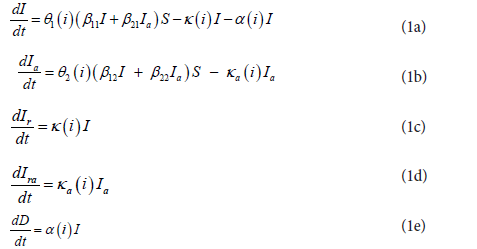
where Θ1(i)=(1−θ1(i)) and Θ2(i)=(1−θ2(i)) (i=1,...,m) represent the blocking rates to symptomatic and asymptomatic infections, respectively.
For other epidemics, the model has simply the form
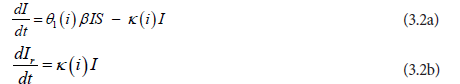
Where, Θ1(i)=1−θ1(i) represents the blocking rate to symptomatic infections, and β represents the transmission rate of the symptomatic individuals to make S become symptomatic individuals.
Using the approaches described, we can determine the parameters of equations (1) and (2). However we need to amend slightly the formulas to calculate κ(i) in order to obtain better simulation results [12,13].
The parameters of equations (1) and (2) of the five wave epidemics of Shanghai are given in Table 1. The calculated transmission rates β, blocking rate Θ′1s to symptomatic infections are listed in Table 2.
| i: | 1 | 2 | 3 | 4 | 5 | 6 | 7 | |
|---|---|---|---|---|---|---|---|---|
| 1 | Days | 0-4 | 5-10 | 11-16 | 17-24 | 25-43 | 44-52 | 53-103 |
| α(i) | 0 | 0.0027701 | 0 | 0 | 0.0007985 | 0 | 0.012958 | |
| Ka(i) | 0.1 | 0.1 | 0.1 | 0.1 | 0.1 | 0.1 | 0.1 | |
| K(i) | 0.018182 | 0.01108 | 0.0096805 | 0.025337 | 0.10298 | 0.11804 | 0.039437 | |
| 2 | Days | 0-14 | 15-19 | 20-34 | 35-45 | 45-56 | – | – |
| K(i) | 0 | 0 | 0.04024 | 0.06667 | 0.1270 | – | – | |
| 3 | Days | 0-3 | 4-9 | 10-17 | 18-29 | 30-44 | 45-55 | – |
| K(i) | 0 | 0 | 0 | 0.026986 | 0.086486 | 0.1859 | – | |
| 4 | Days | 0-19 | 20-24 | 24-34 | 35-43 | 44-57 | – | – |
| K(i) | 0.019118 | 0 | 0 | 0.045763 | 0.19241 | – | – | |
| 5 | Days | 0-12 | 13-22 | 23-26 | 27-34 | 35-40 | – | – |
| K(i) | 0 | 0 | 0 | 0.10811 | 0.31429 | – | – |
Table 1: Equation parameters of the five wave epidemics of Shanghai during 2020-2021.
| i: | 1 | 2 | 3 | 4 | 5 | 6 | ||
|---|---|---|---|---|---|---|---|---|
| 1 | β11 | Days | 0-4 | 5-11 | 11-16 | 17-24 | 25-43 | 43-103 |
| 0.59643 | Θ1(i) | 0 | 66.6% | 82.7% | 95.5% | 99.1 | 100% | |
| Θ2(i) | 0 | 80% | 82.7% | 81.1% | 83.1 | 100% | ||
| 2 | β | Days | 0-14 | 15-19 | 20-56 | – | – | – |
| 0.13881 | Θ1(i) | 0 | 99.6% | 100% | – | – | – | |
| 3 | β | Days | 0-3 | 4-9 | 10-17 | 18-29 | 30-55 | – |
| 0.59546 | Θ1(i) | 0 | 88.5% | 95.5% | 99.8% | 100% | – | |
| 4 | β | Days | 0-19 | 20-24 | 24-34 | 35-57 | – | – |
| 0.11352 | Θ1(i) | 0 | 28.9% | 99.9% | 100% | – | – | |
| 5 | β | Days | 0-12 | 13-22 | 23-26 | 27-40 | – | – |
| 0.07934 | Θ1(i) | 0 | 73% | 99% | 100% | – | – |
Table 2: Equation parameters of the five wave epidemics of Shanghai. For the first epidemic, β21=0.23, β12=0.39756, β22=0.014199.
Figures 1-3 shows the outcomes of the current symptomatic individuals, the cumulative recovered symptomatic individuals and the current covered individuals of the five wave epidemics in Shanghai. The three figures display visually the evolutions of the five wave epidemics in Shanghai.

Figure 1: Outcomes of the current symptomatic individuals of the five wave epidemics in Shanghai. The first epidemic marked by. Note: (  ) The second epidemic marked by (
 ), The third epidemic marked by (
 ), The fourth epidemic marked by (
 ), The fifth epidemic marked by (
 ).
).

Figure 2: Outcomes of the cumulative recovered symptomatic individuals of the five wave epidemics in Shanghai. Note: ( ![]() ) The first epidemic marked by. ( ) The second epidemic marked by. ( ) The third epidemic marked by. ( ) The fourth epidemic marked by. ( ) The fifth epidemic marked by.
) The first epidemic marked by. ( ) The second epidemic marked by. ( ) The third epidemic marked by. ( ) The fourth epidemic marked by. ( ) The fifth epidemic marked by.

Figure 3: Outcomes of the current recovered individuals of the five wave epidemics in Shanghai. Note: ( ) The first epidemic marked by. ( ) The second epidemic marked by.( )The third epidemic marked by. ( ) The fourth epidemic marked by. ( ) The fifth epidemic marked by.
Figures 4 and 5 shows the simulation results of equations (1) and (2) for the outcomes of the current symptomatic individuals and the cumulative recovered symptomatic individuals. Observe that simply models can describe approximately the complex evolutions of the five wave epidemics in Shanghai. In particularly, we can give the estimations to the infection blocking rates with the help of the simulations.

Figure 4: Outcomes of the current symptomatic individuals of the five wave epidemics in Shanghai marked by ( ), ( ), ( ), ( ) and ( ), respectively. The corresponding simulations are displayed via solid lines coloured by red, cyan, blue, green and magenta, respectively.

Figure 5: Outcomes of the cumulative recovered symptomatic individuals of the five wave epidemics in Shanghai marked by ( ), ( ), ( ), ( ) and ( ), respectively. The corresponding simulations are displayed via solid lines colored by red, cyan, blue, green and magenta, respectively.
Results and Discussion
From Tables 1 and 2 it follows that:
• Transmission (Baseline) Rates for first and third outbreaks Epidemics are almost the same. However, higher blocking rates end the third outbreak 48 days earlier than the first epidemic in Table 1 and Figure 1.
• The second, fourth and fifth epidemic (baseline) transmission rates were very low. This explains more about effective infection prevention (Example: more people carry masks in public places, less public places gatherings). The blockage rate Θ′1s reached more than 99% after reaching the inflection returning point for the five epidemics in Figure 1 and Table 2.
• The blocking rate Θ′1s reached more than 99% after reaching the inflection turning point for the five epidemics in Figure 1 and Table 2.
• For the five epidemics, the blocking rates Θ′1s reached over 99% after the infection turning point days in Figure 1 and Table 2.
In summary, the calculated equation parameters provide quantifying interpretations to the results of the spreads of the epidemics and control measures.
The numerical simulation results show that:
• The first wave epidemic: On day 0, day 4, day 10, day 16, day 43, day 52, and day 103, the numbers of the reported and simulated current symptomatic individuals are approximate the same. On day 24 and day 70, there is only one difference. On day 0, day 4, day 10, day 43, day 52, and day 70, the numbers of the reported and simulated cumulative recovered symptomatic individuals are approximate the same. On day 24 and day 103, there are three and one differences, respectively.
• The second wave epidemic: On day 0, day 14, day 19, day 34, day 45, and day 56, the numbers of the reported and simulated current symptomatic individuals are approximate the same; the numbers of the reported and simulated cumulative recovered symptomatic individuals are also approximate the same.
• The third wave epidemic: On day 0, day 3, day 9, day 17, day 29, day 44, and day 55, the numbers of the reported and simulated current symptomatic individuals are approximate the same; the numbers of the reported and simulated cumulative recovered symptomatic individuals are also approximate the same.
• The fourth wave epidemic: On day 0, day 19, day 24, day 29, day 34, and day 57, the numbers of the reported and simulated current symptomatic individuals are approximate the same; the numbers of the reported and simulated cumulative recovered symptomatic individuals are also approximate the same.
• The fifth wave epidemic: On day 0, day 12, day 22, day 26, day 34, and day 40, the numbers of the reported and simulated current symptomatic individuals are approximate the same; the numbers of the reported and simulated cumulative recovered symptomatic individuals are also approximate the same.
In summary, models (1) and (2) can simulate well the outcomes of the five COVID-19 epidemics in Shanghai. The calculated equation parameters can help us to understand and explain the mechanism of epidemic diseases and control strategies for the event of the practical epidemics.
Conclusion
The main contributions of this paper are summarized as follows:
• It is the first time to summary the five wave Shanghai epidemics. It shows a clear picture to prevent the spread of the Shanghai epidemics.
• It introduces two models to simulate the Shanghai epidemics. The simulation results can provide reasonable interpretation and estimation of prevention and control measures and effectiveness of treatments.
• It suggests that it needs a blocking rate of more than 95% to prevent the spreads of the COVID-19 epidemics.
• It suggests that good prevention and control measures and treatments may end new COVID-19 infections in 40 days.
A recommendation to avoid multiple outbreaks of an epidemic is competent authorities should at least maintain preventive and control measures implemented 7 days after inflection turning point until all new infections have been cleared.
It is not wise strategy to withdraw all prevention and control measures before the number of the all infected people have been cleared. 100% blocking the speed at which COVID-19 infection spreads is key Strategies for early clearance or reduction of epidemic spread possible.
Strict prevention and control strategies implemented in Shanghai authority are not only effective but also necessary. It is expected that this research can provide better understanding, interpretation and leading the spread and control measures of epidemics.
Funding
The author has not declared a specific grant for this research from any funding agency in the public, commercial or not for profit sectors.
Conflict of Interest
The author declares no potential conflict of interest.
Data Availability Statement
Data are available on reasonable request. Please email the author.
Ethical Statement
Not applicable/No human participants included.
References
- Daley D, Gani J (2005) Epidemic Modeling: An Introduction. New York: Cambridge University Press.
- Zhao S, Chen H (2020) Modeling the epidemic dynamics and control of COVID-19 outbreak in China. Quant Biol 11:1-9.
[Crossref] [Google Scholar] [PubMed]
- Yang Z, Zeng Z, Wang K, Wong SS, Liang W, et al. (2020) Modified SEIR and AI prediction of the epidemics trend of COVID-19 in China under public health interventions. J Thorac Dis 12:165-174.
[Crossref] [Google Scholar] [PubMed]
- Zhao S, Lin Q, Ran J, Musa SS, Yang G, et al. (2020) Preliminary estimation of the basic reproduction number of novel coronavirus (2019-nCoV) in China, from 2019 to 2020: A data-driven analysis in the early phase of the outbreak. Int J Infect Dis 92:214-217.
[Crossref] [Google Scholar] [PubMed]
- Roosa K, Lee Y, Luo R, Kirpich A, Rothenberg R, et al. (2020) Real-time forecasts of the COVID-19 epidemic in China from February 5th to February 24th, 2020. Infect Dis Model 5:256-263.
[Crossref] [Google Scholar] [PubMed]
- Tang B, Bragazzi NL, Li Q, Tang S, Xiao Y, et al. (2020) An updated estimation of the risk of transmission of the novel coronavirus (2019-nCov). Infect Dis Model 5:248-255.
[Crossref] [Google Scholar] [PubMed]
- Li X, Li Z (2020) Study on transmission model of the novel coronavirus (in Chinese).
- Chintalapudi N, Battineni G, Sagaro GG, Amenta F (2020) COVID-19 outbreak reproduction number estimations and forecasting in Marche, Italy. Int J Infect Dis 96:327-333.
[Crossref] [Google Scholar] [PubMed]
- Chang SL, Harding N, Zachreson C, Cliff OM, Prokopenko M (2020) Modelling transmission and control of the COVID-19 pandemic in Australia. Nat Commun 11:1-13.
[Crossref] [Google Scholar] [PubMed]
- Niu R, Chan YC, Wong EW, Van Wyk MA, Chen G (2021) A stochastic SEIHR model for COVID-19 data fluctuations. Nonlinear Dyn 106:1311-1323.
[Crossref] [Google Scholar] [PubMed]
- Health Commission of Shanghai (2021) Epidemic bulletin.
- Min L (2021) Modelling, simulations and analysis of the first COVID-19 epidemic in Shanghai. medRxiv.
- Min L (2021) Modelling, simulations and analysis of the first and second COVID-19 epidemics in Beijing. medRxiv.
Citation: Min L (2022) Summaries, Analysis and Simulations of COVID-19 Epidemics in Shanghai. J Infect Dis Ther.S1:005. DOI: 10.4173/2332-0877.22.S1.005
Copyright: >© 2022 Min L. This is an open-access article distributed under the terms of the Creative Commons Attribution License, which permits unrestricted use, distribution, and reproduction in any medium, provided the original author and source are credited.
Select your language of interest to view the total content in your interested language
Share This Article
Recommended Journals
Open Access Journals
Article Tools
Article Usage
- Total views: 2347
- [From(publication date): 0-2022 - Dec 20, 2025]
- Breakdown by view type
- HTML page views: 1731
- PDF downloads: 616