Summaries, Analysis and Simulations of Recent COVID-19 Epidemics in Mainland China
Received: 22-Apr-2022 / Manuscript No. JIDT-22-61617 / Editor assigned: 27-Apr-2022 / PreQC No. JIDT-22-61617 (PQ) / Reviewed: 11-May-2022 / QC No. JIDT-22-61617 / Revised: 17-May-2022 / Manuscript No. JIDT-22-61617 (R) / Published Date: 24-May-2022 DOI: 10.4172/2332-0877.1000505
Abstract
Background: Globally COVID-19 epidemics have caused tremendous disasters. China prevented effectively the spread of COVID-19 epidemics before 2022. Recently Omicron and Delta variants cause a surge in reported COVID-19 infections.
Methods: Using differential equations and real word data, this study modelings and simulates the COVID-19 epidemic in mainland China, from December 31 2021 to May 15 2022 estimates the transmission rates, recovery rates, and the blocking rates to symptomatic and asymptomatic infections, and the death rate of symptomatic individuals using visual simulations to predict the outcomes of the mainland China epidemics. The transmission rates and recovery rates of the foreign input COVID-19 infected individuals in mainland China have also been studied.
Results: The simulation results were in good agreement with the real word data. The recovery rates of the foreign input symptomatic and asymptomatic infected individuals are much higher than those of the mainland COVID-19 infected individuals. The blocking rates to symptomatic and asymptomatic mainland infections are lower than those of the previous epidemics in mainland China. For the foreign input COVID-19 epidemics, the numbers of the current symptomatic individuals and the asymptomatic individuals charged in medical observations have decreased significantly after March 17 2022. Simulations predict that on Visual simulations predict that on day 160, the number of the current symptomatic individuals were between 605 and 1090; the number of the current asymptomatic individuals may be between 4088 and 7980; the number of the cumulative death symptomatic individuals may be between 615 and 624.
Conclusion: It needs to implement more strict prevention and control strategies to prevent the spread and the death rate of the COVID-19 epidemics in mainland China. Keeping the present prevention and therapy measures implemented during day 107 to day 115 to foreign input COVID-19 infections can rapidly reduce the number of foreign input infected individuals to a very low level.
Keywords: China COVID-19; Infection transmission rates; Infection blocking rates; Recovery rates; Modeling; Simulations
Introduction
The 2019 Coronavirus Disease (COVID-19) has placed tremendous pressures onto the prevention, control, and healthcare systems worldwide. Many countries have experienced multiple outbreaks of the COVID-19 epidemic due to incomplete preventive measures and Omicron and Delta variants. As of 30 March 2022, there were more than 4.85.5 million confirmed cases of COVID-19 with more than 6.1 million deaths [1]. Modelling the dynamics of spread of disease can help people to understand the mechanism of epidemic diseases, formulate and evaluate prevention and control strategies, and predict tools for the spread or disappearance of an epidemic [2]. Recently, the author has used several simple differential equation models to describe successfully the dynamics of spreads of the COVID-19 epidemics in mainland China [3-14]. China prevents effectively the spread of COVID-19 epidemics before Omicron and Delta variants appeared. Recently, reported numbers of symptomatic and asymptomatic COVID-19 infected individuals are increased rapidly. This paper summarizes, analyzes and simulates the recent COVID-19 epidemic (from December 31, 2021 to May 15, 2022) in mainland China, estimates infection transmission rates, infection blocking rates, and preventive measures through modelings and numerical simulations.
Materials And Methods
The dataset of the China COVID-19 epidemics from December 31, 2021 to April 30, 2022 was collected and edited from the National Health Commission of the People’s Republic of China official website [13]. Using differential equation models stimulates the outcomes of the numbers of the current symptomatic individuals, the current asymptomatic individuals, the cumulative recovered symptomatic individuals and the cumulative asymptomatic individuals discharged from observations. Equation parameters were determined by so-called minimization error square criterion described in references [13,14]. Using virtual simulations estimates outcomes of the spreads of the COVID-19 epidemics in mainland China. Simulations and figure drawings were implemented via Matlab programs.
Analysis and simulations of COVID-19 epidemics in China
COVID-19 epidemics in Mainland: On December 31, 2021 (denoted by day 0), the numbers of the current symptomatic infected individuals, the current asymptomatic infected individuals charged in observations, the cumulative recovered symptomatic individuals, the cumulative recovered asymptomatic individuals discharged in observations were 2886, 59, 29, and 3, respectively. There were no COVID-19 related death reports for many months.
After four months, on April 30 (day 120), the numbers of the current symptomatic infected individuals, the current asymptomatic infected individuals charged in observations, the cumulative recovered symptomatic individuals, the cumulative recovered asymptomatic individuals discharged in observations increased to 24002, 92792, 179772, and 402199, respectively. During the last two weeks, 424 death cases were reported. From December 31, 2021 to April 30, 2022, 114496 symptomatic infected cases were reported.
Figure 1 shows the outcomes of the numbers of the Current Symptomatic Individuals (CSI) and the Current Asymptomatic Individuals (CAI). Figure 2 shows the outcomes of the numbers of the Cumulative Recovered Symptomatic Individuals (CCSI) and the Cumulative Asymptomatic Individuals (CCAI) discharged from observations.

Figure 1:  Blue circles: outcome of the number of the Current Symptomatic individuals (CSI),
 blue line: outcome of the corresponding simulations of equation (1).
  Red circles: outcome of the numbers of the Current Asymptomatic Individuals (CAI) charged in medical observations,
  red line: outcome of the corresponding simulations of equation (1).
  The lines colored by cyan, magenta, green and yellow correspond to the virtual simulation results of equation (1). See Section Mainland Epidemic Virtual Simulations for details.

Figure 2: Blue circles: outcome of the number of the Current Cumulative recovered Symptomatic Individuals (CCSI), blue line: outcome of the corresponding simulations of equation (1). Red circles: outcome of the number of the Current Cumulative Asymptomatic Individuals (CCAI) discharged in medical observations, red line: outcome of the corresponding simulations of equation (1).  Black circles: outcome of the number of the Current Cumulative died Individuals (CCAI). ( Black line: outcome of the corresponding simulations of equation (1). The lines colored by cyan, magenta, green and yellow correspond to the virtual simulation results of equation (1). The dotted lines colored by blue and red corresponding to virtual simulation results for the cumulative died individuals. See
Section Mainland Epidemic Virtual Simulations for details.
On day 17 (January 17, 2022), the number of the current symptomatic infections reach a first turning point (3530 individuals). Then the number were decreasing until day 43 (February 12, 2022), reaching a valley (1397 individuals).
After day 43, the numbers of the current symptomatic and asymptomatic infected individuals were both increasing (in oscillating ways) until reached to the second turning points (31421 and 283024 individuals) on day 110 (April 20) and day 106 (April 16), respectively.
During the last two weeks, the numbers of the current symptomatic and asymptomatic individuals were both deceasing significantly (30384~24002 and 283024~179772), and the cumulative died symptomatic individuals reached 424 individuals.
In order to interpret numerically the dynamics of the above epidemics, estimate numerically the transmission rates and blocking rates to symptomatic and asymptomatic infections, we need to set up mathematic models (similar to [12,14]) to simulate the dynamics of spread of infection disease. Because we modeling uniformly the epidemic situations appeared in different provinces and regions, the transmission rates βij of symptomatic infections and asymptomatic infections are changing over different transmission intervals.
For the mainland epidemics model over the lth transmission interval, there are five five states. I(t), Ia(t), Ir(t), Ira(t), and D(t) representing the fraction of current symptomatic infected individuals (hospitalized), current asymptomatic infected individuals (charged in observations), cumulative recovered symptomatic individuals (discharged from hospitals), cumulative recovered asymptomatic individuals (discharged from observations), and died individuals, respectively. The symptomatic infected individuals (I) and the asymptomatic infected individuals (Ia) infect the susceptible population (S) with the transmission rates of β11(l) and β21(l), respectively, making S become symptomatic infected individuals, and with the transmission rates of β12(l) and β21(l), respectively, making S become asymptomatic individuals. Then, a symptomatic individual is cured at a rate κ(l), an asymptomatic individual returns to normal at a rate κa(l). An symptomatic infected individual dies at a rate α. Here all parameters are positive numbers. Assume that the dynamics of an epidemic can be described by m-time intervals, which correspond different transmission rates, prevention and control measures, and medical effects. At lth time interval, the model has the form [12,14].
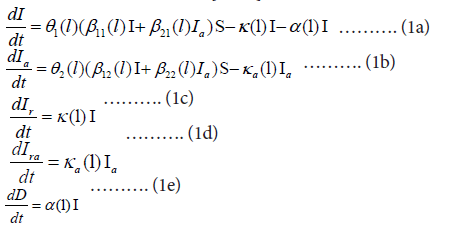
Where Θ1(i) = (1−θ1(l)) and Θ2(l) = (1−θ2(l)) (l=1,…,m) represent the blocking rates to symptomatic and asymptomatic infections, respectively.
It can be assumed that the input transmissions can be divided into 17 time intervals (see the solid dots in Figures 1 and 2). We need to determine the parameters of equation (1) for l=1,2,…,17. Over the lth time interval [ tl − l, t l] , Denote
t1=4, t2=11, t3=17, t4=30, t5=43, t6=48, t7=55, t8=64, t9=70, t10=77, t11=82, t12=90,t13=102, t14=107, t15=112, t16=115, t17=120.
Denote Ic(tl) to be the number of the reported current symptomatic infected individuals, and Ica(tl) be the number of the reported current asymptomatic individuals charged in medical observations. Denote Icr(tl) to be the number of the reported current cumulative recovered symptomatic infected individuals, Icra(tl) be the number of the reported current cumulative asymptomatic individuals discharged in medical observations, Dc(tl) be the number of the reported current cumulative died individuals. Using the minimization error square criterion:

determines the βij(l)’s, κ(l)’s, κa(l)’s, θ1(l)’s, θ2(l)’s, and α(l)’s The calculated parameters are shown in Table 1. The corresponding simulation results of equation (1) are shown in Figures 1 and 2. Observe that the simulation results of equation (1) were in good agreement with the data of the COVID-19 epidemics in mainland China (see the solid blue lines, the red lines, and the black line in Figures 1 and 2).
| l | Days | β11(l) | β21(l) | β12(l) | β22(l) | Θ (l) | Θ (l) | κ(l) | κa(l) | α(l) |
|---|---|---|---|---|---|---|---|---|---|---|
| 1 | 0-4 | 0.049056 | 0.072052 | 0.002102 | 0.002102 | 0% | 0% | 0.0172960 | 0.03107000 | 0 |
| 2 | 5-11 | 0.058000 | 0.072052 | 0.000100 | 0.002102 | 10.6% | 99% | 0.0452150 | 0.03131702 | 0 |
| 3 | 12-17 | 0.056600 | 0.072052 | 0.002102 | 0.002102 | 11.8% | 99.6% | 0.0483000 | 0.00061700 | 0 |
| 4 | 18-30 | 0.044400 | 0.072052 | 0.004100 | 0.004100 | 49.59% | 40.95% | 0.0699400 | 0.01275000 | 0 |
| 5 | 31-43 | 0.077340 | 0.071000 | 0.002500 | 0.002500 | 51.02% | 72% | 0.0650000 | 0.05655000 | 0 |
| 6 | 44-48 | 0.124800 | 0.071000 | 0.025000 | 0.025000 | 51.15% | 71.6% | 0.0594400 | 0.04670000 | 0 |
| 7 | 49-55 | 0.124800 | 0.071000 | 0.020900 | 0.020900 | 25.04% | 72.377% | 0.0314600 | 0.03130000 | 0 |
| 8 | 56-64 | 0.124900 | 0.017800 | 0.059000 | 0.059000 | 31.976% | 70.29% | 0.0315600 | 0.01291000 | 0 |
| 9 | 65-70 | 0.125200 | 0.017800 | 0.141000 | 0.141000 | 26.02% | 21.07% | 0.0329400 | 0.00319000 | 0 |
| 10 | 71-77 | 0.287270 | 0.1 | 0.160680 | 0.160680 | 43.238% | 26.337% | 0.0240980 | 0.00468900 | 0.0000270 |
| 11 | 78-82 | 0.287270 | 0.1 | 0.160680 | 0.160680 | 73.263% | 37.524% | 0.0284910 | 0.01894300 | 0 |
| 12 | 83-90 | 0.287270 | 0.1 | 0.294230 | 0.294230 | 87.602% | 39.037% | 0.0398450 | 0.01839630 | 0 |
| 13 | 91-102 | 0.287200 | 0.1 | 0.500010 | 0.500010 | 93.401% | 27.93% | 0.0867320 | 0.01816700 | 0 |
| 14 | 103-107 | 0.287200 | 0.1 | 0.5 | 0.5 | 90.252% | 45.973% | 0.0747380 | 0.06136523 | 0.0000240 |
| 15 | 108-110 | 0.287200 | 0.1 | 0.500010 | 0.5 | 91.693% | 60.786% | 0.0711410 | 0.08755600 | 0.0002420 |
| 16 | 110-115 | 0.287270 | 0.1 | 0.5 | 0.5 | 93.337% | 56.63% | 0.0921265 | 0.08093320 | 0.0010987 |
| 17 | 115-120 | 0.287270 | 0.1 | 0.5 | 0.5 | 92.093% | 76.839% | 0.1199300 | 0.10006000 | 0.0017580 |
| 18 | 121-127 | 0.287270 | 0.1 | 0.5 | 0.1 | 97.57% | 77.476% | 0.1650770 | 0.1232887 | 0.001060 |
| 19 | 128-135 | 0.287270 | 0.1 | 0.5 | 0.1 | 96.878% | 82.469% | 0.0995065 | 0.1036150 | 0.000668 |
Table 1: AEquation parameters of the COVID epidemics in mainland China during 2021.12.31- 2022.4.30.
Foreign input COVID-19 epidemics in China: On December 31, 2021 (denoted by day 0 ), the numbers of the current symptomatic infected individuals, the current asymptomatic infected individuals charged in observations, the cumulative recovered symptomatic individuals, the cumulative recovered asymptomatic individuals discharged in observations were 802, 485, 33, and 22 respectively. There were no COVID-19 related death reports for many months. After four months, on April 30, the number of the current symptomatic infected individuals decreased to 156; the numbers of the current asymptomatic infected individuals charged in observations, the cumulative recovered symptomatic individuals, the cumulative recovered asymptomatic individuals discharged in observations reached 590, 7721, and 7271, respectively. No death cases were reported. From December 31, 2021 to April 30, 2022, there were 7104 symptomatic infected cases to be reported.
Figure 3 shows outcomes of the numbers of the Current Symptomatic Individuals (CSI) and the Current Asymptomatic Individuals (CAI). Figure 4 shows outcomes of the numbers of the Cumulative recovered Symptomatic Individuals (CCSI) and the Cumulative Asymptomatic Individuals (CCAI) discharged from observations.

Figure 3: Blue circles: outcome of the number of the Current Symptomatic Individuals (CSI), blue line: outcome of the corresponding simulations of equation (2). Red circles: outcome of the numbers of the Current Asymptomatic Individuals (CAI) charged in medical observations, red line: outcome of the corresponding simulations of equation (2).  The lines colored by cyan and magenta correspond to the virtual simulation results of equation (2). See Section Foreign Input Epidemic Virtual Simulations for details.

Figure 4: Blue circles: outcome of the number of the Current Cumulative recovered Symptomatic Individuals (CCSI), blue line: outcome of the corresponding simulations of equation (2). Red circles: outcome of the numbers of the Current Cumulative Asymptomatic Individuals (CCAI) discharged in medical observations, red line: outcome of the corresponding simulations of equation (2). The lines colored by cyan and magenta correspond to the virtual simulation results of equation (2). See Section Foreign Input Epidemic Virtual Simulations for details.
The number of the current symptomatic individuals reached the first turning point (1286 individuals) on day 16 (January 16, 2021). Then the number were decreasing until day 41 (February 10, 2022), reaching a valley (636 individuals). After day 41, the number of the current symptomatic individuals began to increase until on day 73 (March 15) to reach the second infection turning point (2612 individuals). Then the number were decreasing and reached 156 individuals on day 120 (April 30).
The number of the current asymptomatic individuals charged in medical observations reached the first infection turning point (778 individuals) on day 35 (February 4). Then the number were decreasing until day 52 (February 21, 2022), reaching a valley (568 individuals). After that number began to increase until on day 76 (March 16) to reach the second infection turning point (1802 individuals). Then the number were decreasing and reached 590 individuals on day 120 (April 30).
For the foreign input COVID-19 infected individuals, they were discovered immediately and no further transmissions generated each other after entering China. Therefore the model has simply the form
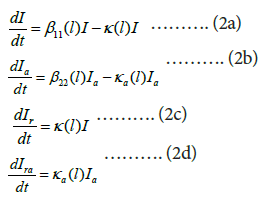
Where β11(l) and β22(l) represent input transmission rates of the symptomatic individuals and asymptomatic individuals over the lth time interval, respectively.
It can be assumed that the input transmissions can be divided into 16 time intervals (see solid points in Figures 3 and 4). We need to determine the parameters for equation (2) for l=1, 2, . . . , 15 over the lth time interval (tl−1, tl).
Denote
t1=10, t2=16, t3=20, t4=30, t5=41, t6=49, t7=53, t8=64, t9=73, t10=76, t11=82, t12=90, t13=99, t14=106, t15=115, t16=120.
Denote Ic(tl) to be the number of the reported current symptomatic infected individuals, and Ica(tl) be the number of the reported current asymptomatic individuals charged in medical observations. Denote Icr(tl) to be the number of the reported current cumulative recovered symptomatic infected individuals, and Icra(tl) be the number of the reported current cumulative asymptomatic individuals discharged from medical observations. Using the minimization error square criterion:

determines the β11(l)’s, β22(l)’s, κ(l)’s and κa(l)’s. The calculated parameters are shown in Table 2. The corresponding simulation results of equation (2) are shown in Figures 3 and 4. Observe that the simulation results of equation (2) were in good agreement with the data of the foreign input COVID-19 epidemics (see the solid blue lines and the red lines in Figures 3 and 4). On the end points of the 16 investigated time-interval (tl−1, tl)′s, the simulated numbers and the actual reported numbers were approximate the same errors were less than one person, respectively.
| l | Days | β11(l) | β22(l) | κ(l) | κa(l) |
|---|---|---|---|---|---|
| 1 | 0-10 | 0.065980 | 0.059898 | 0.031686 | 0.025982 |
| 2 | 11-16 | 0.048874 | 0.036028 | 0.027328 | 0.033269 |
| 3 | 17-20 | 0.029875 | 0.038568 | 0.044693 | 0.028647 |
| 4 | 21-30 | 0.028319 | 0.044800 | 0.061721 | 0.049466 |
| 5 | 31-41 | 0.039880 | 0.055930 | 0.0681460 | 0.048460 |
| 6 | 42-49 | 0.071610 | 0.033290 | 0.0299600 | 0.058598 |
| 7 | 50-53 | 0.108100 | 0.051367 | 0.0299600 | 0.058598 |
| 8 | 54-64 | 0.097320 | 0.092677 | 0.0241330 | 0.035659 |
| 9 | 65-73 | 0.049520 | 0.075400 | 0.0344695 | 0.030710 |
| 10 | 74-76 | 0.034320 | 0.069930 | 0.0669980 | 0.032389 |
| 11 | 77-82 | 0.038166 | 0.060467 | 0.1381240 | 0.091284 |
| 12 | 83-90 | 0.053600 | 0.069155 | 0.1318500 | 0.098770 |
| 13 | 91-99 | 0.070690 | 0.071710 | 0.1243000 | 0.098700 |
| 14 | 100-106 | 0.060960 | 0.098400 | 0.1347000 | 0.121250 |
| 15 | 107-115 | 0.063640 | 0.105233 | 0.0893800 | 0.136545 |
| 16 | 116-120 | 0.051440 | 0.125180 | 0.1043100 | 0.127220 |
Table 2: Equation parameters of the foreign input COVID epidemics in mainland China during 2021.12.31-2022.4.25.
Results and Discussion
Mainland epidemics
Recent China COVID-19 epidemics with both Omicron and Delta variants make more difficult to prevent spread of the diseases. On the end points of the 17 investigated time-interval (tl−1, tl)′s, that is on day 0, day 4, day 11, day 17, day 30, day 43, day 48, day 55, day 64, day 70 day 77 day 82, day 90, day 102, day 107, day 110 day 115, and day 120, we obtain the following results (also see Figures 1 and 2).
(1) On day 11, there was only 1 difference between the numbers of the reported and the simulated current symptomatic individuals. On the other end point days, the numbers of the reported and the simulated current symptomatic individuals were approximate the same.
(2) On day 11 and day 17, there were eleven and three differences between the numbers of the reported and the simulated current asymptomatic individuals charged in observations. On the other end point days, the numbers of the reported and the simulated current asymptomatic individuals charged in observations were approximate the same.
(3) On day 11, and day 17, there was only one difference between the numbers of the reported and the simulated current cumulative recovered symptomatic individuals. On the other end point days, the numbers of the reported and the simulated current cumulative recovered symptomatic individuals were approximate the same.
(4) On day 11 and day 17, there were one and four differences between the numbers of the reported and the simulated current cumulative asymptomatic individuals discharged from observations. On the other end point days, the numbers of the reported and the simulated current cumulative asymptomatic individuals discharged from observations were approximate the same.
(5) On the end points of the 17 investigated time-interval (tl−1, tl)′s, the numbers of the reported and the simulated death individuals were approximate the same.
• During the first month (December 31 2021-January 30 2022), the transmission rates β11(l)′s of the symptomatic infections caused by the symptomatic individuals showed fluctuations. The maximal transmission rate was about 0.0580 during 5 and 10-day (January 5-January 11) period. The minimal one was about 0.0444 during 18 and 30 day (January 17-January 30) period. Then the transmission rates were increasing from day 31 (January 30) to day 77 (March 18) to have reached a maximal value 0.2872, Then it kept unchanged until the last investigated day 120 (Table 1).
• During the first 55 days (before February 25), the transmission rates β21(l)′s of the symptomatic infections caused by the asymptomatic individuals almost did not changed– in a rang 0.071-0.072. Following two weeks (day 56 to day 70), the transmission rate reached minimal value 0.0178. From day 70 to day 120, the transmission rate increased to 0.1 and kept unchanged (see Table 1). The transmission rates β12(l)′s of the asymptomatic infections caused by the symptomatic individuals showed fluctuations. The maximal transmission rate was about 0.025 during 44 and 48-days (February 23-February 27) period. The minimal one was about 0.0021 during 0 and 17-days (December 31 2021-January 17 2022) period. Then the transmission rates were increasing from day 56 (February 25 to day 91 (April 1) to have reached a maximal value about 0.5, Then it kept unchanged until the last investigated day 120 (see Table 1).
• During the first 18 days (December 31 2021-January 17 2022) the transmission rates β22(l)′s of the asymptomatic infections caused by the asymptomatic individuals were very close to the maximal ones during 91 and 120-days (about 0.094:0.1). During 31 and 90 days, the transmission rates β22(l)′s were very low in a rang 0.003-0.009. However during 65 and 90 days period (March 6-March 31), the low blocking rates κa(l)′ to asymptomatic infections made the number of asymptomatic individuals were increasing and was much higher than the number of symptomatic individuals at day 90 (57874:29306, see Table 1 and Figure 1).
• The blocking rates Θ1 (l) 's and Θ2(l) 's to symptomatic and asymptomatic infections were not hight. Even on day 90 (March 31), the blocking rates only reach about 87.6% and 39.0% (see Table 1), respectively. However, for the first and second epidemics in Beijing and the five wave epidemics in Shanghai, the blocking rates reached to over 95% in one month [14].
• The recovery rates κ(l)′s of the symptomatic individuals waved showed fluctuations. The smallest recovery rate was about 0.0173 during the first 5 days. The second minimal recovery rates were between about 0.241 and 0.0329 during 49 and 82 days (February 18-March 23) period. During 91 and 120 days (February 18-March 23) period, the recovery rates increased significantly to about 0.8673-0.1199.
• Before day 77, there were no reported death cases. During 77 and 106 days (March 18-April 16) there were only two reported death cases. The death rate (i) increased significantly after day 107, particularly during the last five days (see Figure 1). The cumulative death number reached 424 at the last investigated day April 30.
Foreign input epidemics
It seems that the foreign input COVID-19 infected individuals have been obtained good managements and therapies. On the end points of the 16 investigated time-interval (tl−1, tl)′s, that is on day 0, day 10, day 16, day 20, day 30, day 41, day 49, day 53, day 64, day 73 day 76 day 82 day 90, day 99, day 106, day 115 and day 120, we obtain the following results (also see Figures 3 and 4).
(1) On the end points of the 16 investigated time-interval (tl−1, tl)′s, the numbers of the reported and the simulated current symptomatic individuals were approximate the same.
(2) On the end points of the 16 investigated time-interval (tl−1, tl)′s, the numbers of the reported and the simulated current asymptomatic individuals charged in medical observation were approximate the same.
(3) On the end points of the 16 investigated time-interval (tl−1, tl)′s, the numbers of the reported and the simulated current cumulative recovered symptomatic individuals were approximate the same.
(4) On the end points of the 16 investigated time-interval (tl−1, tl)′s, the numbers of the reported and the simulated current cumulative asymptomatic individuals discharged from medical observations were approximate the same.
• The input transmission rates β11(l)′s of the symptomatic infection individuals infection individuals showed fluctuations. The maximal input transmission rates were between about 0.0973 and 0.1081 during 50 and 64-day (February 19-Match 3) period. The minimal ones were between about 0.0283 and 0.0299 during 17 and 30-day (January 17-January 30) period (see Table 2).
• The input transmission rates β22(l)′s of the asymptomatic infection individuals showed also fluctuations. The maximal input transmission rates were between about 0.0984 and 0.1252 during 100 and 120-day (April 10-April 30) period. The minimal one was about 0.0333 during 42 and 49-day (February 11-February 18) period (see Table 2).
• The recovery rates κ(l)′s of the symptomatic individuals showed fluctuations. The maximal input recovery rates were between about 0.0894 and 0.1381 during 77 and 120-day March 18–April 30) period (see Table 2). The minimal ones were between about 0.0241 and 0.0300 during 50 and 64-day (February 19-March 3) period (see Table 2).
• The recovery rates κ(l)′s of the asymptomatic individuals waved showed fluctuations. The maximal input recovery rates were between about 0.1213 and 1366 during 100 and 120-day (April 10-April 30) period (see Table 2). The minimal one was about 0.0260 during 0 and 10-day (December 31, 2021-January 9 2022) period (see Table 2).
Comparing
• The average recovery rate of the foreign input COVID-19 symptomatic infected individuals was about 0.07272. The average recovery rates of the mainland COVID-19 infected asymptomatic individuals was about 0.05519. The average recovery rate of the foreign input individuals was much higher than the one of the mainland people (see κ(l)’s in Tables 1 and 2).
• The average recovery rate of the foreign input COVID-19 asymptomatic infected individuals was about 0.06745. The average recovery rate for mainland COVID-19 infected asymptomatic individuals was about 0.036266. The average recovery rate of the foreign input individuals was much higher than the one of the mainland people (see κa(l)′s in Tables 1 and 2).
• The average input transmission rate of the foreign input symptomatic infection individuals was about 0.05701, which was much lower than the average transmission rate 0.18136 of the symptomatic infection causing by the mainland symptomatic individuals (see β11(l)′s in Tables 1 and 2).
• The average input transmission rate of the foreign input asymptomatic infection individuals was about 0.06800, which was much higher than the average transmission rate 0.04907. of the asymptomatic infection causing by the mainland symptomatic individuals (see β22(l)′s in Tables 1 and 2).
• During the last 10 days’ prevention measures implemented for mainland COVID-19 infected individuals reduced significantly the spread speed of the symptomatic infections (see Figure 1 and Table 1). However it needs more effective prevention measures such that the numbers of the infected symptomatic and asymptomatic individuals decrease more rapidly.
• During days 83 to 120, the ratio of the average blocking rates of the asymptomatic infection and the symptomatic infection of the mainland epidemic was about 0.5602 (51.20:91.396). Therefore it needs to increase largely the blocking rates to the asymptomatic infection.
Mainland epidemic virtual simulations
Assume that after day 115 (April 24, 2022), it still keeps the transmission rates βij’s, the blocking rates (Θ 1(17), Θ 2(17)) the recovery rates κ(17), κa(17), and death rate α(17) until day 150 (May 30, 2022). The simulation results of equation (1) are shown in Figure 1 and Figure 2 by cyan lines magenta lines, and black line, respectively. Calculated results show that on day 150, the numbers of current symptomatic and the asymptomatic infected individuals reach about 5466 and 31217, respectively. The numbers of cumulative recovered symptomatic individuals and cumulative asymptomatic individuals discharged in medical observations reach about 139363 and 654006, respectively. The number of cumulative died asymptomatic infected individuals reach about 1107.
Furthermore assume that after day 115, it still keeps the transmission rates βij’s, and recovery rates κ(17), κa(17), and death rate α but increases the blocking rates to (Θ1 ,Θ2 ) (99%, 99%) until day 150. The simulation results of equation (1) are shown in Figures 1 and 2 by green lines, yellow lines, dot blue line and dot red line, respectively. Calculated results show that on day 120, the numbers of current symptomatic and the asymptomatic infected individuals reach about 890 and 9362, respectively. The numbers of cumulative recovered symptomatic individuals and cumulative asymptomatic individuals discharged in medical observations reach about 117868 and 575385 respectively. The number of cumulative died asymptomatic infected individuals reach about 792.
Foreign input epidemic virtual simulations
Assume that after day 120 (April 30, 2022), it still keeps the transmission rates β11(16), β22(16), the recovery rates κ(11), and κa(11) until day 150 (May 30, 2022). The simulation results of equation (2) are shown in Figures 3 and 4 by cyan lines and magenta lines, respectively. Calculated results show that on day 150, the numbers of the current symptomatic and the asymptomatic infected individuals reduce to 32 and 555, respectively. The numbers of cumulative recovered symptomatic individuals and cumulative asymptomatic individuals discharged from medical observations reach about 7966 and 9455, respectively.
Concluding remarks
(1) The main contributions of this paper are summarized as follows: It is the first time to summary the COVID-19 epidemic from December 31 2021 to April 30, 2022 in mainland China. It shows a clear picture to prevent and control the spread of the COVID-19 China epidemics [13].
(2) It uses two models to simulate the recent China epidemics. The simulation results on the end points of transmission intervals were in good agreement with the real word data [13], in particular the case for foreign input infections.
(3) The simulation results can provide possible interpretations and estimations of the prevention and control measures, and the effectiveness of the treatments.
(4) The recovery rates of the foreign input symptomatic and asymptomatic infected individuals were much higher than those of the mainland COVID-19 infected individuals.
(5) Virtual simulations suggest that
• The evolution of the number of the current symptomatic individuals may be located in the region between the cyan line and the green line shown in Figure 1 if the recovery rates and treatment efficacy keep the levels on April 30, 2022, depending on practical blocking rates to infections. Similarly, the evolution of the number of the current asymptomatic individuals charged in medical observations may be located in the region between the magenta line and the yellow line shown in Figure 1.
• The evolution of the number of the current cumulative recovered symptomatic individuals may be located in the region between the cyan line and the green line shown in Figure 2. The evolutions of the number of the current cumulative asymptomatic individuals discharged in medical observations may be located in the region between the magenta line and the yellow line shown in Fig. 2. The evolution of the number of the death individuals may be located in the region between the dot blue line and the dot red line shown in Figure 1.
• Although the infection turning points have appeared, it needs to rise the recovery rates κ(l)’s, κa(i)’s, and the blocking rates Θ1 (l) 's and Θ2 (l) 's of the mainland COVID-19 infected individuals to reduce the spreads of the COVID-19 epidemics such that the numbers of the current symptomatic and asymptomatic individuals to close the green line and yellow line levels. respectively.
• Keeping the measures implemented during days 107-120 (April 16-30, 2002) can rapidly reduce the number of foreign input infected individuals to a very low level in one month.
(6) Different combinations of the nine parameters of Equation (1) may generate similar simulation results. Therefore it needs further study to obtain better parameter combinations to interpret the COVID-19 epidemics in mainland China.
A recommendation is that the administration should at least maintain the prevention and control measures implemented 7 days after reaching the turning point [12]. Figure 1 and Table 1 suggest that the importance of the recommendation.
It is not wise strategy to withdraw all prevention and control measures before the number of the all infected people have been cleared. 100% blocking the speed at which COVID-19 infection spreads is key Strategies for early clearance or reduction of epidemic spread possible [12].
Conclusion
More strict prevention and control strategies are necessary to prevent the spread of COVID-19 with Omicron and Delta variations. It is expected that this research can provide better understanding, interpretation and leading the spread and control measures of epidemics.
Funding
The author has not declared a specific grant for this research from any funding agency in the public, commercial or not for profit sectors.
Conflict of Interest
The author declares no potential conflict of interest.
Data Availability Statement
Data are available on reasonable request. Please email the author.
Ethical Statement
Not applicable/No human participants included
References
- Coronavirus disease (COVID-19) pandemic, World Health Organization, 2019.
- Daley DJ, Gani J (2001) Epidemic modelling: An introduction. 1st ed. England, Cambridge University Press, United Kingdom.
- Zhao S, Chen H (2020) Modeling the epidemic dynamics and control of COVID-19 outbreak in China. Quant Biol 8:11-19.
[Crossref] [Google Scholar] [PubMed]
- Yang Z, Zeng Z, Wang K, Wong SS, Liang W, et al. (2020) Modified SEIR and AI prediction of the epidemics trend of COVID-19 in China under public health interventions. J Thorac Dis 12:165-174.
[Crossref] [Google Scholar] [PubMed]
- Zhao S, Lin Q, Ran J, Musa SS, Yang G, et al. (2020) Preliminary estimation of the basic reproduction number of novel coronavirus (2019-nCoV) in China, from 2019 to 2020: A data-driven analysis in the early phase of the outbreak. Int J Infect Dis 92:214-217.
[Crossref] [Google Scholar] [PubMed]
- Roosa K, Lee Y, Luo R, Kirpich A, Rothenberg R, et al. (2020) Real-time forecasts of the COVID-19 epidemic in China from February 5th to February 24th, 2020. Infect Dis Model 5:256-263.
[Crossref] [Google Scholar] [PubMed]
- Tang B, Bragazzi NL, Li Q, Tang S, Xiao Y, et al. (2020) An updated estimation of the risk of transmission of the novel coronavirus (2019-nCov). Infect Dis Model 5:248-255.
[Crossref] [Google Scholar] [PubMed]
- Li X, Li Z. Study on transmission model of the novel coronavirus. Science Paper Online. 2020.
- Chintalapudi N, Battineni G, Sagaro GG, Amenta F (2020) COVID-19 outbreak reproduction number estimations and forecasting in Marche, Italy. Int J Infect Dis 96:327-333.
[Crossref] [Google Scholar] [PubMed]
- Chang SL, Harding N, Zachreson C, Cliff OM, Prokopenko M (2020) Modelling transmission and control of the COVID-19 pandemic in Australia. Nat Commun 11:5710.
[Crossref] [Google Scholar] [PubMed]
- Niu R, Chan YC, Wong EWM, van Wyk MA, Chen G (2021) A stochastic SEIHR model for COVID-19 data fluctuations. Nonlinear Dyn 6:1-13.
[Crossref] [Google Scholar] [PubMed]
- Min L (2022) Summaries, analysis and simulations of COVID-19 epidemics in Shanghai. J Infect Dis Ther 10:1-6.
- Coronavirus disease (COVID-19) pandemic, World Health Organization, 2019.
- Min L (2021) Modelling, simulations and analysis of the first and second COVID-19 epidemic in Beijing. MedRxiv 4:1-17.
Citation: Min L (2022) Summaries, Analysis and Simulations of Recent COVID-19 Epidemics in Mainland China. J Infect Dis Ther 10: 505. DOI: 10.4172/2332-0877.1000505
Copyright: © 2022 Min L. This is an open-access article distributed under the terms of the Creative Commons Attribution License, which permits unrestricted use, distribution, and reproduction in any medium, provided the original author and source are credited.
Select your language of interest to view the total content in your interested language
Share This Article
Recommended Journals
Open Access Journals
Article Tools
Article Usage
- Total views: 2995
- [From(publication date): 0-2022 - Dec 22, 2025]
- Breakdown by view type
- HTML page views: 2451
- PDF downloads: 544