Tectonic Analysis of a Perseverant Disfigurement of a Zuma II Entry Route
Received: 04-Dec-2018 / Accepted Date: 20-Dec-2018 / Published Date: 27-Dec-2018 DOI: 10.4172/2157-7617.1000501
Abstract
This research probe centers on unravelling the cause of a perseverant disfigurement of a Zuma II entry route from the tectonic standpoint. Seismic, magnetometry, and gravimetry approaches are employed in the tectonic analysis of the region under investigation. Traffic and Satellite maps of Bwari and study area is generated; data of magnetic and gravity intensity against location are tabulated; eleven seismograms of Earthquake magnitude on the Richter Scale are produced; graphs of gravitational intensity and magnetic intensity each against distance, are plotted. Conclusions, robust enough for this analysis, are drawn. Magnetic intensity peaked as much as 58 μT indicative of electromagnetic radiation escape. The repeated 4.3 Richter magnitude scale readings is indicative of the fragility and motion of the region. The folds are indicative of intense tectonic activities within the subsurface.
Keywords: Seismograms; Gravitational intensity; Magnetic intensity; Richter Magnitude Scale
Introduction
Nigeria is becoming tectonically active owing to earth tremor occurrences and reportages by Akpan and Yakubu [1]. Abuja have had its fair share of the ground-shaking event and in other to reduce the future damages that this event could cause, it has become necessary to monitor tectonic activities within Veritas University entry route in Zuma II, Abuja. The entry route into Veritas University within Zuma II settlement deeply gullied, owing to concealed perseverant mainspring. Subsequent coatings and repairs could not annihilate the disfigurement on the route—buckles and folds are spotted. Seismometers, gravity meters and magnetometers are employed for analyzing the geotechnical assault to this route.
Location of study area
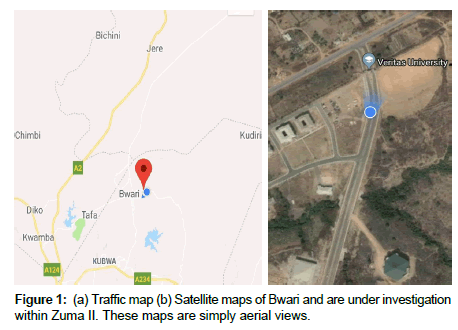
Dikedi [2] cites Mamman and Oyebanji [3] reportages that the Federal Capital Territory (FCT) covers 8000 km2 area, more than twice the area of Lagos state. Underlying the FCT, almost predominantly are, high grade metamorphic and igneous rocks of the Precambrian age. The entry route to Veritas University is under Geophysical investigation and is located within Zuma II settlement in FCT. This route, somewhat undulating, is surrounded by hill clusters, varied tree sizes, shrubs, rock outcrops, uneven gullies and few blocks for academic activities (Figures 1a and 1b) Eleven locations separated by 20 m, were investigated: N 9.2882°N and 7.4175°E, 9.2882°N and 7.4175°E, 9.2884°N and 7.4174°E, 9.2886°N and 7.4172°E, 9.2887°N and 7.4173°E, 9.2889°N and 7.4173°E, 9.2891°N and 7.4171°E, 9.2894°N and 7.4168°, 9.2893°N and 7.4172°, 9.2895° and 7.41710E and 9.2897°N and 7.4169°E.
Past research works
Earth tremor events are well documented [4-12], suggests from a multi-year analysis of Earth tremor that there is a continuous excitation of Earth normal modes by ocean storms; the work exposes unexplained spectral peaks within frequency band of 0.2–2 mHz; worldwide existence of such peaks reassessed. Dikedi [13] suggests that an abrupt frictional sliding occured between networks of fault lines; it was further suggested that there was a likelihood that friction was most intense at the rock slide site on N9027'21.516'' and E800'44.9993''. None of these research probes linked tectonic monitoring to road disfigurements. The current research work addresses how tectonic events could link to magnetic response and road failure.
Methods
Research aim
The aim of this research work is to find a connection between seismic events and disfigurement within the Gabba II settlement, especially in the wake of varied tremors that have rocked varied sites in Nigeria, latest being Abuja, FCT.
Field techniques and procedure
Techniques employed include magneto-metric, gravi-metric and seismic techniques. Seismograms plots on the Richter scale are developed. Gravitational intensity in chl Gal over changing distance in m, is measured and recorded; Magnetic intensity in μT also over distance in m, was generated.
Results and Discussion
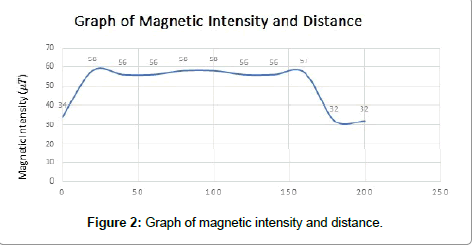
The outcome of results from measured distance, gravitational intensity and magnetic intensity is presented in Table 1. Table 1 is a table of values distance, d in (m), Magnetic intensity, M in μT and Gravitational intensity g in (Gal). Down the columns in Table 1, magnetic intensity data, increases, then decreases with increasing distance; however gravitational intensity decreases appreciably. Magnetic intensity for each location is plotted and presented in Figure 2; this plot shows magnetic intensity peaking at 40 m and 270 m location. Magnetic field intensity sustained its maximum values within 9.2882°N; 7.4175°E and 9.2895°N; 7.4171°E between 25 m and 175 m from the first point of measurement, With in this region folds were harbored, and electromagnetic radiation signals were observed.
| Distance ‘d’ (m) | Magnetic Intensity ‘Mi’ (µT) | Gravitational Intensity ‘g’ in (Gal) |
|---|---|---|
| 0 | 34 | 0.988 |
| 20 | 58 | 1.001 |
| 40 | 56 | 1.003 |
| 60 | 56 | 0.996 |
| 80 | 58 | 1.006 |
| 100 | 58 | 1.014 |
| 120 | 56 | 0.991 |
| 140 | 56 | 0.995 |
| 160 | 57 | 0.992 |
| 180 | 32 | 0.992 |
| 200 | 32 | 0.99 |
Table 1: Table of values distance, d in meters (m), Magnetic intensity, Mi in (µT) and Gravitational intensity (g) in (Gal).
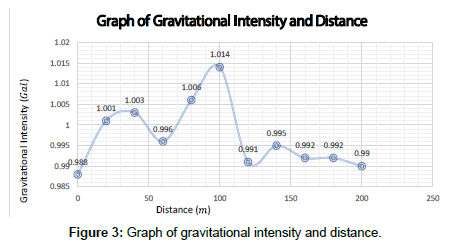
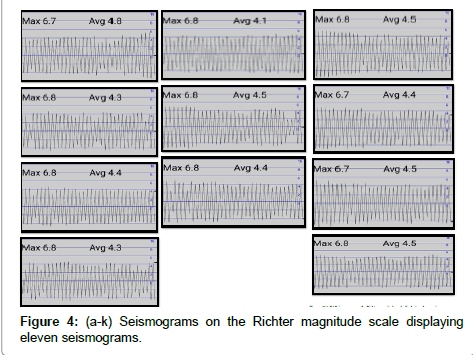
Gravitational intensity for each location is plotted in a graph in Figure 3; this plot shows how gravitational field intensity trends with progressing distance. Gravitational field intensity peaked differently with values of 1.003 Gal., 1.014 Gal and 0.995 Gal; the greatest peak of 1.019 Gal, is located within 9.2886°N; 7.4172°E, and 9.2887°N; 7.4173°E between 80 m and 100 m from the first point of measurement. All three peaks are located within 9.2882°N; 7.4175°E and 9.2895°N; 7.4171°E between 25 m and 175 m from the first point of measurement. This region harbour folds, twist and geotechnical assaults. Dude and Nutti [14] and Piccozi et al. [15] worked on Earthquake magnitude scales and a rapid response magnitude scale for timely assessment of the high frequency seismic radiation respectively-indeed, these scales are helpful in tectonic assessments. The magnitudes of ground vibration on the Richter scale are measured and presented as eleven seismograms in Figures 4a-4k Each seismogram relates amplitude of wiggles to time.
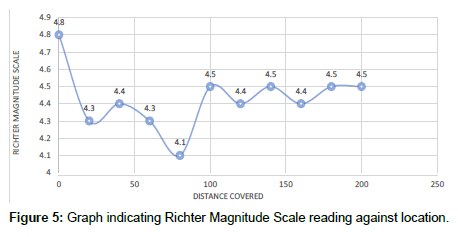
Furthermore, Richter scale magnitude variation for each location is plotted in a graph in Figure 5. Magnitude peaked at the very beginning, the first point of reading. However, the magnitude value dipped the most at about 75 m location from the first point of reading.
Conclusion
An observed sharp rise in magnetic intensity within 20 m at 9.2882° and 7.4175° and 160 m at 0.2893° and 7.4172° from the first location of measurement at 9.2882° and 7.4175° indicates the rich presence of electromagnetic radiation-this radiation probably escaped from the troubled, buckled and punctured regions of the route. Magnetic intensity peaked as much as 58 μT. Furthermore, within 20 m and 120 m from the start point, the average magnitude on the Richter scale showed repeated four-time reading of 4.5 within 100 m and 200 m at 100 m, 140 m, 180 m and 200 m. However, an anomalous magnitude reading of 4.8 on the Richter scale at the start point was observed. The gravitational intensity reading showed 0.988 Gal at the start point. However, this intensity reading peaked at 1.014 Gal at 100 m. The location at 9.2882° and 7.4175° is the lowest part of the route and the location 9.2889° and 7.4173°, 100 m from the earlier location is the highest part of the route. The Richter Magnitude scale readings in this research work is close enough to earth tremor magnitude scales. Indeed, shortly after the readings were observed, earth tremor events happened on September 5, 6 and 7 in Mpape, Maitama, Gwarimpa, Jayi, Jabbi, Katampe, Mabuchi, Utako, Wuye, Wuse 2 and Bwari regions of the FCT. The folds are indicative of intense tectonic activities within the sub-surface.
References
- Akpan OU, Yakubu TA (2010) A review of earthquake occurrences and observations in Nigeria. Earthquake Science 23: 289-294.
- Dikedi PN (2012) Geo-electric probe for groundwater in Giri, Nigeria. GJSFR.
- Mamman AB, Oyebanji JO (2000) Nigeria, a people united, a future assured and survey of states. Garumo Publishing 736-739.
- Shelly P (2006) Low-frequency earthquakes in Shikoku, Japan, and their relationship to episodic tremor and slip. Nature 442: 188-191.
- Rubinstein S (2007) Non-volcanic tremor driven by large transient shear stresses. Nature 448: 579-582.
- Shelly DR, Beroza GC, Ide S (2007) Non-volcanic tremor and low-frequency earthquake swarms in Nature 446: 305-307.
- Honn K, Shao-Ju S, Herb D, Garry R, John FC, et al. (2005) A wide depth distribution of seismic tremors along the northern Cascadia margin Nature 436: 841-844.
- Nakata R, Suda N, Tsuruoka H (2008) Non-volcanic tremor resulting from the combined effect of Earth tides and slow slip events. Nat Geosci 1: 676-678.
- Brudzinski MR, Allen RM (2007) Segmentation in episodic tremor and slip all along Cascadia. Geology 35: 907-910.
- Peng Z, Chao K (2008) Non-volcanic tremor beneath the Central Range in Taiwan triggered by the 2001 Mw 7.8 Kunlun earthquake. Geophys J Int 175: 825-829.
- Dewey J, Byerly P (1969) The early history of seismometry (to 1900) Bulletin of the Seismological Society of America 59: 183-227.
- Mulargia F (2019) Unexplained spectral peaks in Earth tremor. Geophys J Int 216: 515-520.
- Dikedi PN (2017) Geomorphological and geoelectric techniques for Kwoi multiple tremor assessment SAO/NASA ADS Physics Abstract Service, American Geophysical Union, Fall Meeting, USA. Â
- Dude SJ, Nutti OW (1974) Earthquake magnitude scales in Geophysical surveys 1: 429-458.
- Picozzi M, Bindi D, Spallarossa D, Giacomo D, Zollo A (2018) A rapid response magnitude scale for timely assessment of the high frequency seismic radiation in Scientific Reports 8: 8562.
Citation: Dikedi PN (2018) Tectonic Analysis of a Perseverant Disfigurement of a Zuma II Entry Route. J Earth Sci Clim Change 9: 501. DOI: 10.4172/2157-7617.1000501
Copyright: © 2018 Dikedi PN. This is an open-access article distributed under the terms of the Creative Commons Attribution License, which permits unrestricted use, distribution, and reproduction in any medium, provided the original author and source are credited.
Select your language of interest to view the total content in your interested language
Share This Article
Recommended Journals
Open Access Journals
Article Tools
Article Usage
- Total views: 3641
- [From(publication date): 0-2018 - Dec 19, 2025]
- Breakdown by view type
- HTML page views: 2748
- PDF downloads: 893

