The Global Historical Climatological Network v3.2b Albatross
Received: 30-Jun-2014 / Accepted Date: 06-Aug-2014 / Published Date: 16-Aug-2014 DOI: 10.4172/2157-7617.1000212
Abstract
National Oceanic and Atmospheric Administration (NOAA) is an agency of the US Department of Commerce (DOC). They produce a daily and monthly edition of the Global Historic Climatology Network (GHCN) database for global temperature and precipitation information for climatological studies. However, these studies are extremely flawed as no temperature analyses with the GHCN are statistically valid. This paper will demonstrate the statistical flaws in using the temperature database. This study has only looked at the temperature portion of the database.
Keywords: Climate; Temperature; GHCN; NOAA; NCDC; Statistics; Trendlines
6178Introduction
The National Oceanic and Atmospheric Administration (NOAA) divides the globe into 5°x5° grids for the monthly GHCN dataset described at NOAA [1]. The dataset can be obtained at National Climatic Data Centre [2]. The dataset contains monthly global values for each year from 1880 to 2014 as of this writing. The values in the dataset are anomalies times 100.
The anomalies must then be added to a referenced monthly mean value found at Global surface Temperature Anomalies from National Climatic Data Center [3]. Reading the 5°x5° grids are described by NOAA as:
The data are formatted by year, month, latitude and longitude. There are twelve longitude grid values per line, so there are 6 lines (72/12=6) for each of the 36 latitude bands. Longitude values are written from 180W to 180E, and latitude values from 90N to 90S. Data for each month is preceded by a label containing the month and year of the gridded data.
for year=begin yr to end yr
for month=1 to 12
format(2i5) month, year
for ylat=1 to 36 (85-90N,80-85N,...,80-85S,85-90S)
format(12i5) 180-175W,175-170W,...,130-125W,125-120W
format(12i5) 120-115W,175-170W,...,70-65W,65-60W
format(12i5) 60-55W,55-50W,...,10-5W,5-0W
format(12i5) 0-5E,5-10E,...,50-55E,55-60E
format (12i5) 60-65E,65-70E,...,110-115E,115-120E
format (12i5) 120-125E,125-130E,...,170-175E,175-180E
Upon a precursory examination of the data it became obvious that there was a fundamental issue as shown in Figure 1. Calculating the Earth’s temperature when the cells with a value represent only 7% to 22% of the Earth’s total surface area is very troubling and the fact that the best percentage the dataset refers to is less than 25%. Unless the sites have been strategically located to adequately represent the Earth’s temperature regions and their values validated or the sites are random locations which they are explained by Michael E Mann [4], then NOAA has created a grave statistical problem in which there is no valid statistical solution. IBM in their use of the statistical package SPSS said
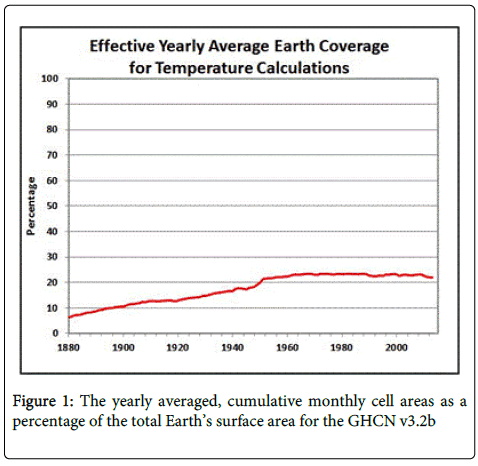
Figure 1: The yearly averaged, cumulative monthly cell areas as a percentage of the total Earth’s surface area for the GHCN v3.2b
“. . . variables that have more than 50% missing values are not imputed, nor are they used as predictors in imputation models”.
That is they don’t let you impute more than 50% missing and they are working with a random sample - which NOAA sites are not. Even though that, which has just been presented, is suffcient to statistically reject any data “supporting Global Warming/Cooling”, the examination of NCDC/ NOAA’s suggested procedures for calculating global temperature will be further examined in this study.
The “statistical” and numerical including modeling approaches used and reported in professional journals without anyone asking the fundamental questions about using statistical procedures on non-random samples [5,6]. Furthermore the use of models to supply missing values is problematic at best since none of the models have had independent assessments and none of them have been validated by independent labs or corporations. And validation means more than duplicating historical data. It means proving that each subroutine does as advertised and that the entire model has suffcient data details without using forcing factors for different epochs. And this is what NASA does to fill-in the missing values according to Hanson et al. [6]. Since the weather models used by local weather forecasters is usually accurate for no more than 5 days and climate is weather over time then using these models adds nothing other than bias into our temperature estimates.
Methodology
After acquisition of the GHCN v3.2b dataset, NCDC/NOAA implicitly gives two methods to compute the global mean temperatures in the historical climate dataset [7] (Figure 2). Both methods require a gridding of the Earth in 5°x5° latitude/longitude cells. The first method requires no land/sea mapping into these grids while the second combines the land/sea means and requires a mapping. The global temperature estimates would then be calculated by looping over all the 5°x5° grid locations and (1) taking the anomaly and adding it to the combined mean surface temperature for each month read or (2) using a mapping of land/sea/ice to the grid to select the type of surface before selecting the anomaly to add to the appropriate mean temperature for each month.
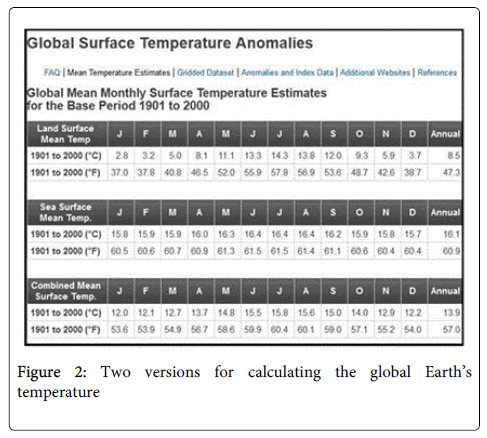
Figure 2: Two versions for calculating the global Earth’s temperature
Using option (2) above requires a mapping tool, which NOAA does not provide. Figure 3 is a visually, reasonable mapping. One assumption in this mapping is the first 20 degrees around a pole is permanent ice and the temperature is –2°C. In places where the ice is over land, the –2°C assumption is much higher than would be measured. In the case where a temperature measurement exists, it is used and not the –2°C assumption. Figure 4 represents the Earth with designations for land, sea and ice-recap.
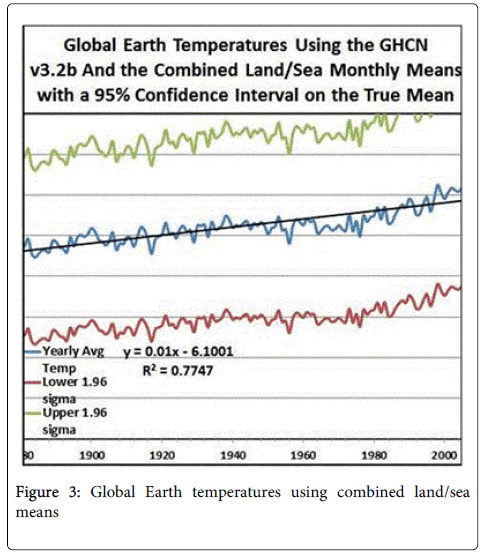
Figure 3: Global Earth temperatures using combined land/sea means
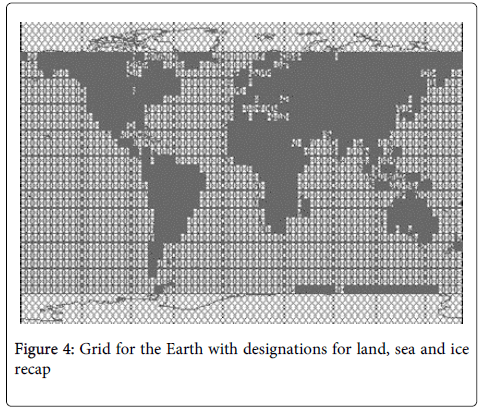
Figure 4: Grid for the Earth with designations for land, sea and ice recap
Results
There are some interesting observations that can be made about Figure 5 which are explicitly shown in Figure 6. First note there are 95% confidence intervals around each average weather point for that year. These bands look like curves drawn above and below the assumed mean values from 1880 to 2014. For example, look at the vertical bar at ‘B’ in Figure 6, the year is 1960 and it has an average temperature of 10.53°C. That is the real mean will lie between 8.67°C and 12.40°C with 95% confidence. This interval is shown as a point on the curve below the average and another above the average. Yet NOAA only presents the average values.
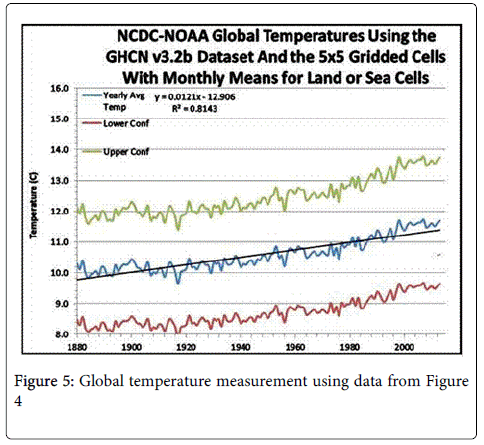
Figure 5: Global temperature measurement using data from Figure 4
They look at the trendline of averages and tell you that its slope says that in a hundred years the average global temperature will increase by 1.2°C, which is 2.2°F. Looking at ‘A’ in Figure 6 you’ll see a trendline from 1968 through 2013 which says that the average temperature increase will only be 0.4°C in a hundred years or look at the red trend line passing through the average near ‘B’ which says that the average global temperature in a hundred years will decrease by 0.9°C. All of these curves fall within the 95% confidence intervals and so are possible alternatives.
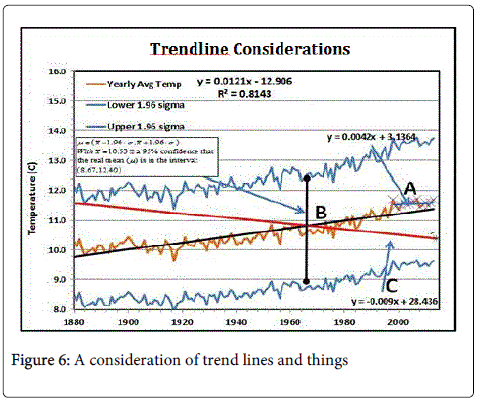
Figure 6: A consideration of trend lines and things
Many references have shown that you cannot make any statistically valid inferences with any confidence when they have more than 50% missing values. But suppose there were methods that have statistical soundness which could reduce the number of missing cells. You could go piecewise through the cells and use numerically-interpolative methods to fill in the empty cells or you could make one major assumption, which is that land observations don’t vary much within the 5°x5° defined latitude bands for ocean temperatures or land temperatures. That means say for latitude ring 12, which is all 72 longitude cells between 35°N and 30°N latitude. Dividing those over land and those over sea, any missing land cell would take on the value of the average land cell in that band and any missing valued cell over the sea would get the averaged sea value. For example, looping over all the cells in this band, first create one sum for cells that are mapped to land and another that are mapped to sea values. Divide each by the number of cells which have valid entries. For each cell that is mapped to land with an invalid value, put the averaged land value in the cell. Do the same for the cells mapped to sea. This process would reduce missing valued cells shown in Figure 1 to those shown in Figure 7 and produce results shown in Figure 8.
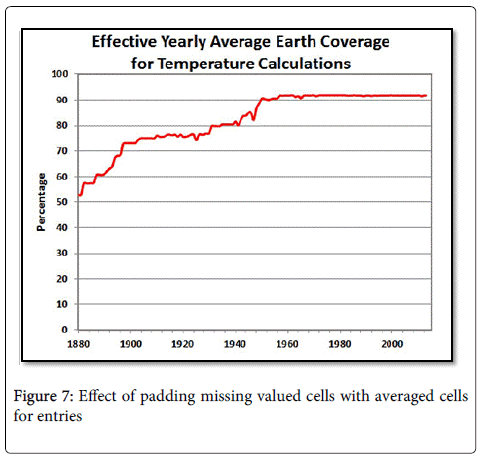
Figure 7: Effect of padding missing valued cells with averaged cells for entries
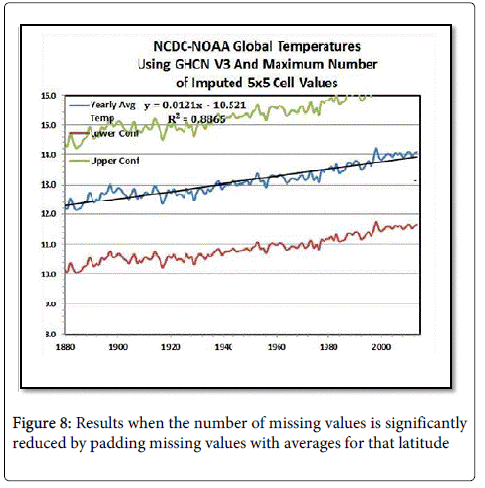
Figure 8: Results when the number of missing values is significantly reduced by padding missing values with averages for that latitude
Look at the differences in temperature for the current time between Figures 3, 5 and 8. There is a 3.7°F or a 2.5°C difference for the averages of 2013. This is primarily the difference between the combined average temperature means and using the means for land and sea as shown in Figure 2. Does NOAA think these are appropriate methods for climatologists to use?
Figure 9 shows what percentage of the total missing valued cells belong to each type of surface area. Ice regions stay constant at about 22% which means NOAA’s global temperature assessments are too warm for the globe since they basically ignore the Polar Regions in their calculations. And since water covers about 70% of the Earth’s surface, but there is no improvement from 1880 to 2013 in sea cover-age. This goes to confirm the assessment that money is the driving force for the location of monitoring stations. It seems like more satellites need to be added into the GHCN data collection process. They say there are satellites providing measurements but Figure 1 begs to differ unless the satellites are incapable of global measurement.
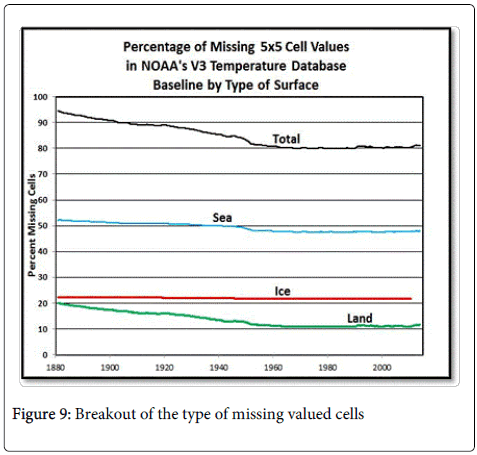
Figure 9: Breakout of the type of missing valued cells
Conclusions
All of this information assumes the data were taken from a random sample which it was not [4]. It was really an issue of money from the very beginning for the locations of weather stations and not any random chance as to the locations of the weather monitoring stations. Money does not in-duce randomness and you can’t use statistical methods on items that have no statistical basis and expect any significant result. Furthermore you cannot try to correlate and find causal relationships between things like CO2 and temperature when no statistics can be involved when there were no random samples taken from a population with so many missing values.
NOAA must either use randomly chosen locations for their monitoring stations or establish full global coverage. Satellites actually provide the best solution to consistent temperature assessments.
Dr. Michael Mann’s “infamous hockey stick” [4] is actually another statistically meaningless study unless he chose random locations for measurements and used similar techniques to measure temperatures from the tree rings. Even doing all that he also had to have some mechanism to measure polar ice temperatures for each of the years. He did none of them.
The GHCN is really an albatross until all the cells are filled by measurements and not numerical schemes. Temperature and most likely precipitation calculations for climatologists definitely should not be made by using the GHCN until such time as the datasets are complete or the data are chosen with a random sample schema from data that comes from something better than that referenced by Figure 1. Furthermore, statistical inferences should not be made from trend lines that have less than an R2 of 90% — note that none of the R2 values in these figures exceed that criterion. You have to fit higher degree polynomials, take the derivative and evaluate it at the end point to get trends. Projections of trends beyond a very few years is always foolhardy. Look at any elementary text on regression analysis and you’ll see broad ranges of uncertainty beyond the last data point.
References
- NOAA (2014) Global Historical Climatology Network-daily, National Climatic Data Centre, USA.
- National Climatic Data Centre (2014) National Oceanic and Atmospheric Administration, USA.
- Global Surface Temperature Anomalies(2014) Monitoring references, National Climatic Data Center, USA.
- Shen SSP, Yin H, Smith TM (2007) An Estimate of the Sampling Error Variance of the Gridded GHCN Monthly Surface Air Temperature Data. J Climate 20: 2321-2331.
- Hansen J, Ruedy R, Sato M, Lo K (2010) Global surface temperature change. Rev Geophys 48.
- Lawrimore JH, Menne MJ, Gleason BE, Williams CN, Wuertz DB, et al. (2011) An overview of the Global Historical Climatology Network monthly mean temperature data set. J Geophys Res 116.
Citation: Van Horn BR (2014) The Global Historical Climatological Network v3.2b Albatross. J Earth Sci Clim Change 5: 212. DOI: 10.4172/2157-7617.1000212
Copyright: ©2014 Van Horn BR. This is an open-access article distributed under the terms of the Creative Commons Attribution License, which permits unrestricted use, distribution, and reproduction in any medium, provided the original author and source are credited.
Select your language of interest to view the total content in your interested language
Share This Article
Recommended Journals
Open Access Journals
Article Tools
Article Usage
- Total views: 14559
- [From(publication date): 9-2014 - Aug 29, 2025]
- Breakdown by view type
- HTML page views: 9978
- PDF downloads: 4581