The Study of Atmospheric Physics Parameters over Iran Using Satellite TRMM-TMI Data
Received: 10-Mar-2015 / Accepted Date: 22-Jun-2015 / Published Date: 30-Jun-2015 DOI: 10.4172/2157-7617.1000281
Abstract
There are a limited number of ground-based hydro-meteorological observation networks in developing countries. However, precipitation estimates can be obtained using aeronautical and remote sensing techniques, and from radiometric observations by satellites with a suitable coverage. In this research, Tropical Rainfall Measuring Mission- TRMM Microwave Imager (TRMM-TMI) data are applied to estimate and investigate the surface, convective, and strati form rain rates using an analysis of surface and cloud liquid water, cloud ice, precipitation water, and precipitation ice in 14 vertical atmospheric levels(from the surface to 18 km above the surface). The TRMM-TMI data has a monthly temporal resolution and 0.5° spatial resolutions, and covers the period 1998-2005 in a binary format. Results show that surface precipitation estimated from TRMM-TMI has the greatest correlation with ground-based data for spring and autumn, but overestimates precipitation rates in the winter, spring, and summer. It was also found that convective and strati form precipitation patterns are the same in autumn and winter over Iran, but are different during the spring and summer seasons, and that most of the surface precipitation is related to convective precipitation. Furthermore the height of the melting level is estimated to be 3-4 km above the surface of the country.
Keywords: TRMM-TMI; Convective and strati form precipitation; Water and ice content; Liquid water and ice precipitation; Satellitebased data; Ground-based data
11477Introduction
There are an insufficient number of meteorological observation networks (meteorological stations) in many developing countries, and those that do exist are sparsely distributed; therefore there is a lack of observational coverage over large and meteorologically important regions. As the observed rainfall data time-series over such areas are not adequately spatially coherent, they are unable to provide accurate and precise information relating to rainfall and other physical parameters of the atmosphere. However, with the advent of meteorological satellites in the1970s, scientists have developed techniques to estimate precipitation from radiometric observations from satellites, which are therefore able to provide wide coverage of such parameters over most of the globe. The first techniques developed used visible or infrared data to infer the precipitation intensity using the reflectivity of clouds (visible) and cloud-top temperature (infrared), but both of these techniques yielded crude estimates of precipitation because of the weak relation between cloud properties and precipitation [1].
The classification of cloud types using satellite data has been the subject of extensive research. Shenk et al. [2], Reynolds and Vonder Haar [3], Adler and Negri [4], and Rossow and Schiffer [5] identified cloud types from visible and infrared satellite data. Furthermore, Alishouse et al. [6] and Greenwald et al. [7] used microwave satellite data to study cloud liquid water paths, and Hong et al. [8] presented a new scheme that classified convective and strati form (C/S) precipitation areas over oceans using microwave brightness temperatures. In the scheme, data are first screened to eliminate pixels that do not contain rain, and using the pixels that contain rain C/S indices are computed from brightness temperatures and their variabilities in relation to emissions (19 and 37 GHz) and scattering (85 GHz).
The Tropical Rainfall Measuring Mission (TRMM) is a joint mission between the National Aeronautics and Space Administration (NASA) of the United States and the National Space Development Agency (NASDA) of Japan. The objectives of TRMM are to measure rainfall and energy (i.e., the latent heat of condensation) exchange in the tropical and subtropical regions of the world. Tropical precipitation generally occurs in the form of organized Meso-Scale Convective Systems (MCSs), which are characterized by the two distinguishable components of convective and strati form (C/S) regions [9,10] (please see Houze [11] for a detailed description of MCSs). The primary rainfall instruments on TRMM are the TRMM microwave imager (TMI), precipitation radar (PR), and a visible and infrared radiometer system (VIRS). Additionally, the TRMM satellite carries two related earth observing system (EOS) instruments in the Clouds and Earth’s radiant energy system (CERES) and the lightning imaging system (LIS). The space segment of TRMM is a satellite with a 350-km circular orbit and a 358° inclination angle. Kummerow et al. [12] explained that it was launched in the summer of 1997 with a predicted mission life of at least three years, and these authors compiled a reference guide for users of the tropical rainfall measuring mission data that relates to the three main rainfall instruments: the passive microwave radiometer, precipitation radar, and the visible and infrared radiometer system on board the spacecraft. It is of note that Turk et al. [13] examined the effects of degraded sensor resolution in passive microwave radiometers aboard satellites upon retrievals of tropical rainfall using fine-scale data derived from aircraft-based instruments. In addition, Kubota et al. [14] developed a correction method (non-uniform beam filling) in rainfall retrievals for passive microwave radiometers over ocean using TRMM observations, and found that the effects of the non-uniform parameter differences on rain retrievals are non-linear, and could be closely related to high background values of the non-uniform parameters in the tropics and the more frequent high rainfall intensities. Furthermore, simultaneous rain observations have been performed aboard the TRMM satellite by the TMI and precipitation radar (PR) [12,15].
An alternative method of determining precipitation types from passive microwave radiation has been the use of multi-frequency profiling algorithms, as described in the early works of Kummerow and Giglio [16,17], Smith et al. [18], and Mugnai et al. [19]. Since these studies however, a number of new satellite rainfall algorithms have been developed to exploit the high sampling rate of geostationary satellites, in addition to the greater accuracy provided by several passive microwave instruments, and more direct rainfall measurements from the precipitation radar on board the TRMM satellite [20]. Bauer et al. [21] investigated a simple approach for use in adjusting microwave brightness temperature distributions obtained from slant-path measurements for projection effects. Compared to the use of shipborne radar data, through the work of Bauer et al. [21] considerable improvements have been made in single-channel rain retrievals-based on 85.5 GHz measurements, which suggests that a major uncertainty of so-called scattering algorithms can be explained by geometry effects that can be easily corrected. Multi-channel algorithms, however, require a more elaborate integration scheme to allow for both frequency and scene-dependent adjustments. Furthermore, Horváth and Gentemann [22] compared the Wentz microwave Liquid Water Path (LWP) with the Moderate Resolution Imaging Spectroradiometer (MODIS) and Multi-angle Imaging Spectroradiometer (MISR) optical retrievals in order to further evaluate the apparent cloud-fraction-dependent bias between algorithms in warm, non-precipitating, marine clouds. The techniques showed good agreement in overcast regions; however, it was found that microwave retrievals increasingly overestimated optical retrievals when the sub-domain cloud fraction decreases.
To evaluate TRMM data, Javanmard et al. [23] attempted to compare the rainfall estimates of TRMM_3B42 with ground-based high-resolution gridded data over Iran. They found that there was good consistency between the rainfall patterns in a comparison of seasonal and annual averages of precipitation in synoptic stations (IS0902) and TRMM_3B42 from 1998 to 2006 in the Caspian Sea and over the Zagros mountain chain. Furthermore, the estimated correlation coefficients between the rainfall averages over the entire country, and along the Caspian Sea and Zagros mountain-chain were found to be 0.77, 0.57, and 0.75, respectively.
Materials and Methods
In this research, TRMM-TMI monthly data were downloaded from the following website: (URL:ftp:disc2.nasacom.nasa.gov/data/TRMM/ Gridded/3A12-v6). The TRMM-TMI observations data are available from 1998, and the spatial distribution of the above mentioned 3A12_ V6 products were derived using GrADS (Grid Analysis and Display System) software under the Linux operating system for the period 1998- 2005. In addition, ground-based rainfall data series were obtained from the Asian Precipitation Highly Resolved Observational Data Integration Towards Evaluation of Water Resources (APHRODITE), and the data sets were arranged on daily and monthly scales using programming by Fortran in relation to the Linux system. Rainfall maps were then drawn using GrADS. TRMM-TMI data were evaluated based on the groundbased rainfall data of APHRODITE, and the study was conducted using satellite images to consider atmospheric parameters in different vertical profiles of the atmosphere. The analyses were conducted based on two methods, visual comparisons and statistical analyses.
Visual comparisons
Precipitation parameters: To analyze the spatial-temporal distribution of the precipitation parameters over Iran, the spatial distribution of monthly mean maps (for 12 months of the year), seasonal averages (for four seasons of the year), and the annual average precipitation rates with the monthly and seasonal graphics (time series) of precipitation averages were produced using the TRMM-3A12 data and ground-based precipitation data series via the GrADS software.
Parameters including convective and strati form precipitation, and ice and water liquid precipitation: To analyze the spatial-temporal distribution of convective and strati form precipitation and the ice and water liquid precipitation parameters at different atmospheric levels (from the ground’s surface to a height of 18 km), spatial distribution maps were produced on monthly, seasonal, and annual scales with monthly and seasonal graphics (time series), using the TRMM-3A12 satellite data programmed by GrADS.
Statistical analysis
Statistical analysis was conducted using various methods, such as the spatial-temporal correlation coefficient, bias, standard deviation, and Root Mean Square Error (RMSE) in order to obtain the error in the amount of precipitation estimated by TRMM.
Study area
The study region was the entire region of Iran, which measures 1,640,195 km² and is situated between 25°: 03'N–39°: 47'Nand 44°:14' E-63°:20' E, with an average height above sea level (ASL) of 1200 m (Damavand peak is located in the Alborz mountains, and has an altitude of 5610 m, while the southern shore of the Caspian Sea has the lowest height of 28 m below sea level). More than 50% of the country is mountainous, 25% consists of plains, and less than 25% is arable land. Two dry deserts, the Dasht-e Lut and Dasht-e kavir deserts are found in the central area of the country. The Alborz mountain chain is located near the Caspian Sea and spreads from east to west with a maximum height of 5000 m ASL, and the Zagros chain spreads from northwest to the southeast and reaches a maximum height of 3500 m ASL. These topographical features play an important role in determining the amount and distribution of rainfall across the country (Figure 1).
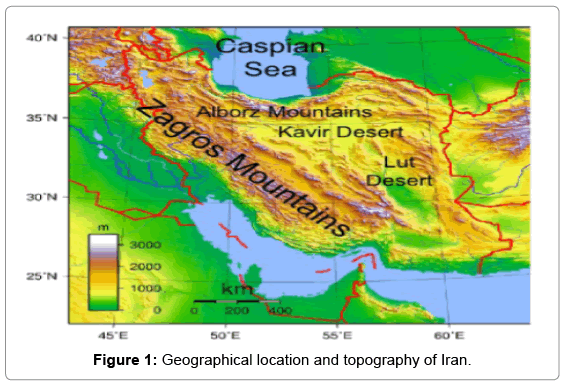
Figure 1: Geographical location and topography of Iran.
In the winter season, the climate of the country is affected by the Siberian Thermal Anticyclone along with Dynamical Low Pressures, which originate from the Mediterranean Sea and sometimes traverse the country. In summer, there is a lack of precipitation over most areas of Iran, due to the formation of heat lows that lead to an anticyclonegenesis and a lack of wave-cyclones over the Mediterranean region, and the mean temperature soars. However, light precipitation occurs in the northwest of the country (Azerbaijan region) during summer, and the coastal areas of the Caspian Sea. Furthermore, Monsoon precipitation sometimes influences the southeast of the country in summer. In the autumn, transitional cyclones frequently traverse the country, and these then progressively dominate during winter over most parts of Iran (northwestern, northern, and western regions), and can also affect southern and eastern regions. The existence of the Zagros mountain chain (from northwest to southeast) is a wide orographic obstacle, and can therefore cause westerly cyclones to deliver precipitation over western regions during winter. The seasonal distribution of precipitation indicates that the maximum amount of annual precipitation usually occurs in most parts of the country during winter, while the provinces around the Caspian Sea (such as Guilan and Mazandaran) and the northwest of Iran (Azarbayjan region) usually receive the maximum amount of precipitation in autumn and spring, respectively [24].
Results
Evaluation of surface rainfall rate
Monthly visual comparison: The spatial distribution of surface rain rates (mm/h) over Iran were derived from January–December 1998–2005 and these are shown for selected months in Figure 2. An analysis of the surface rain rate over Iran indicates that there are three regions in Iran that experience a high rainfall amount. The first region is located along the Caspian Sea, and this area experiences a maximum amount of precipitation in summer (from late spring to early autumn); the second region is located along the Zagros mountains that extend from the north west to the south east of Iran, with the maximum amount of precipitation occurring during winter (from mid-autumn to early spring); and the third region is located in the north west and north east of Iran, which experiences the maximum amount of precipitation in mid-Spring.
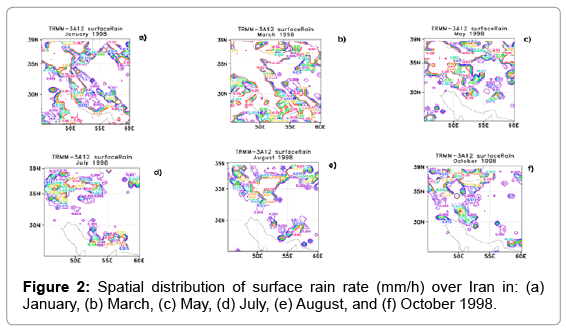
Figure 2: Spatial distribution of surface rain rate (mm/h) over Iran in: (a) January, (b) March, (c) May, (d) July, (e) August, and (f) October 1998.
The areal average amount of precipitation in Iran throughout a seven year period (1998–2005) was estimated using the ground-based observational data of APHRODITE and the satellite-based data of TRMM-3A12. These temporal data series are arranged on a monthly scale showing precipitation in mm/day in Figure 3. Compared to the outputs of APHRODITE, the precipitation amounts obtained by TRMM tend to be overestimated, particularly in the cold months of year. However, both APHRODITE and TRMM datasets show that the maximum precipitation occurred over the country during the winter months, and that the minimum occurred in summer, as was expected.
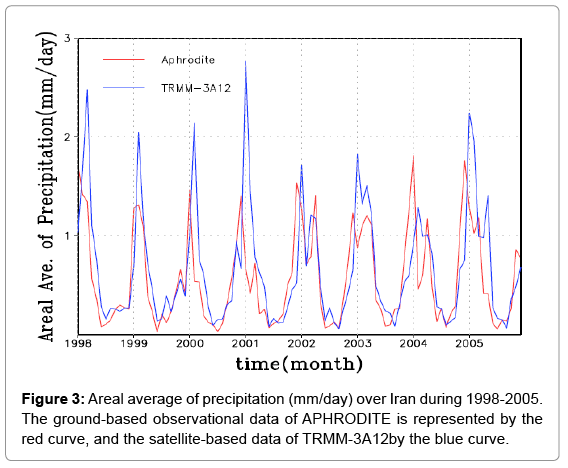
Figure 3: Areal average of precipitation (mm/day) over Iran during 1998-2005. The ground-based observational data of APHRODITE is represented by the red curve, and the satellite-based data of TRMM-3A12by the blue curve.
A comparison of the precipitation rate estimated by TRMM (satellite-based) with the ground-based data of APHRODITE shows the following in relation to the difference in the areal average of precipitation from1998 to 2005 over Iran: TRMM overestimated 51 months of data (~53% of records), underestimated 29 months of data (~30% of records), and was well correlated with APHRODITE for 16 months of data (~17% of records) (Figure 4). It is of note that the overestimated values were mainly related to the months of January and February, which are the coldest months of the year.
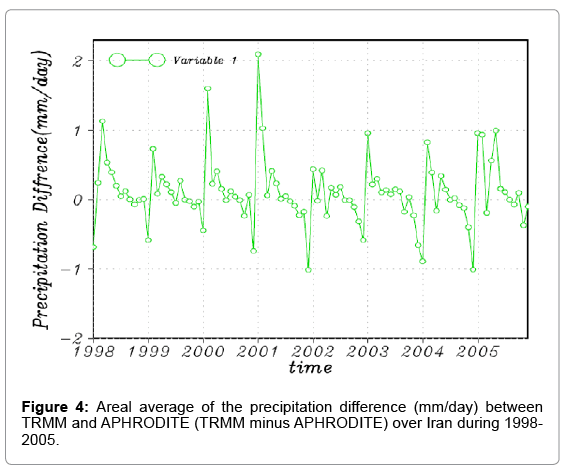
Figure 4: Areal average of the precipitation difference (mm/day) between TRMM and APHRODITE (TRMM minus APHRODITE) over Iran during 1998- 2005.
Monthly statistical comparison: In this section, we statistically compare estimates of the average monthly precipitation rates from the satellite data of TRMM-3A12 with those of APHRODITE during the period1998 to 2005, for the entire country (25°-40° N, 45°-60° E).
Firstly, we compiled annual scatter plots. From March to May, the mean correlation reached about 0.53, showing that the best correlation occurred during spring time in contrast to the other months and seasons of year in the country, and therefore the highest correlation between the TRMM and APHRODITE data series was found in April (0.57).However, January showed the lowest correlation coefficient (0.11). Furthermore, we found a positive bias for the majority of months, except for September through to December (SOND). This result indicates that TRMM overestimated the precipitation rate for months with a positive bias (Figures 5a and 5b).
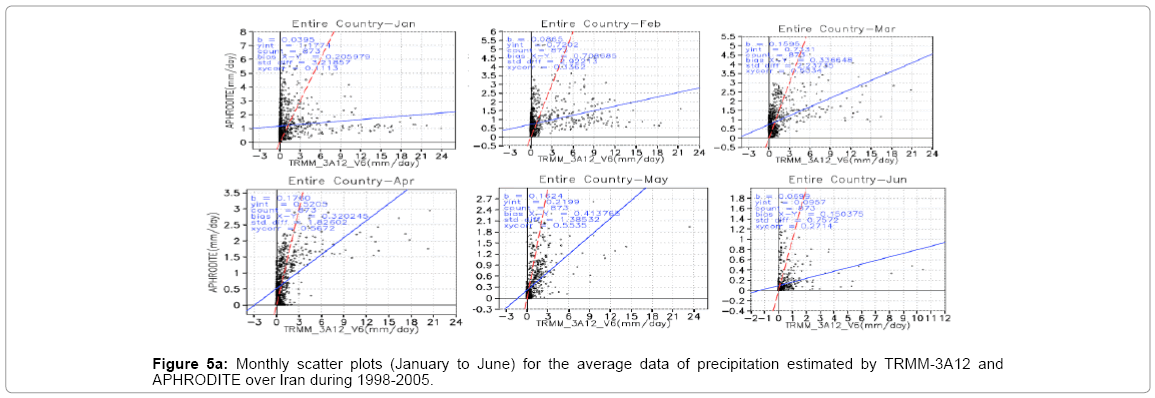
Figure 5a: Monthly scatter plots (January to June) for the average data of precipitation estimated by TRMM-3A12 and APHRODITE over Iran during 1998-2005.
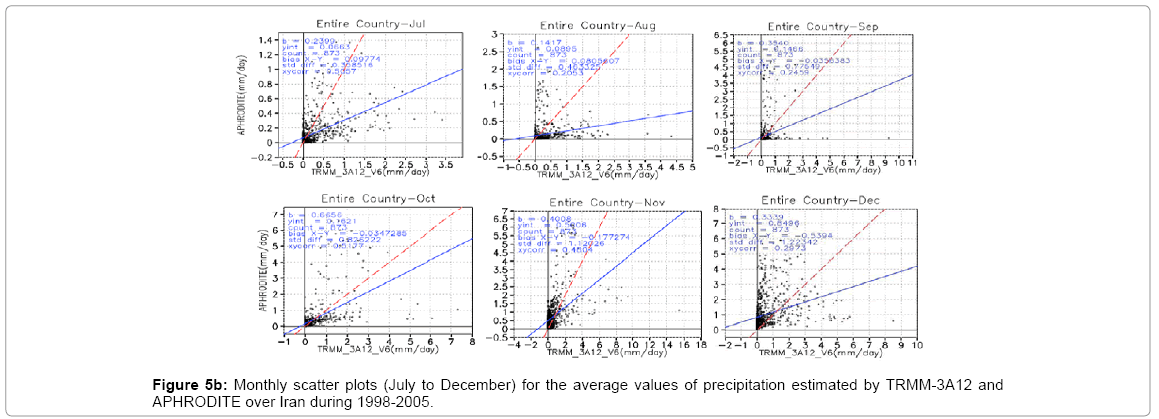
Figure 5b: Monthly scatter plots (July to December) for the average values of precipitation estimated by TRMM-3A12 and APHRODITE over Iran during 1998-2005.
Convective and strati form surface precipitation
Using the TRMM estimation, the spatial distribution of convective surface rain (mmday-1) and strati form surface rain (mm/day) were derived from January to December 1998-2005 over Iran. Two months (Jan and May) were then selected as examples of cold and warm months (Figure 6). The difference between the convective and strati form surface rain in these two months was then calculated. The analysis shows that convective and strati form rainfall contributed equally to the monthly rainfall in winter and late autumn, but in spring and summer most of the monthly rainfall was related to convective rainfall, and strati form rainfall represented only a small amount of the total surface rainfall.
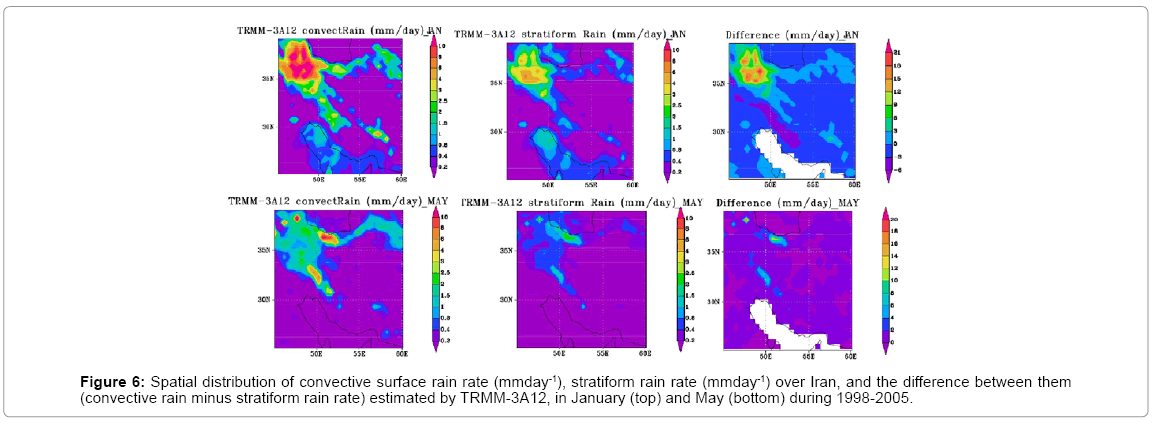
Figure 6: Spatial distribution of convective surface rain rate (mmday-1), stratiform rain rate (mmday-1) over Iran, and the difference between them (convective rain minus stratiform rain rate) estimated by TRMM-3A12, in January (top) and May (bottom) during 1998-2005.
The monthly areal averages of total surface rain, the convective rain rate, and the strati form rain rate data series over Iran, derived by TRMM-3A12 through 1998–2005, showed that there was usually a greater contribution to the precipitation amount from convective rain than from strati form rain. In addition, the differences in their contributions were more remarkable during the cold months of year, when the country received the highest amount of annual precipitation (Figure 7).
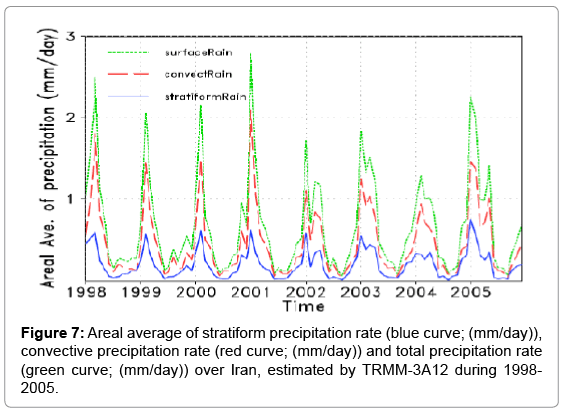
Figure 7: Areal average of stratiform precipitation rate (blue curve; (mm/day)), convective precipitation rate (red curve; (mm/day)) and total precipitation rate (green curve; (mm/day)) over Iran, estimated by TRMM-3A12 during 1998- 2005.
Precipitation water and precipitation ice
A comparison between precipitation water (gm-3) and precipitation ice (gm-3) at different atmospheric levels, including 14 atmospheric vertical levels (0–0.5, 0.5–1, 1–1.5, 1.5–2, 2–2.5, 2.5–3, 3–3.5, 3.5–4, 4–5, 5–6, 6–8, 8–10, 10–14, and 14–18 km) was performed. A number of these levels over the entire country from 1998–2005 were then selected for analysis (0.5, 0.5-1, 2-2.5, 3.5-4, 8-10, and 14-18 km), as shown in Figure 8. It was revealed that there was a greater amount of precipitation ice than precipitation water in the higher levels, and inversely the amount of precipitation water was greater than that of ice precipitation at lower levels. This is an excellent demonstration of the melting of ice at low levels. Larger amounts of precipitation ice are found in the 2-2.5 km level, and then at the 3.5-4 km level, as at higher levels the amount gradually decreases. In contrast, the amount of precipitation water is the largest at in the 0.5 km level (near the surface), followed by the level of 0.5-1 km.
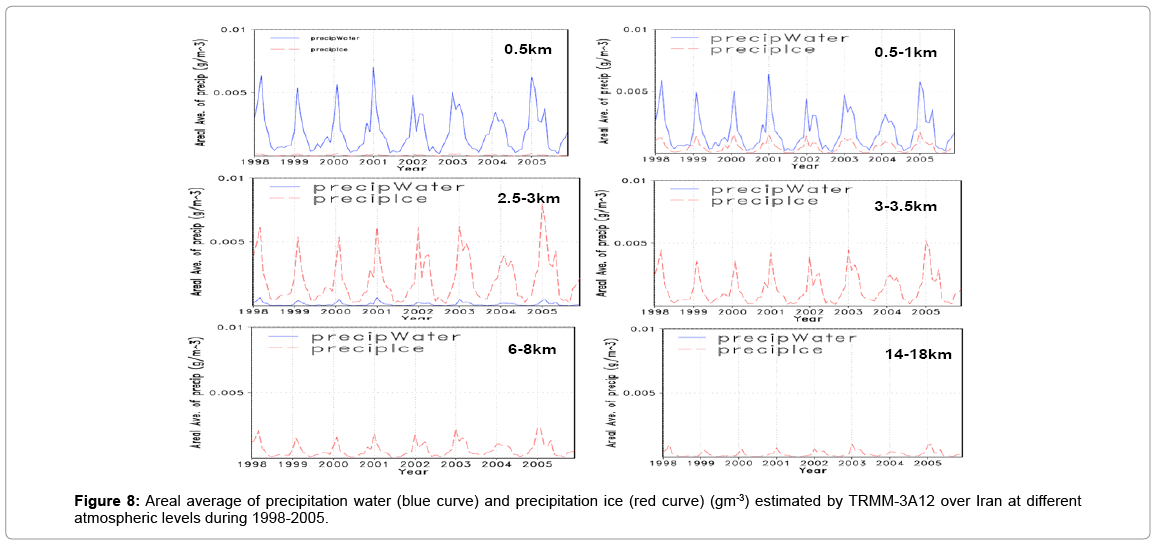
Figure 8: Areal average of precipitation water (blue curve) and precipitation ice (red curve) (gm-3) estimated by TRMM-3A12 over Iran at different atmospheric levels during 1998-2005.
The maximum amount of precipitation water (about 0.007/gm) was found in the vertical level of 0-0.5 km from the land’s surface in 2001. This was a result of high relative humidity and temperature near the surface level, in comparison with the higher levels of the atmosphere. Precipitation ice appeared at the level between0.5 and 1 km, and its peak (about 0.008/gm) was found in the vertical level of 2.5- 3 km in 2005. In levels higher than 3 km, the amount of precipitation water disappeared completely because of the falling temperature. Furthermore, precipitation ice reached its minimum amount (about 0.001/gm) at the level of 18 km (Table 1).
| Changes in Precipitation Water and ice |
Max amount of precipitation water | Appearance of precipitation ice | Max amount of precipitation ice | Disappearance of precipitation water | Min amount of precipitation ice |
|---|---|---|---|---|---|
| Atmospheric level (in km) | 0.5 | 0.5-1 | 2.5-3 | <3 | 18 |
| Areal average (gm-3) | 0.005 | 0.001 | 0.006 | 0.00 | 0.001 |
Table 1: Physical changes in precipitation water and ice estimated by TRMM-3A12 over Iran within different atmospheric levels (in km) during 1998-2005.
In relation to cloud water, the maximum amount of 0.0008/gm was found at a level of 1-1.5 km from the land’s surface. An emerging level of cloud ice was found from 2.5-3 km, while the maximum amount of cloud ice (0.0004/gm) was found at the vertical level of 6-8 km. Cloud water disappeared completely from a level of 8 km up wards, and there was a minimum amount of cloud ice (about 0.0002/gm) at a vertical level of 18 km (Table 2).
| Changes in cloud water and ice | Max amount of cloud water | Appearance of cloud ice | Max amount of cloud ice | Disappearance of cloud water | Min amount of cloud ice |
|---|---|---|---|---|---|
| Atmospheric level (in km) | 1-1.5 | 2.5-3 | 6-8 | 8< | 18 |
| Areal average (gm-3) | 0.0008 | 0.0001 | 0.0004 | 0.000 | 0.0002 |
Table 2: Physical changes in cloud water and ice over Iran, estimated by TRMM-3A12 in different atmospheric levels (measured in km) during 1998-2005.
The physical changes of relative humidity and temperature in the atmosphere are related to height, and determine the amount of cloud water and ice; temperature falls with increasing height in the atmosphere. Cloud water initially diminishes with height; cloud ice then emerges and ultimately reaches its minimum amount in the upper atmospheric levels.
Figure 9 shows the spatial distribution of precipitation water and ice over Iran at three atmospheric levels of 0.5, 1-1.5, and 3.5-4 km for the winter (DJF) during 1998-2005. The winter months were selected because the study area usually receives the most amount of its total annual precipitation at this time. At the near surface level (0-0.5 km), precipitation water was the main part of the total precipitation, particularly over the northwest of the country and the mountain chains of Zagros and Alborz. There was an almost equal amount of precipitation water and ice at the level of 1-1.5 km over these regions, and at the level of 3.5-4 km there was a small amount of precipitation water but an increase in the amount of precipitation ice over the country.
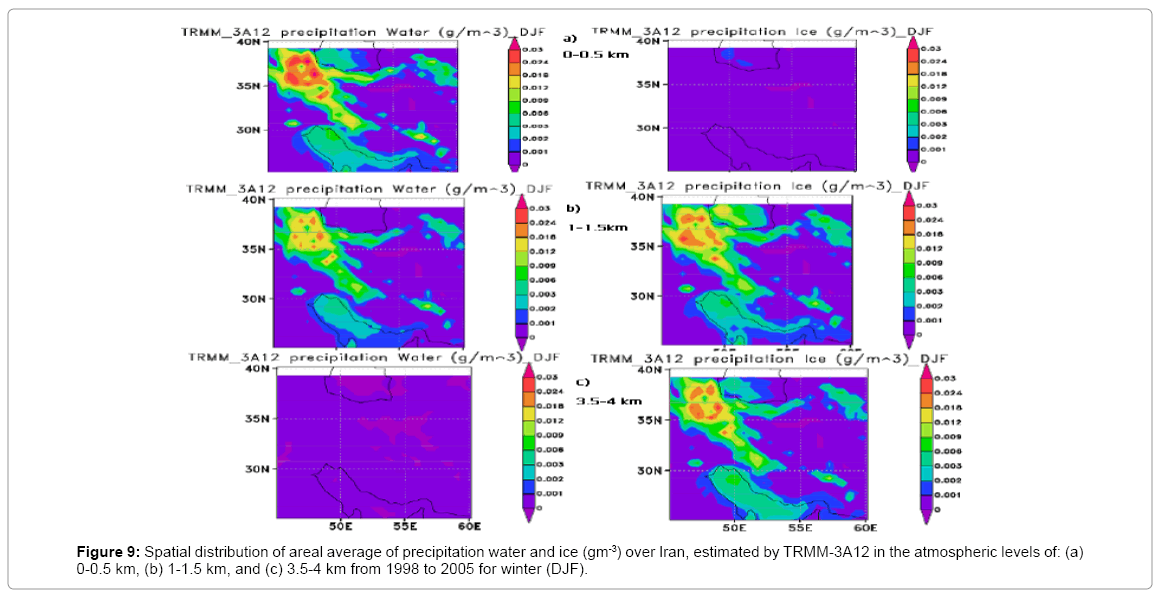
Figure 9: Spatial distribution of areal average of precipitation water and ice (gm-3) over Iran, estimated by TRMM-3A12 in the atmospheric levels of: (a) 0-0.5 km, (b) 1-1.5 km, and (c) 3.5-4 km from 1998 to 2005 for winter (DJF).
Conclusion
Accurate measurements of precipitation at varying spatial and temporal resolutions are of considerable importance, not only for weather forecasting, climate science, and meteorological studies, but also for a wide range of management issues such as hydrology, agriculture, crisis management, and industry. In addition, precipitation measurements provide important information related to the global water cycle and latent heat distribution in the atmosphere, which is considered to be one of the main sources of the atmosphere`s energy supply (75% of the energy required for atmospheric cycles is acquired from latent heat released through precipitation formation). Thus, an accurate estimation of the different forms of precipitation is necessary to enhance our knowledge concerning the earth-atmospherehydrosphere system and climatological large-scale indices.
Remote sensing technologies provide integrated monitoring systems for use in quantifying precipitation and other physical parameters of the atmosphere. Remotely sensed products with various formats and different spatial-temporal resolutions are available from various global data bases, and are easily accessible through the internet. However, use of these products essentially requires precise removal of errors, as well as the determination of different spatial-temporal resolutions. Satellite-based data series and the efficiency of satellite algorithms are essential for use in measuring different precipitation rates in different regions.
In this investigation, the estimated precipitation data series obtained from the TRMM-TMI satellite during 1998-2005 over Iran (an area of 25°N to 40°N and 45°E to 60°E), on a monthly scale and with a 0.5° spatial resolution, were evaluated against the APHRODITE gridded precipitation data series (ground-based data network). A comparison between the two types of data series showed that TRMM tends to overestimate the precipitation amount during cold months. Statistically, the highest monthly correlation between TRMM and APHRODITE precipitation data series was found in April (about 0.57), and the lowest was estimated for January (about 0.11) over the entire country.
Precipitation systems in mid-latitudes and tropical areas consist of two different types of systems, convectional and strati form, and therefore in this research we investigated the contribution of both types of systems using TRMM-3A12. A monthly comparison of the total surface rain, the convective rain rate, and the strati form rain rate data series derived by TRMM-3A12 showed that the precipitation amount is usually related to convective rain rather than strati form rain, particularly during the cold months of the year when their difference is more remarkable (in 2001 the highest difference between convective and strati form rain rates reached about 1.3 mm/day).
Furthermore, a consideration of the precipitation water and ice amounts at different atmospheric levels showed that the maximum amount of precipitation water (0.005 gm-3) and ice (0.006/gm) appeared respectively at 0.5 km and 2.5-3 km from the land’s surface. In addition, the amount of precipitation water disappeared almost completely from a level upwards of 3 km because of the lowering temperature and relative humidity in relation to the rising atmospheric height, and little precipitation ice was apparent at a level of 18 km. There are thus physical changes in the amounts of precipitation ice and water over the country in relation to the varying regions and months of the year. For example, in winter (DJF) there was an almost equal amount of precipitation ice and precipitation water over the northwestern parts of country at a level of 1-1.5 km (about 0.009 g/m3 to 0.024 g/m3).
It is considered that in future research a comparison of the cloud water and ice contents derived from TRMM-3A12 over Iran should be made, using the outputs of the International Satellite Cloud Climatology Project (ISCCP). Since 1983, the ISCCP has been collecting and analyzing satellite radiance measurements to infer the global distribution of clouds, their properties, and their diurnal, seasonal, and inter-annual variations. In the project, nine cloud types are considered, including cirrus, cirrostratus, deep convection, alto-cumulus, altostratus, nimbostratus, cumulus, stratocumulus, and stratus.
References
- Ebert EE, Janowiak JE, Kidd C (2007) Comparison of near real time precipitationestimates from satellite observations and numerical models. Bull Amer Met Soc 88: 47-64.
- Shenk WE, Holub RJ, Neff RA (1976) A multispectral cloud type identification method using Nimbus-3 MRIR measurements. Mon Wea Rev 104: 284-291.
- Reynolds DW, VonderHaar TH (1977) A bispectral method of cloud parameter determination. Mon Wea Rev 105: 446-457.
- Adler RF, Negri AJ (1988) A satellite infrared technique to estimate tropical convective and stratiform rainfall. J Appl Meteor 27: 30-51.
- Rossow WB, Schiffer RA (1991) ISCCP cloud data products. Bull Amer Meteor Soc72: 2-20.
- Alishouse JC, Snider JB, Westwater ER, Swift CT, Ruf CS, et al. (1990) Determination of cloud liquid water content using SSM/I. IEEE Trans Geosci Remote Sens 28: 817-822.
- Greenwald TJ, Stephens GL, VonderHaar TH, Jackson DL (1993) A physical retrieval of cloud liquid water over the global oceans using special sensor microwave/imager (SSM/I) observations. J Geophys Res 98: 18471-18488.
- Hong Y, Kummerow CD, Olson WS (1999) Separation of Convective and Stratiform Precipitation Using Microwave Brightness Temperature. J ApplMeteorol 38: 1195-1213.
- Zipser EJ (1977) Mesoscale and convective-scale downdrafts as distinct components of squall-line circulation. Mon Wea Rev 105: 1568-1589.
- Leary CA, Houze RA Jr (1979)Â The structure and evolution of convection in a tropical cloud cluster. J Atmos Sci 36: 437-457.
- Houze RA Jr, Rutledge SA, Biggerstaff MI, Smull BF (1989) Interpretation of Doppler weather radar displays of mid latitude mesoscale convective systems. Bull Amer Meteor Soc 70: 608-619.
- Kummerow C, Barnes W, Kozu T, Shiue J, Simpson J (1998) The Tropical rainfall measuring mission (TRMM) sensor package.J Atmos Oceanic Technol 15: 808-816.
- Turk J, Marzano FS, Mugnai A (1998) Effects of degraded sensor resolution upon passive microwave precipitation retrievals of tropical rainfall. J AtmosSci 55: 1689-1706.
- Kubota T, Shige S, Aonashi K, Okamoto K (2009) Development of non-uniform beamfilling correction method in rainfall retrievals for passive microwave radiometers over ocean using TRMM observations.J Meteorol Soc Jpn 87a: 153-164.
- Kummerow C, Simpson J, Thiele O, Barnes W, Change ATC, et al. (2000) The status of the Tropical Rainfall Measuring Mission (TRMM) after two years in orbit. J Appl Meteor 39: 1965-1982.
- Kummerow C, Giglio L (1994) A passive microwave technique for estimating the vertical structure of rainfall from space. Part I (a): Algorithm description. J Appl Meteor 33: 3-18.
- Kummerow C, Giglio L (1994)Â A passive microwave technique for estimating the vertical structure of rainfall from space. Part II (b): Applications to SSM/I Data. J Appl Meteor 33: 19-34.
- Smith EA, Mugnai A, Cooper HJ, Tripoli GJ, Xiang X (1992) Foundations for statistical physical precipitation retrieval from passive microwave satellite measurements. Part I: Brightness temperature properties of a time-dependent cloud radiation model. J Appl Meteor 31: 506-531.
- Mugnai A, Smith EA, Tripoli GJ (1993) Foundations for statistical-physical precipitation retrieval from passive microwave satellite measurements. Part II: Emission-source and generalized weighting-function properties of a time-dependent cloud-radiation model. J Appl Meteor 32: 17-39.
- Simpson JR, Adler R, North GR (1988) A proposed tropical rainfall measuring mission (TRMM). Bull Amer Meteor Soc 69: 278-295.
- Bauer P, Schanz L, Roberti L (1998) Correction of three-dimensional effects for passive microwave remote sensing of convective clouds.J ApplMeteorol 37: 1619-1632.
- Horváth A, Gentemann C (2007) Cloud-fraction-dependent bias in satellite liquid water path retrievals of shallow, non-precipitating marine clouds. Geophys Res Lett 34.
- Javanmard S, Yatagai A, Nodzu MI, BodaghJamali J, Kawamoto H (2010) Comparing high-resolution gridded precipitation data with satellite rainfall estimates of TRMM_3B42 over Iran. Adv Geosci 25: 119-125.
- KamaliGh A, Asgari A, Noohi K (2009) Applied Meteorology, Atmospheric Science and Meteorological Research Center (ASMERC), Tehran, Iran 271 (in Persian language).
Citation: Javanmard S, Bodagh Jamli J (2015) The Study of Atmospheric Physics Parameters over Iran Using Satellite TRMM-TMI Data. J Earth Sci Clim Change 6: 281. DOI: 10.4172/2157-7617.1000281
Copyright: ©2015 Javanmard S, et al. This is an open-access article distributed under the terms of the Creative Commons Attribution License, which permits unrestricted use, distribution, and reproduction in any medium, provided the original author and source are credited.
Share This Article
Recommended Journals
Open Access Journals
Article Tools
Article Usage
- Total views: 15181
- [From(publication date): 7-2015 - Apr 30, 2025]
- Breakdown by view type
- HTML page views: 10588
- PDF downloads: 4593