Total Carbon Stock of Tree Vegetation and its Relationship with Altitudinal Gradient from the Shervarayan Hills Located in India
Received: 02-Apr-2015 / Accepted Date: 24-Apr-2015 / Published Date: 30-Apr-2015 DOI: 10.4172/2157-7617.1000273
Abstract
The objective of present study was to assess the total carbon stock of tree vegetation and its relationship with altitudinal gradient from the Shervarayan hills located in India. Tree carbon stock determined by non-destructive method was 56.55 ± 12.28 t/ha. Regression analysis revealed that the quantity of carbon stock increased with altitude (R2 = 0.5703). The tree species Syzygium cumini shared maximum carbon stock followed by Anogeissus latifolia, Prumus ceylanica, Terminalia paniculata and Tamarindus indica. One way ANOVA revealed that the carbon stock among different forest types varied significantly (F(2,11) = 4.232, p<0.05), and the semi-evergreen forest had high carbon stock 77.64 t/ha. The distribution of carbon stock among different tree size classes did not vary significantly (F (10,74)=1.509, p>0.05), however, the contribution of higher tree size class (trees >330 cm girth at breast height) to total carbon stock (t/ha) was maximum (66%). The present study provides valuable data useful for modeling carbon stock potential of tree vegetation at national as well as at global level.
Keywords: Altitudinal gradient; Carbon stock; Regression; Shervarayan hills; Tree vegetation
9166Introduction
One of the recent global issues is global warming, the increase in average atmospheric temperature that negatively impacts the dynamic of global climate pattern [1]. Global warming is the consequence of human developmental activities which started during the industrial revolution period 1760 [2]. Anthropogenic activities released greenhouse gases such as carbon dioxide, nitrogen dioxide, methane, ozone, fluorocarbons, water vapour, sulphur dioxide, into the atmosphere. Among the gases, carbon dioxide is the main influencing gas for global warming. Prior to industrial revolution the concentration of atmospheric carbon dioxide was around 270 ppm, and its concentration in atmosphere is increasing rapidly [3]. The current concentration of the gas in the atmosphere is 400 ppm [4], and it is estimated that by 2070 the concentration will reach up to 500 ppm [5]. Air pollution and climate change are interlinked [6]. Scientists have predicted that by 2100 the mean global surface temperature will increase by 1-3.5°C [7]. Climate change will create additional challenges for forest management with substantial socio-economic and biological impacts [8].
The effects of global warming include, rising sea level, melting of glaciers and ice sheets, increase in temperature over land and sea surface, ocean acidification. Change in flowering and fruiting phenology of plants, shift in movement of fishes and animals [9]. In recent years, global warming and climate change even have out broken new catastrophic diseases that spread very fast worldwide [10].
Mitigation of greenhouse gases is the prime role in controlling global warming. There are lots of carbon sinks such as forests, soils, oceans that store carbon compounds for a long period. Trees are an important component of forest carbon sinks that play a vital role in global carbon cycle [1]. They fix the atmospheric carbon in the form of wood biomass [11]. During photosynthesis, trees intake the carbon dioxide gas and store it as biomass during the growth process [12].
Monitoring and management of earth’s carbon emission is most important for curbing the extra amount of carbon released. Concentration of carbon dioxide in a region depends on the carbon emission and sinking sources of that area. Quantification of carbon storage in forest systems have attracted scientist worldwide, and a lot of studies have been carried out so far [1-3,12-15].
Although, a few studies have been carried out on carbon sequestration in forest ecosystem in India, no such work has been done for Shervarayan hills, one of the major forests in Tamil Nadu, India. Hence, this study was undertaken in Shervarayan hills with three main objectives: first, to quantify the carbon storage (t/ha) of tree vegetation in the forest system; second, to find the predominant carbon storing tree species in Shervarayan hills, and finally, to address the influence of altitude on tree carbon storage.
Materials and Methods
Study area
The present study was carried out from the Shervarayan hills located in Tamil Nadu, India (Figure 1). The study area covers about 430 km2, and is composed of masses of Charnockite associated with gneiss and varied metamorphic rocks. The soil is red, loamy and lateritic. The climate data of this region reveals that the mean annual temperature is 28.3°C and the mean annual rainfall is 1058 mm [16].
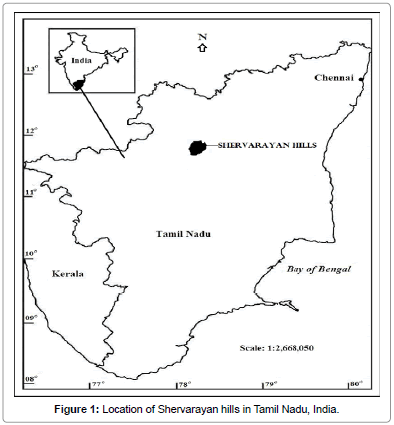
Figure 1: Location of Shervarayan hills in Tamil Nadu, India.
Methods
The entire land cover of Shervarayan hills was divided into 14 grids of size 6.25 km×6.25 km. In each grid, a transect of 0.5 ha (5 m×1000 m) was randomly laid, and all trees with ≥ 30 cm girth at breast height (GBH) were inventoried [16]. A total of 2778 trees representing 165 species were recorded. The average tree density per transect was 397 ± 42 trees/ha (± S.E.) and it ranged from 174 trees/ha to 630 trees/ha. Tree species richness per transect was 32 ± 3 species and it ranged from 15 species to 57 species per transect.
Both destructive and non-destructive sampling methods are used for quantification of vegetation carbon sinks. Destructive sampling method (which involves felling of trees) is mostly adopted for plantation forest, and non-destructive sampling method (which involves usage of allometric equations using measurable variables) is widely used for estimation of carbon stocks of natural forests. In the present study, total carbon storage of each tree was determined using non-destructive method adopted earlier [13].
Total Carbon Stock (TCS) of each tree was determined by following equation,
TCS = (AGB + BGB) × 0.5 (1)
Where ‘AGB’ is aboveground biomass, ‘BGB’ is below ground biomass, and ‘0.5’ is the conversion factor which represents that the carbon content is assumed as 50% of the total biomass as followed by Takimoto [17], Khan [18], Sundarapandian [19].
Estimation of AGB
Aboveground biomass was estimated using allometric equation following Brown [20],
Y = 34.3703 – 8.0671D + 0.6589D2 (2)
Where, ‘Y’ is AGB in kg, ‘D’ is diameter at breast height in cm.
Most of the research work revealed that AGB is strongly correlated with tree diameter [21-23]. Also, it is accepted that simple model with only diameter as input is a good estimator of above ground biomass [21,23-25]. Hence, in the present study allometric equation using tree diameter to estimate above ground biomass was used following Brown [20].
Estimation of BGB
Below ground biomass was calculated considering 15% of the aboveground biomass as followed earlier by Pragasan [13], Pragasan and Karthick [14], MacDicken [26] and Alamgir and Al-Amin [27].
BGB = AGB × (15/100) (3)
Statistical analysis
The vegetation of the 14 transects was classified into three forest types viz. semi-evergreen, mixed deciduous and scrub forests. Based on tree girth, 11 tree size (GBH) classes were recognized. Analysis of Variance (ANOVA) was performed to check the significance of variation in total carbon stock among the three forest types and among the 11 tree size (GBH) classes. Regression analysis was used to test the relationship between total carbon stock and tree density, tree diversity and altitude of forest location.
Results
Total carbon stock estimated for the 14 transects sampled from the study area was 395.83 tonnes. The mean carbon stock per transect was 56.55 ± 12.28 t/ha and it ranged from 3.03 to 158.91 t/ha. Of the total 165 species recorded from a sum of seven hectares, the tree species Syzygium cumini shared maximum carbon stock 37.44 tonnes followed by Anogeissus latifolia, Prumus ceylanica, Terminalia paniculata and Tamarindus indica (Table 1).
| Species (Family) | TCS | TCS/tree |
|---|---|---|
| Syzygium cumini (L.) Skeels (Myrtaceae) | 37.44 | 0.44 |
| Anogeissus latifolia (Roxb. ex DC.) Wall. exGuill. &Perr. (Combretaceae) | 34.40 | 0.22 |
| Prunus ceylanica (Wight) Miq. (Rosaceae) | 25.81 | 1.12 |
| Terminalia paniculata Roth (Combretaceae) | 20.04 | 0.34 |
| Tamarindus indica L. (Caesalpiniaceae) | 19.62 | 0.58 |
| Toonaciliata M.Roem. (Meliaceae) | 18.90 | 0.79 |
| Gyrocarpus asiaticus Willd. (Hernandiaceae) | 14.79 | 0.12 |
| Canthium dicoccum (Gaertn.) Teijsm. &Binn. var. dicoccum (Rubiaceae) | 14.33 | 0.09 |
| Terminalia bellirica (Gaertn.) Roxb. (Combretaceae) | 12.21 | 0.81 |
| Macaranga indica Wight (Euphorbiaceae) | 12.13 | 0.17 |
| Memecylon edule Roxb. (Melastomataceae) | 11.14 | 0.08 |
| Ficus mollis Vahl (Moraceae) | 9.69 | 0.36 |
| Ficus microcarpa L.f. (Moraceae) | 9.47 | 0.95 |
| Albizia amara (Roxb.) Boivin (Mimosaceae) | 8.08 | 0.06 |
| Alseodaphne semicarpifolia Nees var. semecarpifolia (Lauraceae) | 6.77 | 0.25 |
| Terminalia chebula Retz. (Combretaceae) | 6.45 | 0.31 |
| Commiphora caudata (Wight &Arn.) Engler (Burseraceae) | 5.93 | 0.16 |
| Pterocarpus marsupium Roxb. (Papilionaceae) | 5.78 | 0.24 |
| Bischofia javanica Blume (Bischofiaceae) | 5.67 | 0.63 |
| Elaeocarpus serratus L. (Elaeocarpaceae) | 4.99 | 0.33 |
| Premna tomentosa Roxb. (Verbenaceae) | 4.91 | 0.09 |
| Givotia rottleriformis Griff. (Euphorbiaceae) | 4.31 | 0.18 |
| Chloroxylon swietenia DC. (Flindersiaceae) | 4.19 | 0.08 |
| Vaccinium neilgherrense Wight (Vacciniaceae) | 4.11 | 0.12 |
| Dalbergia paniculata Roxb. (Papilionaceae) | 3.87 | 0.19 |
| Garuga pinnata Roxb. (Burseraceae) | 3.33 | 0.14 |
| Ficus nervosa Heyne ex Roth (Moraceae) | 2.94 | 0.73 |
| Mimusopse lengi L. (Sapotaceae) | 2.82 | 0.40 |
| Artocarpus heterophyllus Lam. (Moraceae) | 2.76 | 2.76 |
| Flacourtia indica (Burm.f.) Merr. (Flacourtiaceae) | 2.72 | 0.30 |
| Ligustrum perrottetii DC. (Oleaceae) | 2.64 | 0.05 |
| Beilschmiedia bourdilloni Brandis (Lauraceae) | 2.53 | 0.19 |
| Schleichera oleosa (Lour.) Oken (Sapindaceae) | 2.41 | 0.09 |
| Ficus benghalensis L. (Moraceae) | 2.20 | 0.44 |
| Holoptelea integrifolia (Roxb.) Planch. (Ulmaceae) | 2.17 | 0.08 |
| Buchanania lanzan Spreng. (Anacardiaceae) | 2.14 | 0.13 |
| Mitragyna parvifolia (Roxb.) Korth. (Rubiaceae) | 1.98 | 0.25 |
| Cleistanthus collinus Benth. exHook.f. (Euphorbiaceae) | 1.93 | 0.04 |
| Rapanea wightiana (Wall. ex DC.) Mez (Myrsinaceae) | 1.93 | 0.10 |
| Symplocos cochinchinensis (Lour.) Moore (Symplocaceae) | 1.91 | 0.03 |
| Ardisia solanaceaRoxb. (Myrsinaceae) | 1.88 | 0.12 |
| Celtis philippensis Blanco (Ulmaceae) | 1.83 | 0.07 |
| Diospyros montana Roxb. (Ebenaceae) | 1.78 | 0.03 |
| Albizia chinensis (Osbeck) Merr. (Mimosaceae) | 1.70 | 0.12 |
| Aglaia jainii M.V.Viswan. & K.Ramach. (Meliaceae) | 1.66 | 0.09 |
| Erythrina stricta Roxb. (Papilionaceae) | 1.65 | 0.24 |
| Scolopia crenata (Wight &Arn.) Clos (Flacourtiaceae) | 1.65 | 0.15 |
| Phyllanthus emblica L. (Euphorbiaceae) | 1.63 | 0.07 |
| Strychnos nux-vomica L. (Loganiaceae) | 1.58 | 0.40 |
| Cassine glauca (Rottb.) Kuntze (Celastraceae) | 1.51 | 0.17 |
| Remaining 115 species | 37.51 | 0.07 |
| Total | 395.83 | 0.14 |
Table 1: Total carbon stock (TCS, in tonnes) of 165 tree species recorded from the 14 transects (total 7 ha) sampled from the Shervarayan hills located in India.
The average carbon stock sequestered by individual tree was 0.14 t/ tree (Table 1), and it was found maximum for Artocarpus heterophyllus (2.76 t/tree), followed by Prunus ceylanica (1.12 t/tree), Ficus microcarpa (0.95 t/tree), Terminalia bellirica (0.81 t/tree), Toona ciliata (0.79 t/tree).
Among the three forest types recognized, semi-evergreen forest had high carbon stock 77.64 t/ha followed by mixed deciduous and scrub forest (Figure 2). ANOVA showed that carbon stock among the three forest types varied significantly (F(2,11) = 4.232, p<0.05). Among the eleven tree size classes recognized, the contribution of higher GBH class >330 cm to total carbon stock (t/ha) was maximum 66% followed by 270-300 cm class (57%), 60-90 cm class and 90-120 cm class (Figure 3). ANOVA revealed that the distribution of carbon stock among the GBH classes did not vary significantly (F(10,74)=1.509, p>0.05).
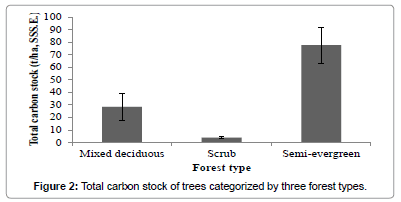
Figure 2: Total carbon stock of trees categorized by three forest types.
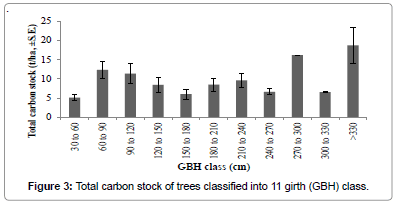
Figure 3: Total carbon stock of trees classified into 11 girth (GBH) class.
Regression analysis revealed that tree carbon stock had a strong positive relationship with altitude (Figure 4), but not with tree diversity (Figure 5) and density (Figure 6).
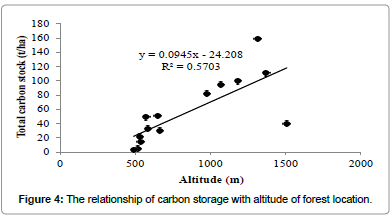
Figure 4: The relationship of carbon storage with altitude of forest location.
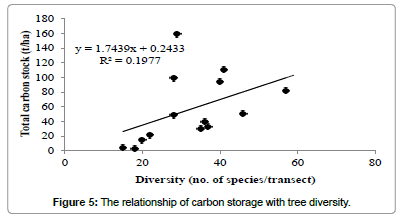
Figure 5: The relationship of carbon storage with tree diversity.
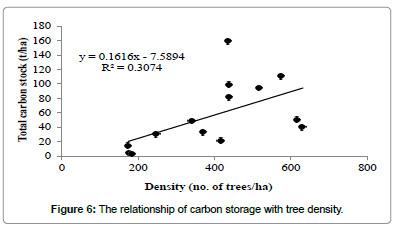
Figure 6: The relationship of carbon storage with tree density.
Discussion
Carbon stock assessments in forest vegetation have been carried out for many regions worldwide (Table 2). In the present study, the nondestructive sampling method was adopted considering biodiversity conservation in Shervarayan hills. The carbon stock of Shervarayan hills (56.55 ± 12.28 t/ha) is low when compared to other regions listed in Table 2. It is almost ten times greater than the tropical evergreen forest (5.75 t/ha) in Myanmar and five times lesser than the tropical moist evergreen forests (299 t/ha) in Sri Lanka. Also, it is almost 50% less than the average carbon stock value (118.73 t/ha) calculated for forests of a few regions listed in Table 2.
| Location | Forest type | TCS | Ref. |
|---|---|---|---|
| Shervarayan hills, India | Tropical forests | 56.55 | PS |
| Coimbatore, India | Mixed species plantation forest | 22.25 | [14] |
| Coimbatore, India | Eucalyptus plantation forest | 27.72 | [14] |
| Chitteri hills, India | Tropical forests | 58.55 | [13] |
| Kalrayan hills, India | Tropical forests | 38.88 | [1] |
| Rayapatti, India | Tropical dry evergreen forest | 42.01 | [28] |
| Bangladesh | Tropical moist forests | 48.88-118.45 | [29] |
| Arasadikuppam, India | Tropical dry evergreen forest | 51.89 | [28] |
| Kuzhanthaikuppam, India | Tropical dry evergreen forest | 51.89 | [28] |
| Maramadakki, India | Tropical dry evergreen forest | 52.36 | [28] |
| Araiyapatti, India | Tropical dry evergreen forest | 59.62 | [28] |
| Oorani, India | Tropical dry evergreen forest | 65.24 | [28] |
| Shanmuganathapuram, India | Tropical dry evergreen forest | 73.55 | [28] |
| Thirumanikkuzhi, India | Tropical dry evergreen forest | 77.12 | [28] |
| Karisakkadu, India | Tropical dry evergreen forest | 79.77 | [28] |
| Bangladesh | Tropical moist forest | 86.25-120.75 | [30] |
| Great Lakes, Northern America | Hardwood forest | 96-224 | [31] |
| Puthupet, India | Tropical dry evergreen forest | 99.53 | [28] |
| Myanmar | Tropical evergreen forests | 5.75-115.00 | [32] |
| Sri Lanka | Tropical moist evergreen forests | 109.25-299.00 | [33] |
| Great Lakes, Northern America | Red pine forest | 130-195 | [31] |
| Jamaica | Montane rain forests | 131.68-179.40 | [34] |
| Malaysia | Tropical rain forest | 132.25-166.75 | [35] |
| El Verde, Puerto Rico | Lower Montane forests | 134.21 | [36] |
| Xishuangbanna, China | Tropical seasonal rain forest | 138.73 | [37] |
| Khade, Ghana | Tropical rain forests | 152.84 | [38] |
| New Guinea | Tropical rain forests | 164.45 | [39] |
| Khado Chang, Thailand | Tropical rain forests | 167.10 | [40] |
| Cambodia | Tropical rain forests | 200.10-238.63 | [41] |
| Western Ghats, India | Tropical rain forests | 263.47 | [42] |
| New Guinea | Montane rain forests | 290.38 | [43] |
Ref.-Reference; PS-Present study.
Table 2: Total carbon stock (TCS, t/ha) of tree vegetation of some of the forests around the world.
In this study, the carbon capture by individual tree was found maximum for Artocarpus heterophyllus (2.76 t/tree) which is greater than the maximum value recorded for Mangifera india (1.73 t/tree) for Chitteri reserve forest [13]. The order of carbon stock for the three forest types justified as semi-evergreen>mixed deciduous>scrub for the present study is similar to that of Chitteri reserve forest [13]. A strong positive relationship was observed between the tree carbon stock and altitude of forest location at Shervarayan hills, while no such relation was observed for the Chitteri reserve forest [13]. The present study concludes that the carbon stock of tree vegetation in Shervarayan hills is low and it increases with altitude of forest location.
Like most of the hill forests in India, Shervarayan is also threatened from the impacts of anthropogenic activities such as forest land encroachment for agriculture, modification of forest cover for construction of roads, rock and sand mines, illegal felling of timber trees, besides the influence of invasive weed species Lantana camara. Hence, proper management of the hill forest is highly recommended. Further, tree plantation programs in degraded forest lands, and awareness programs to educate the local people are of necessary activities to help conserve forests and stock maximum atmospheric carbon in the tree vegetation.
In conclusion, the present study reveals the importance of quantification of carbon stock of forest vegetation, for better management of the forest ecosystem in view of reducing the excess atmospheric carbon dioxide gas, and thereby to help mitigation of global warming and climate change. Monitoring of forest carbon stock is necessary to address the future problems. Further, development of new innovative methodology is of immense need for quantification of carbon stock with great accuracy.
Acknowledgements
I sincerely thank Dr. N. Parthasarathy, Professor of Ecology and Environmental Sciences, Pondicherry University, Puducherry, for all his support and encouragements.
References
- Pragasan LA (2015) Assessment of tree carbon stock in the Kalrayan hills of the Eastern Ghats, India. Walailak J Sci Tech12 (in press).
- Malhi Y, Baldocchi DD, Jarvis PG (1999) The carbon balance of tropical, temperate and boreal forests. Plant Cell Environ 22: 712-740.
- Sheikh MA, Kumar S, Kumar M (2012) Above and below ground organic carbon stocks in a sub-tropical Pinusroxburghii Sargent forest of the Garhwal Himalayas. Forest Stud China 14: 205-209.
- Jackson M, Ford-Lloyd B, Parry M (2014) Plant genetic resources and climate change. CAB International, UK.
- Bytnerowicz A, Omasa K, Paoletti E (2007) Integrated effects of air pollution and climate change on forests: A northern hemisphere perspective. Environ Pollut 147: 438-445.
- IPCC (1996) Climate change 1995 impacts, adaptations and mitigation of climate: Scientific-technical analyses. In: Contribution of II to the second assessment report of the Intergovernmental Panel on Climate Change. Cambridge University Press, UK.
- Sicard P, Dalstein-Richier L (2015) Health and vitality assessment of two common pine species in the context of climate change in Southern Europe. Environ Res 137: 235-245.
- Karthick A, Pragasan LA (2014) Stand structure and above-ground biomass of two tree plantations at Bharathiar University, Coimbatore. Indian Forester 140: 29-33.
- David N, Crane DE (2002) Carbon storage and sequestration by urban trees in the USA. Environ Pollut 116: 381-389.
- Pragasan LA (2014) Carbon stock assessment in the vegetation of the Chitteri Reserve Forest of the Eastern Ghats in India based on non-destructive method using tree inventory data. J Earth SciClim Change S11: 001.
- Pragasan LA, Karthick A (2013) Carbon stock sequestered by tree plantations in university campus at Coimbatore, India. Int J Environ Sci 3: 1700-1710.
- Fares S, Vargas R, Detto M, Goldstein AH, Karlik J, et al. (2013) Tropospheric ozone reduces carbon assimilation in trees: estimates from analysis of continuous flux measurements. Global Change Biol 19: 2427-2443.
- Pragasan LA, Parthasarathy N (2010) Landscape-level tree diversity assessment in tropical forests of southern Eastern Ghats, India. Flora 205: 728-737.
- Takimoto A, Nair PKR, Nair VD (2008) Carbon stock and sequestration potential of traditional and improved agroforestry systems in the West African Sahel. Agricult, Ecosyst Environ 125: 159-166.
- Khan AB (2013) Assessment of carbon storage in Pondicherry mangroves, Pondicherry, India. ActaBiologicaMalaysiana 2: 95-99.
- Sundarapandian SM, Amritha S, Gowsalya L, Kayathri P, Thamizharasi M, et al. (2013) Estimation of biomass and carbon stock of woody plants in different land-uses. Forest Res 3: 115.
- Brown S, Gillespie AJR, Lugo AE (1989) Biomass estimation methods for tropical forests with applications to forest inventory data. Forest Sci 35: 881-902.
- Brown S (1997) Estimating biomass and biomass change of tropical forests: a primer. Rome, Italy: FAO Forestry Paper 134.
- Brown S, Lugo AE (1984) Biomass of tropical forests: a new estimate based on forest volumes. Sci 223: 1290-1293.
- Clark DA, Brown S, Kicklighter DW, Chambers JQ, Thomlinson JR, etal. (2001) Net primary production in tropical forests: an evaluation and synthesis of existing field data. EcolAppl 11: 371-384.
- Nelson BW, Mequita R, Pereira JLG, de Souza SGA, Batista GT, et al. (1999) Assessing tree and stand biomass: a review with examples and critical comparisons. Forest Sci 45: 573-593.
- Djomoa AN, Ibrahimab A, Saborowskic J, Gravenhorsta J (2010) Allometric equations for biomass estimations in Cameroon and pan moist tropical equations including biomass data from Africa. Forest Ecol Manage 260: 1873-1885.
- MacDicken KG (1997) A guide to monitoring carbon storage in forestry and agro forestry projects USA. WinrockIntInstAgricultDevelop 19-99.
- Alamgir M, Al-Amin M (2008) Allometric models to estimate biomass organic carbon stock in forest vegetation. J Forestry Res 19: 101-106.
- Mani S, Parthasarathy N (2007) Above-ground biomass estimation in ten tropical dry evergreen forest sites of peninsular India. Biomass Bioenerg 31: 284-290.
- Drigo R, Shaheduzzaman Md, Chowdhury JA (1998) Inventory of forest resources of south Sylhet forest division. Assistance to the forestry section â?? phase ii. FAO/UNDP project BGD/85/085, field document no.3, Rome, Italy.
- MildedeR, Shaheduzzaman Md, Drigo R (1985) The high forest in Chittagong district. Volumes 1 and 2, FAO/UNDP Project BGD/79/017, field document no.3, Rome, Italy.
- Powers M, Kolka R, Palik B, McDonald R, Jurgensen M (2011) Long-term management impacts on carbon storage in Lake States forests. Forest Ecol Manage 262: 424-431.
- FAO (1984-85) Forest department of Burma. National forest survey and inventory of Burma. FO:BUR/79/001, working papers nos.5,7-12, Forest department of Burma, Rangoon.
- FAO/UNDP (1969) Pre-investment study on forest industries development. Ceylon, Final Report, vol. II. Forest resources and management. FAO/SF:60/CEY-5, Rome, Italy.
- Turner J, Gessel SP, Lambert MJ (1999) Sustainable management of native and exotic plantations in Australia. New Forests 18: 17-32.
- Whitmore TC (1975) Tropical rain forests of the Far East. Clarendon Press, Oxford, and Oxford University Press, London.
- Jordan CF (1981) Productivity of tropical forest and its relation to a energy storage. J Ecol 59: 127-142.
- Shanmughavel P, Zheng Z, Liqiing S, Min C (2001) Floristic structure and biomass distribution of a tropical seasonal rain forest in Xishuangbanna, southwest China. Biomass Bioenerg 21: 165-175.
- Greenland GJ, Gowel JML (1970) Nutrient content of the moist tropical forests of Guana. Plant Sci 12: 154-174.
- Enright NJ (1979) Litter production and nutrient partitioning in rain forests near Bulolo, Papua New Guinea. Malaysian Forester 42: 202-220.
- Kira T, Ogawa H, Yoda K, Ogina K (1974) Primary production by a tropical rain forest of southern Thailand. Botanical Magazine 77: 425-429.
- Hozumi K, Yoda K, Kira T (1979) Production ecology of tropical rain forests in south western Cambodia. II. Photosynthetic function in an evergreen seasonal forest. Nature Life in Southeast Asia 6: 57-81.
- Rai SN (1984) Above ground biomass in tropical rain forests of Western Ghats, India. Indian Forester 8: 754-764.
- Edwards PJ, Grubb PJ (1977) Studies of mineral cycling in a Montane Rain forest in New Guinea, I-Distribution of organic matter in the vegetation and soil. J E col 65: 1943-1969.
Citation: Pragasan LA (2015) Total Carbon Stock of Tree Vegetation and its Relationship with Altitudinal Gradient from the Shervarayan Hills Located in India. J Earth Sci Clim Change 6: 273. DOI: 10.4172/2157-7617.1000273
Copyright: ©2015 Pragasan LA. This is an open-access article distributed under the terms of the Creative Commons Attribution License, which permits unrestricted use, distribution, and reproduction in any medium, provided the original author and source are credited.
Select your language of interest to view the total content in your interested language
Share This Article
Recommended Journals
Open Access Journals
Article Tools
Article Usage
- Total views: 16745
- [From(publication date): 4-2015 - Sep 04, 2025]
- Breakdown by view type
- HTML page views: 11942
- PDF downloads: 4803