Towards a Post-carbon Future: Benchmarking of 10 European Case Study Cities
Received: 31-May-2016 / Accepted Date: 31-Aug-2016 / Published Date: 06-Sep-2016
Abstract
Considering the urgency of global climate change and other environmental, social and economic pressures, it is presumed that a new system is needed–the post-carbon city. Through their adaptive capacity, post-carbon cities use the threat of climate change as an opportunity to reduce vulnerability as they restructure humanecological and human-human relationships toward ecosystem health and a clean energy economy.
This article intends to analyse this transition process towards a post-carbon city model in 10 European case study cities (Barcelona, Copenhagen, Malmö, Istanbul, Lisbon, Litoměřice, Milan, Turin, Rostock and Zagreb) based on a set of environmental, economic and social Key Performance Indicators (KPI).
Through the analysis of the KPI, namely reference indicators such as energy efficiency and GHG emissions indicators, it is possible to identify groups of cities with different stages of development in the transition towards a post-carbon city, namely: Group 1 (Copenhagen, Malmö and Rostock), Group 2 (Milan, Turin and Barcelona), Group 3 (Istanbul and Zagreb) and Group 4 (Lisbon and Litomerice).
Copenhagen and Malmö are at the forefront of this sustainable trajectory. These cities have clear strategic visions in the area of urban sustainability, and are implementing several projects on mobility, energy and climate with positive impacts.
This work has been developed under the framework of the POCACITO–“Post-carbon Cities of Tomorrow” project, supported by FP7 of the European Commission (EC).
Keywords: Sustainability; Clean energy; Key Performance Indicators (KPI); Post-carbon; Global climate
18954Introduction
Cities are complex, adaptive, social-ecological systems [1-5] “characterised by a particular human settlement pattern that associates with its functional or administrative region, a critical mass and density of people, man-made structures and activities” [6].
A significant proportion of global greenhouse gas emission and world’s resources massive consumption are attributed to urban areas, with figures ranging from 31 to 80% of global emissions [7,8] and 75% consumption of the world’s resources. It is therefore of pivotal importance that cities, while being the centre of economic and social activities, become crucial players of promoting carbon reduction and sustainable development strategies worldwide.
Since the World Commission on Environment and Development (the “Brundtland Commission”) sought to address the problem of conflicts between environment and development goals by formulating a definition of sustainable development in 1987–“development which meets the needs of the present without compromising the ability of future generations to meet their own needs”, many attempts have been made to narrow down the concept to make it applicable to different contexts or to reconcile the three classical pillars–environment, society, and economy.
Mainly based on undertake a convincing attempt for framing urban sustainable development [9-11]. They define a diagram for sustainable urban development, which is made up of six blocks.
The social perspective includes urban social inequalities, low income, poverty, crime and social exclusion, which can lead to socially deprived problem areas in urban centres or suburbs. In sequence, the economic development integrates not only the economy, but also municipal finance in order to ensure provision of essential city services as well as social support activities. The environmental aspects are two-fold: on the one hand, cities are the largest contributors of GHG emissions; on the other hand, cities and their citizens suffer from climate instability, floods, heat waves or hurricanes. The fourth component refers to the viewpoint of access to utilities and infrastructure, which determines, among others, the degree to which a city can become active in transition processes towards sustainable development since a city has more influence on utilities if they belong to the city or if the municipality is at least a shareholder. Moreover, the connections derived from urban form and spatial developments have consequences for all the pillars of sustainable development and are therefore crucial in the urban context. Ultimately, the inclusion of multi-level governance and institutional development pillar refers to the fact that a city is part of a larger system, e.g., the political system of the nation state.
When ecological, social, or economic structures make the existing cities unsustainable, it may be necessary to fundamentally change the nature of the system–to transform it. Considering the urgency of global climate change and other environmental, social and economic pressures, it is presumed that the current urban system is close to crossing several thresholds of sustainability and that a new system – the post-carbon city – is necessary to prevent the movement into an undesirable state from which it is difficult, if not impossible, to recover.
The concept of ‘post-carbon cities’ signifies a rupture in the carbondependent urban system, which has led to high levels of anthropogenic greenhouse gases, and the establishment of new types of cities that are low-carbon as well as environmentally, socially and economically sustainable [12]. The term post-carbon emphasizes the process of transformation, a shift in paradigm, which is necessary to respond to the multiple challenges of climate change, ecosystem degradation, social equity and economic pressures. Through their adaptive capacity, post-carbon cities use the threat of climate change “as an opportunity to reduce vulnerability as they restructure human-ecological and human-human relationships toward ecosystem health and a clean energy economy [5,13,14].
In this context, a transition process can be defined as “a gradual, continuous process of change where the structural character of a society (or a complex sub-system of society) transforms (…) [15]. Consequently, transitions are “complex and long-term processes comprising multiple actors” [16].
Transitions with regard to sustainability have three characteristics that distinguish them from other transitions [16]. First, sustainability transitions are goal-oriented. However, since the goal is a collective good, there are hardly any incentives for private actors to engage in sustainability transitions. Sustainable solutions usually do not offer obvious user benefits. Therefore, economic framework conditions need to be changed so that innovations can replace existing systems. This requires changes in policies beforehand to address politics and power struggles, which are likely to emerge since vested interests will probably try to resist these changes. The third characteristic is based on the assumption that it is not incumbent firms, but pioneers who develop innovations and thus help start or implement transitions. Moreover, incumbent firms will probably stick to the old regime. Therefore, innovation and innovative businesses are seen as a driver of transition.
The transition of cities to become more sustainable through the three pillars – environment, society and economy – requires dramatic improvements in energy and water-use efficiency; alternative transportation modes such as walking, bicycling, and mass transit; investments in green infrastructure; waste minimisation (reduced packaging and increased use of composting, waste-to-energy, and recycling); promotion of regional food systems; sustainable housing; as well as other measures in governance or education structures. Along with environmental concerns, policies and planning must also confront key socio-economic issues, such as aging populations, migration, health, poverty and exclusion of the urban poor.
The knowledge of constituent elements, actors and interactions within a city system, will enable an active steering of the system’s transition towards a post-carbon cities model.
This article intends to analyze the transition process of 10 European cities-Barcelona, Copenhagen, Malmö, Istanbul, Lisbon, Litom??ice, Milan, Turin, Rostock and Zagreb towards a post-carbon model, based on a set of environmental, economic and social Key Performance Indicators (KPI). The identification of groups of cities with different stages of development in the achievement of a sustainable future is also an objective of the research, taking in account the diverse territorial specificities.
This work has been developed under the framework of the POCACITO–“Post-carbon Cities of Tomorrow–Foresight for sustainable pathways towards livable, affordable and prospering cities in a world context” project, supported by FP7 of the European Commission (EC). This initiative aims to produce a 2050 roadmap to support the transition of cities to a more sustainable or post-carbon future, through a collaborative research and participatory scenario building. An important step to achieve project’s goal is the production of an integrated assessment of case study cities in order to evaluate and make a comparison of their current situation as an input into the scenario development.
The novelty of this approach is related to the extensive empirical work developed by the selected cities in collaboration with well-known European research organisations, under a bottom-up approach. Moreover, different city profiles are identified based on their transition process towards a post-carbon future.
The article is divided in the following parts, besides the introduction: Conceptual and methodological framework, overview of the case study cities, case study cities performance, findings and key challenges, and conclusions.
Conceptual And Methodological Framework
Conceptual model
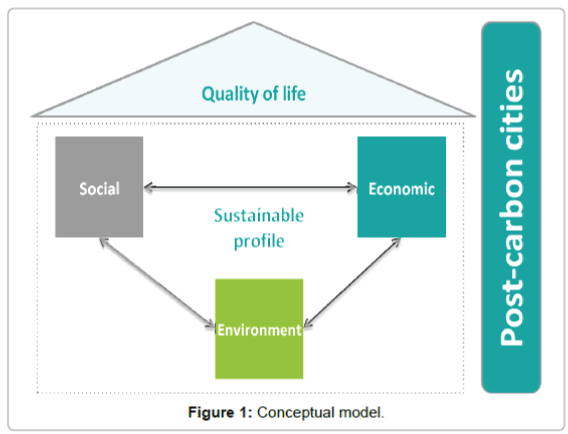
The conceptual model was conceived to have the quality of life as the main driver since every step towards a post-carbon city has to guarantee the welfare of both inhabitants and future generations.
To achieve this objective, a theoretical model was developed based on the concepts of ‘urban sustainability’ and ‘post-carbon cities’ comprising the environmental, social and economic dimensions. Instead of analysing these three components as silos, a comprehensive and holistic approach that assesses the relationships among factors and feedback loops of the entire system was adopted. A systems thinking approach was used in order to analyse the dynamics of urban systems and to identify key features of post-carbon city transitions (Figure 1).
Dimensions and sub-dimensions
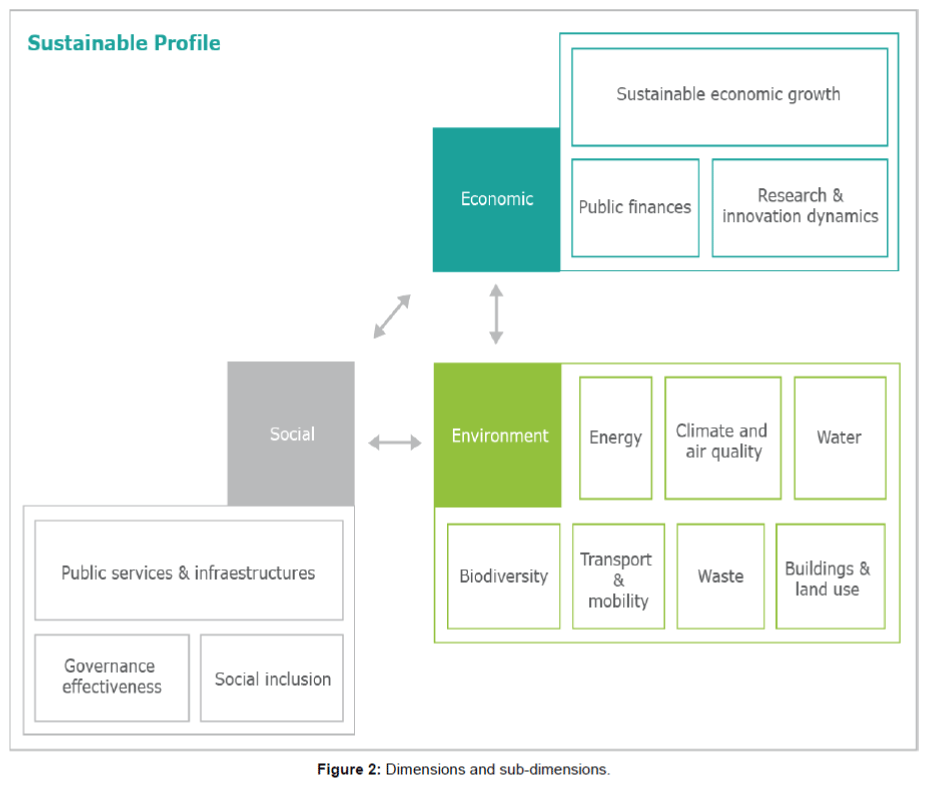
The environment dimension investigates the sustainable profile of the cities and assesses not only the current impacts on the environment, but also during the transition processes, evaluating the environmental resilience of the cities. It is important to continuously adapt the strategies to follow in order to mitigate the negative impacts on the environment during the transition process. The environmental dimension covers the energy sector in general in order to promote not only the final energy efficiency but also the resources depletion associated with energy consumption. Post-carbon cities pay special attention to GHG emission and its contribution to climate change. Some energy intensive sectors are emphasised, such as transportation/ mobility and the buildings stock. Biodiversity and air quality are critical themes that are integrated in this dimension. The concerns regarding waste and water are also evaluated.
The economic dimension emphasises the sustainable economic growth based on the wealth of the cities and their inhabitants. It recognises that investments are crucial to promoting post-carbon cities, in particular the ones related to sustainable facilities. The labour market and the life of the companies are taken into account to demonstrate the dynamics of a post-carbon economy in a green economy paradigm. Public finances are also analysed because the cities with a lower level of indebtedness are more prepared to face the challenges during the transition process towards a post-carbon city. This dimension also includes the R&D expenditure because no city can become a postcarbon city without innovation.
The social dimension is concerned about equity both in the current generation and between generations during the transition process to post-carbon cities, which is expected to be smooth for all citizens. The benefits for inhabitants that come out of living in a reduced carbon city are highlighted, showing that these cities are places where it is pleasant to live in and the values of equity and social inclusion are present. Special attention has been given to standards of living related to essential aspects such as education and health (for example, life expectancy and wellbeing). Unemployment rates and poverty are also issues addressed in the context of post-carbon cities. Public services and infrastructures that are available for citizens are analysed, as well as aspects of governance and civic society, promoting the positive sense of culture and community (Figure 2).
For each dimension and sub-dimension, a set of indicators has been selected which allows a uniform collection of data, improves the comparison and supports the identification of good practices.
Key Performance Indicators (KPI) selection
The Key Performance Indicators aim to evaluate the performance of cities during the transition process towards a post-carbon city. Through the literature review carried out, it was possible to produce an innovative mix of indicators.
The initial phase of the KPI design and development process was supported by an in-depth analysis of several existing index systems related to the three dimensions (social, economic and environmental), as observed on the following (Tables 1 and 2):
| Topic | Document Title | Main features |
|---|---|---|
| Carbon Index | [17] | It measures the current capacity of each country to be competitive and to generate material prosperity for its residents in a low carbon world, based upon each country’s current policies and indicators. |
| [18] | Based on the OECD Green Growth strategy, it monitors how the Benelux region is performing in the transition towards the pursuit of green economic growth and development, while preventing costly environmental degradation, climate change, biodiversity loss, and unsustainable natural resource use. | |
| Sustainability Index | [19] | It undertakes a city environmental diagnosis and performance benchmark on the most critical issues (pressures on energy and water resources, waste management, sewer systems, and transport networks, among others) of the urban environmental sustainability. |
| Columbia University, Joint Research Centre European Commission, World Economic Forum (2005), Environmental Sustainability Index, Benchmarking National Environmental Stewardship Yale University | It is a composite index tracking a diverse set of socioeconomic, environmental, and institutional indicators that characterize and influence environmental sustainability at the national scale, out-coming trend analysis and performance targets. | |
| [20] | It is a quantifying and numerically ranking of how countries perform on high-priority environmental issues in two broad policy areas: Environmental health, which measures environmental stresses to human health, and ecosystem vitality, which measures ecosystem health and natural resource management. | |
| [21] | It assesses the country’s progress in sustainability, enabling the connection with the main levels of strategic decision–policies, plans and programs–national, regional and sectoral level, based on the OECD framework model Pressure-State-Response (PSR). | |
| Smart Cities and Social Index | Selada et al. (2012), Smart Cities Index | A composite indicator ranking resultant of the simple average of 5 dimensions’ scores to strategically position cities in terms of urban intelligence. A database of municipal information and knowledge to support the decision-making process of public authorities and economic and social actors was also developed. |
| Department for Communities and Local Government (2011), The English Indices of Deprivation 2010 | A national statistical release to identify national and sub-national patterns of multiple deprivation, made up of several distinct dimensions or domains. | |
| Europe 2020 Strategy | Taking stock of the Europe 2020 strategy for smart, sustainable and inclusive growth, 2010 | European Union’s ten year growth and jobs strategy composed by a set of EU headline targets that cover the following priorities: employment, research and development, climate/energy, education, social inclusion and poverty reduction. |
Table 1: Main features of the index systems consulted.
| Dimension | Sub-Dimension | Indicator | Unit |
|---|---|---|---|
| Social | Social Inclusion | Unemployment level | Percentage |
| Poverty level | Percentage | ||
| Tertiary education level | Percentage | ||
| Average life expectancy | Nº | ||
| Public services and Infrastructures | Green space availability | Percentage | |
| Governance effectiveness | Existence of monitoring system for emissions reductions | Yes/No Description |
|
| Environment | Biodiversity | Ecosystem protected areas | Percentage |
| Energy | Energy intensity | Toe/euro | |
| Energy consumption by sectors | Percentage | ||
| Climate and Air Quality | Carbon emissions intensity | Ton CO2/euro | |
| Carbon emissions by sectors | Percentage | ||
| Exceedance rate of air quality limit values | Nº | ||
| Transport and mobility | Share of sustainable transportation | Percentage | |
| Waste | Urban waste generation | Kg/person/year | |
| Urban waste recovery | Percentage | ||
| Water | Water losses | m3/person/year | |
| Buildings and Land Use | Energy-efficient buildings | Percentage | |
| Urban building density | Nº/ km2 | ||
| Economy | Sustainable economic growth | Wealth per capita | Eur/person |
| GDP by sectors | Percentage | ||
| Employment by sectors | Percentage | ||
| Business survival | Percentage | ||
| Public Finances | Budget deficit | Percentage of city’s GDP | |
| Indebtedness level | Percentage of city’s GDP | ||
| Research & Innovation dynamics | R&D intensity | Percentage |
Table 2: List of Key Performance Indicators (KPI).
In general, the indexes consulted include a long list of indicators that was not possible to manage in the scope of POCACITO project. Moreover, these indexes are essentially based on specific perspectives and objectives. Indeed, some of the indexes include environmental, social and economic indicators, but not in the perspective of POCACITO targets, and not on an integrated approach for assessing the social, environmental and economic resilience of citizens and city’s economy to face the transition process towards post-carbon cities. Moreover the cities should have a deep role in the transition process and consequently the capacity to influence all indicators.
Additionally, a set of screening criteria-clear message, relevance, data availability and data quality–(described on the box below) was established for the Key Performance Indicators selection through an interactive process comprising discussions with stakeholders, as most relationships are not straightforward and dynamic in nature.
Relevance
• Is the indicator linked to the definition of an innovative postcarbon city?
• Is the city able to influence the indicator on its own? (i.e., is the city level the right level?)
• Is the indicator relevant for small cities as well as for megacities, does it respect the diversity of case study cities?
• Are there indicators included that enable to measure development/ transition scenarios impacts?
Clear message
• Is the message of the indicator clear?
• Is the meaning of the indicator substantial?
• Is the name and the data of the indicator easy understandable?
• Is the direction of the indicator clear?
Data availability
• Is the data available at the city level?
• Is the data already collected?
• What is the location/source of the data?
• Is there free access?
• For how long has the data been collected? (Years)
• How often is the data collected? (Year)
• Are the city officials able to provide us with the data?
Data quality
• Reliability
How consistent is the data?
• Validity
Does it measure what it is intended to measure?
• Completeness
Is the database complete or is data missing?
• Comparability e.g., is the data standardised?
• Transparency e.g., is it possible for other people to verify the data?
• Uncertainty
How does the indicator deal with uncertainty?
Data collection
In order to quantify the KPI in each case study city, the selected methods for data gathering and collection have comprised the following approaches:
• Top-down approach – Completion of the indicators list according to a review of main statistical findings, existing relevant strategic and planning documents, and legislation to assure an accurate quantitative data collection;
• Bottom-up approach – Discussions with local authorities and other selected stakeholders to complement the collection of quantitative data and enrich the contents of the case study analysis.
In general, most of the required data can be retrieved by national/ regional statistical offices, government departments, environment and energy agencies, research institutes and non-governmental organisations. The data collection process depends on the availability of high quality and relevant data.
Moreover, all the indicators should be collected for both years 2003 and 2012 in order to compare their evolution throughout this period (sometimes, mainly for some economic and social indicators, time series were required). Whenever data are not available for those years, one should collect the earliest and the most recent years between 2003 and 2012.
The geographical boundaries of the assessment should be defined according to the limitations of data availability. All indicators should be collected for one geographical level, being privileged the municipality level. If an indicator is not available at this geographical level, then it could be collected for NUT III or NUT II. If the data are only available at the national level, it is considered that it is not representative of the city, so it should be discarded.
Data collection limitations were centred in the following issues:
- Some data were collected for different time periods due to unavailability of data;
- Some data were collected for different geographical scales due to unavailability of data;
- Different data sources used for different years, which can cause comparison problems;
- Absence of data for the quantification of some indicators.
Because of the referred limitations, the integration of data was difficult. However, all the methodological problems are indicated in the analysis.
Overview Of The Case Study Cities
Selection of case study cities
The POCACITO project has analysed a set of case study cities in order to enhance mutual learning and the open-ended exchange of knowledge on issues of common concern in order to improve coordination and decision making, both within and among cities [22-26].
Aligned with the project objectives, the selection of case studies was then developed according to a matrix crossing the following criteria:
- Economic, social and ecological flows under the following themes: Water, waste, energy, transport, food, green infrastructure and adaptation to climate change;
- Territorial (cross border, mountain areas, inland, central and coastal regions) and geographical (Northern, Southern, East and Central Europe, and Nordic Countries) location according to the ESPON regional typology database 2013.
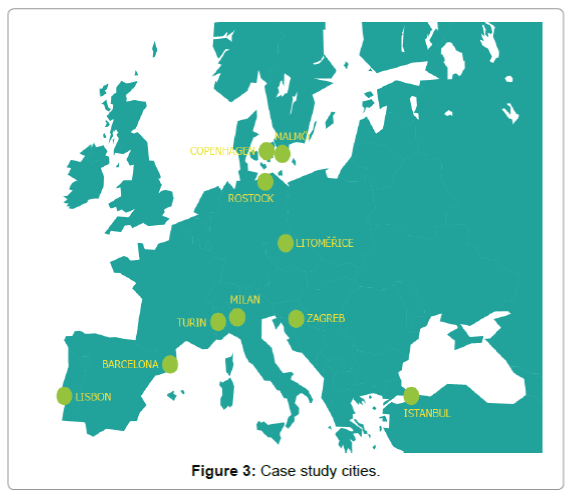
Thus, for analysing the transition process towards a post-carbon future, 10 case study cities were selected, namely: Barcelona, Spain; Copenhagen, Denmark; Malmö, Sweden; Istanbul, Turkey; Lisbon, Portugal; Litom??ice, Check Republic; Milan and Turin, Italy; Rostock, Germany; and Zagreb, Croatia, as displayed on Figure 3.
The characteristics of the case study cities differ widely according to size, density, wealth, climate as well as governance and economic structures. Although this complicates the standardisation of the case study activities within the project, it also strengthens the project’s ability to transfer lessons learned and best practices to a wider range of EU and global cities.
Case study cities’ profile
A short analysis of the case study cities basic indicators and geopolitical elements (Tables 3 and 4) reveal some important features of the territories.
| Case Study Cities | Area (km2) Municipality, 2013* |
Density (inhab/km2) Municipality, 2013* |
Population Municipality, 2013* |
|---|---|---|---|
| Barcelona | 101,40 | 15.779,09 | 1.600.000,00 |
| Copenhagen | 89,00 | 6.285,84 | 559.440,00 |
| Istanbul | 5.196,82 | 2.666,0 | 13.854.720,00 |
| Lisbon | 100,05 | 5.474,59 | 547.733,00 |
| Litomerice | 17,99 | 1.341,63 | 24.136,00 |
| Malmö | 332,64 | 940,94 | 312.994,00 |
| Milan | 182,00 | 7.275,65 | 1.324.169,00 |
| Turin | 130,00 | 6.939,52 | 902.137,00 |
| Rostock | 181,00 | 1.125,27 | 203.673,00 |
| Zagreb | 641,00 | 1.236,93 | 792.875,00 |
Note: Zagreb and Lisbon-2011; Istanbul-2012.
Table 3: Case study cities statistical figures.
| Case Study Cities | Geopolitical Elements |
|---|---|
| Barcelona | 2nd largest city in Spain, capital of Catalonia 2nd economic centre in Spain, after Madrid Relevant port city Important cultural centre in Europe Touristic destination |
| Copenhagen | Capital city (Denmark) Located by the coast of Oresund, it is situated on the island of Zealand and the small island of Amager in the south western part of Denmark Oresund bridge connects Copenhagen to Malmö Important harbour area |
| Istanbul | Capital city (Turkey), mega city Strategic location: Istanbul extends over 2 continents–Asia and Europe; 4thPan European Corridor ends in Istanbul Two important ports Cultural, economic and demographic dynamics |
| Lisbon | Capital city and the largest city in Portugal Westernmost city in Europe, along the Atlantic coast Coastal city and touristic destination Strategic location: Relation with Latin America, Africa and Asia, allowing access to 750 million consumers from Europe and Portuguese-speaking countries |
| Litom??ice | Small city Northern part of Czech Republic 60 km North of the capital Prague |
| Malmö | 3rdlargest city in Sweden Southwest coast of Sweden Direct connection to Denmark via the Öresund bridge |
| Milan | 2ndlargest city in Italy, after Rome Administrative centre of the Lombardy region Northern part of Italy, midway between Po river and the foothills of the Alps Main industrial and commercial city in Italy Artistic and cultural centre |
| Turin | 4thlargest city in Italy Administrative centre of the Piedmont region Western part of the Po river, at the foothills of the Alps 3rdarea in Italy in terms of GDP |
| Rostock | Medium-sized city North-east of Germany by the Baltic sea Geographical region Northern Lowland Can be accessed by highway from Hamburg and Berlin in around 2 hours |
| Zagreb | Capital city and the largest city in Croatia Northwest of the country, along the Sava river Excellent traffic connection between Central Europe and Adriatic Sea |
Table 4: Geopolitical elements.
Istanbul has the biggest territorial area, followed by Zagreb and Malmö. The smallest municipalities are Lisbon, Copenhagen and Litomerice. However, Barcelona is the municipality with higher urban density, followed by Milan and Turin. Less dense municipalities are Rostock and Malmö.
The number of inhabitants of the case study cities is very diverse: from around 14 million inhabitants of Istanbul to 24,000 of Litom??ice. It is worth of notice that Istanbul is a mega city, ranking 8 out of 78 OECD metropolitan regions in terms of population size and first for population growth since the mid-1990.
Case Study Cities Performance
Environmental performance
Environmental performance of case study cities will be analysed based on selected KPI.
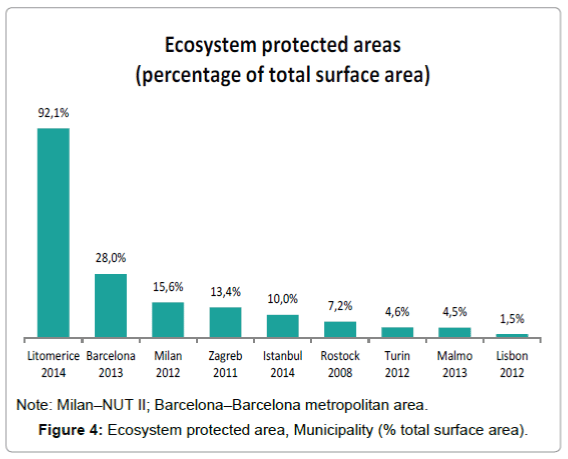
Ecosystem protected areas: Litomerice reports 92.1% of ecosystem protected areas as a percentage of total surface area, followed by Barcelona (28%) (Figure 4).
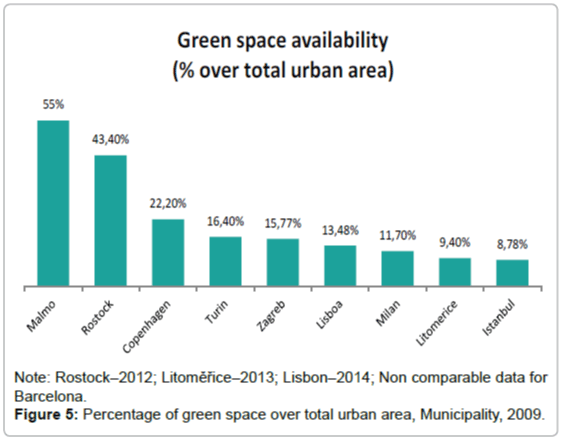
Green space availability: Malmö and Rostock present a high percentage of green space over total urban area, compared with the other case study cities (Figure 5).
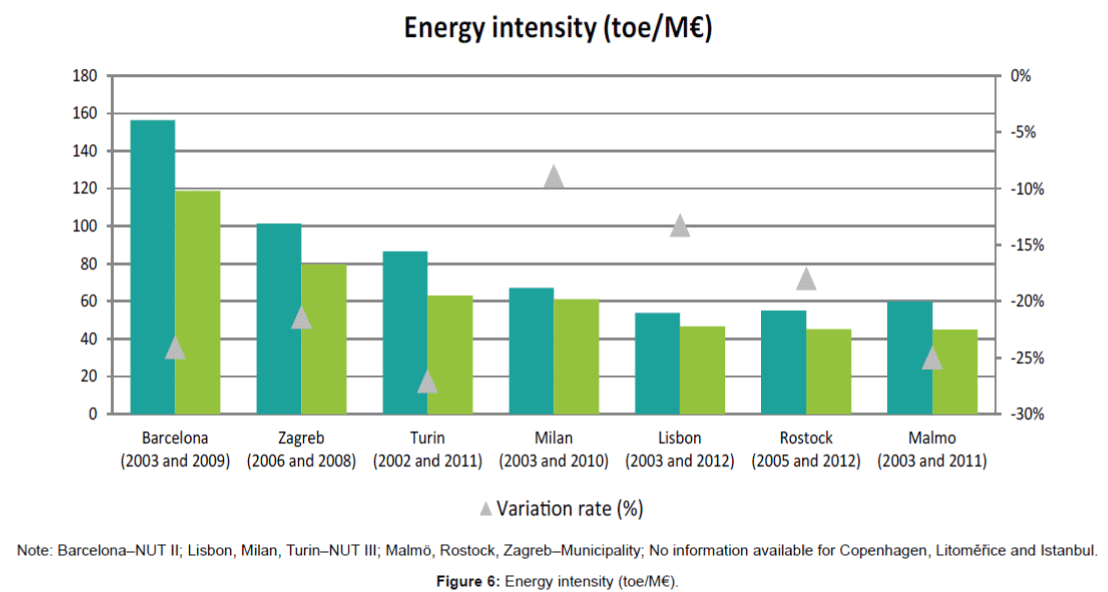
Energy intensity: Energy intensity is represented by the ratio of gross energy consumption by GDP. Cities with more energy intensity per GDP consume more energy to produce the same amount of goods. It is a proxy of energy efficiency.
Energy intensity is higher in Barcelona, followed by Zagreb and Turin. The general decrease in energy intensity is a trend in all case study cities (Figure 6).
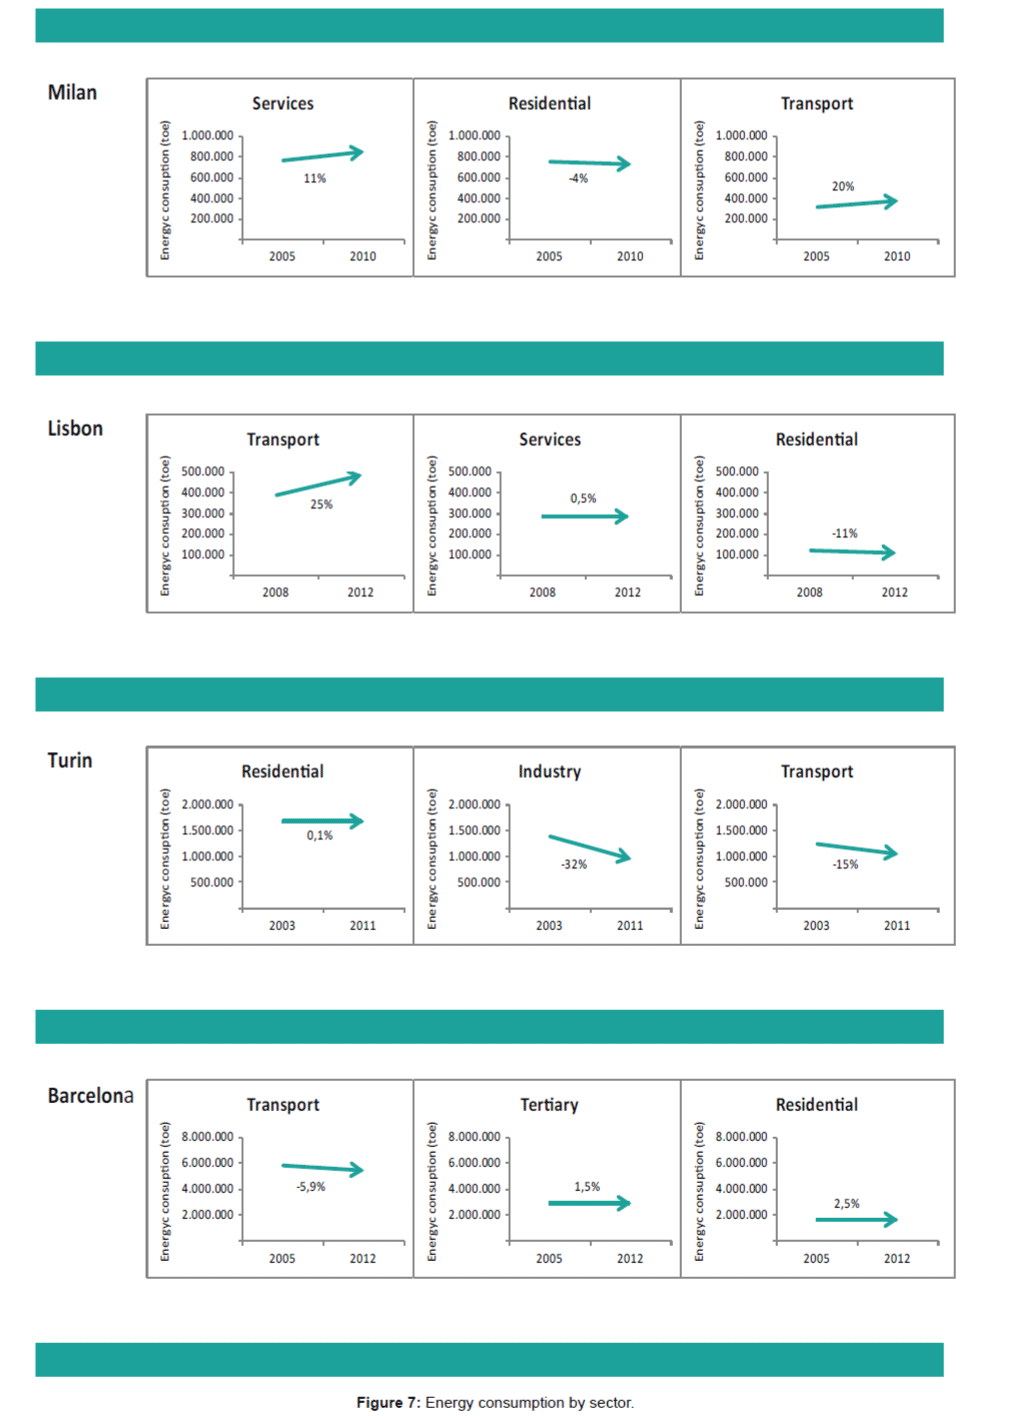
Energy consumption by sector: This indicator measures the sum of primary energy consumption in industry, agriculture, services, transports, residential and others, and allows us to identify the sectors that are more energy intensive and therefore need more action towards being more efficient.
As observed in the graphics below, the higher energy consumers are Milan and Barcelona. However, the profile of case study cities in terms of energy consumption by sectors is very diverse. In Milan, services present higher energy consumption in comparison with the other sectors. In Lisbon and Barcelona the higher energy consumer is the transport sector. In Turin and Malmö the residential sector dominates (Figure 7).
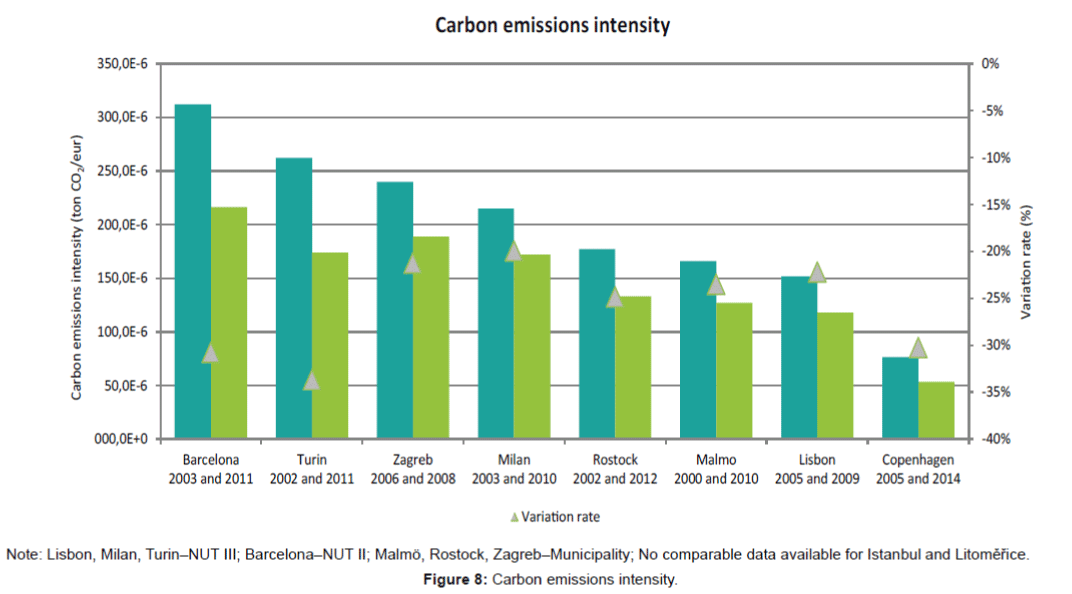
Carbon emissions intensity: This indicator assesses the carbon emissions due to energy consumption. It is the ratio between CO2 emissions and GDP. The carbon emissions intensity of the economy identifies the cities where more CO2 are emitted to produce wealth.
Carbon emissions intensity is higher in Barcelona, being Copenhagen the best performer. The general decrease in carbon emission intensity is a trend in all case study cities (Figure 8).
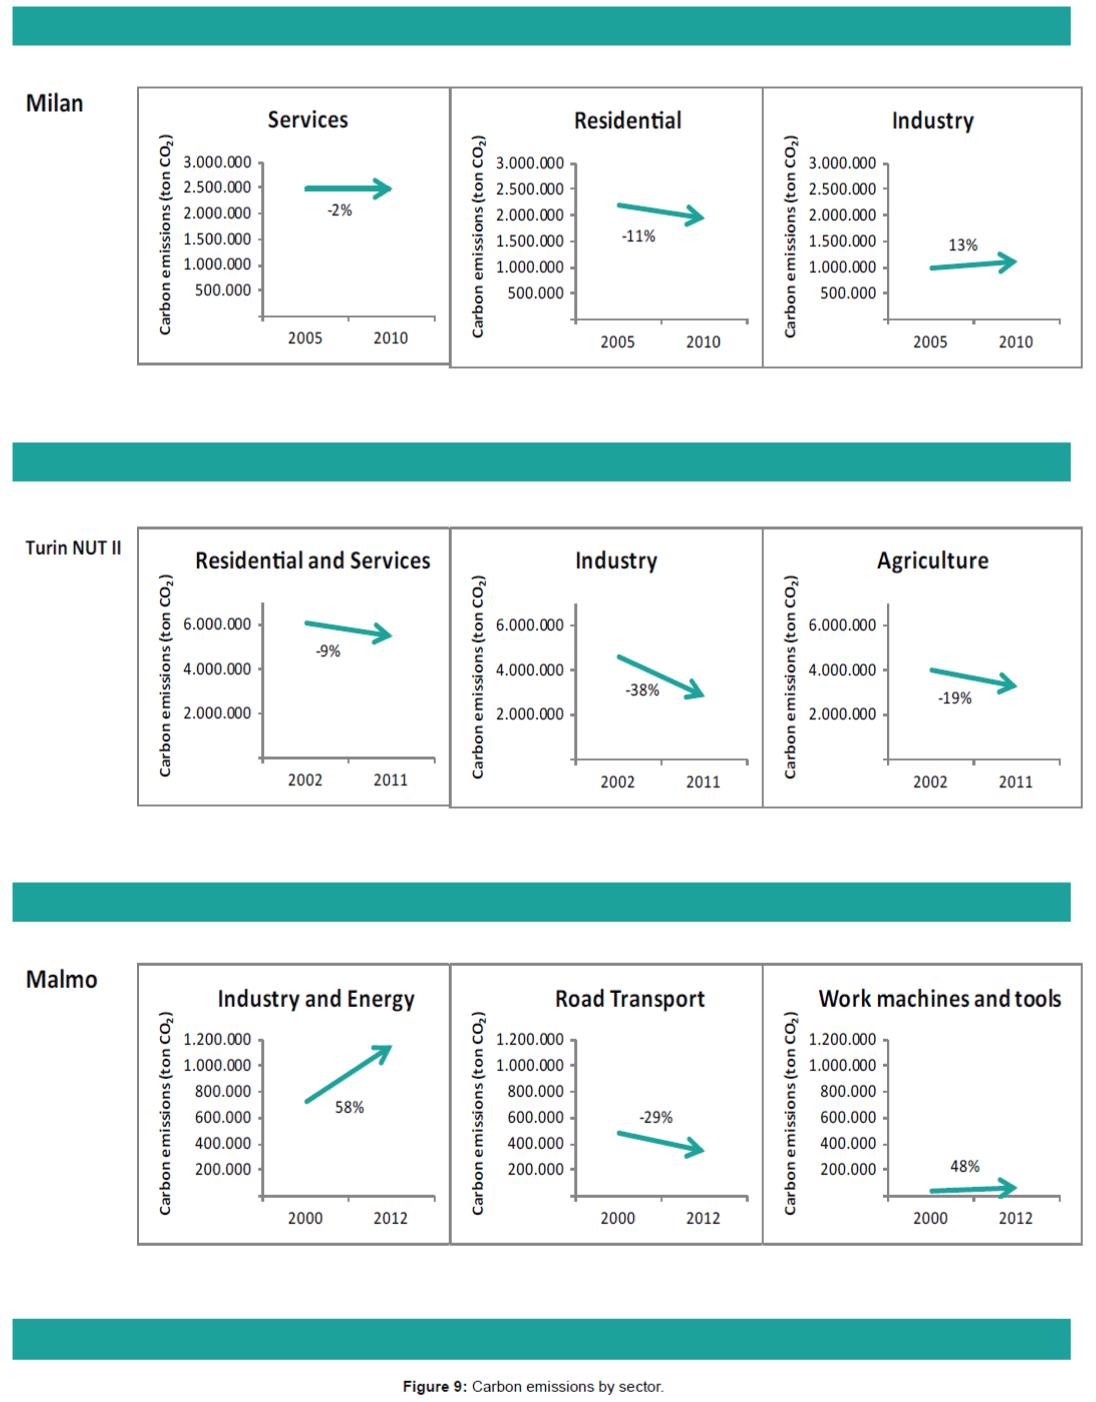
Carbon emissions by sector: This indicator assesses the measurement of CO2 emissions per sector: industry, agriculture, services, transports, residential, and others.
Turin leads the case study cities group in terms of carbon emissions intensity by sector. However, the cities profile in terms of carbon emissions by sectors is very diverse. In Milan and Turin, services and residential sectors present higher carbon emissions in comparison with the other sectors. In Malmö, industry and energy sectors are the higher producers of carbon emissions (Figure 9).
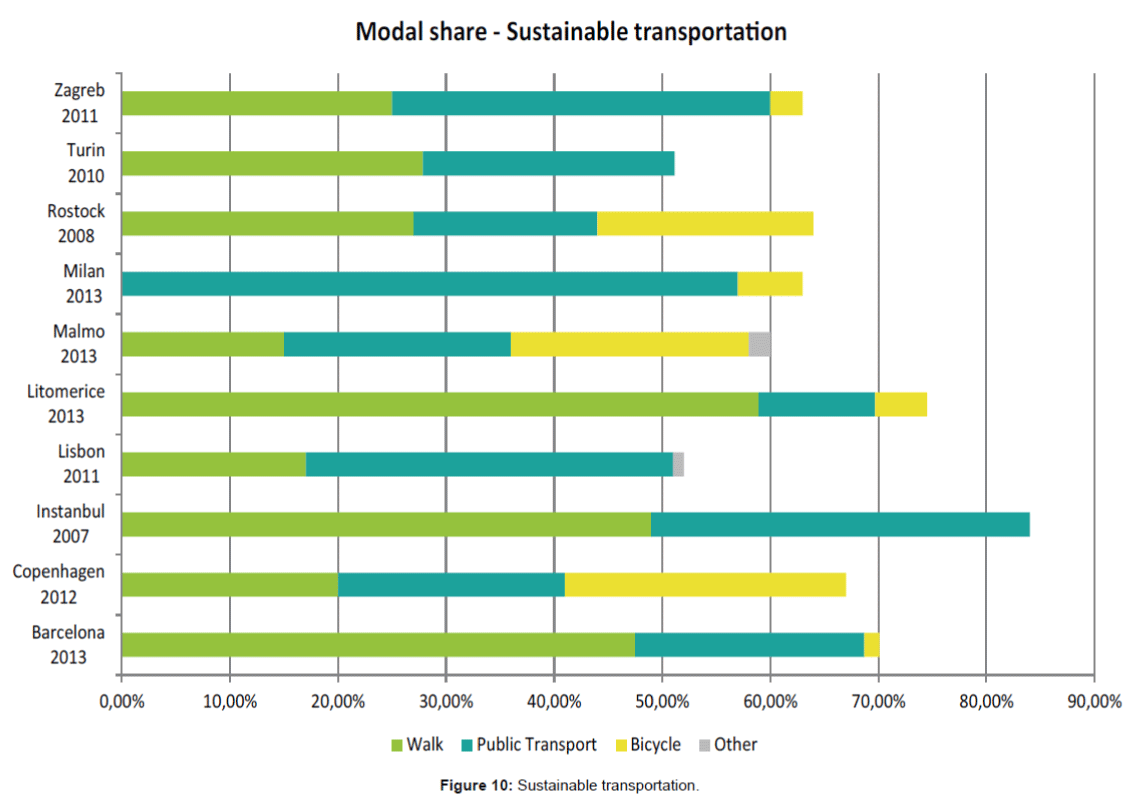
Transports and mobility: The share of sustainable transportation (public transports, walk, and bike) in total modal share is higher in Istanbul, followed by Litomerice, Barcelona and Copenhagen. Copenhagen, Malmö and Rostock residents use intensively bicycle as an alternative transportation mode. It is worth of notice that Copenhagen wants to become the best cycling city in the world (Figure 10).
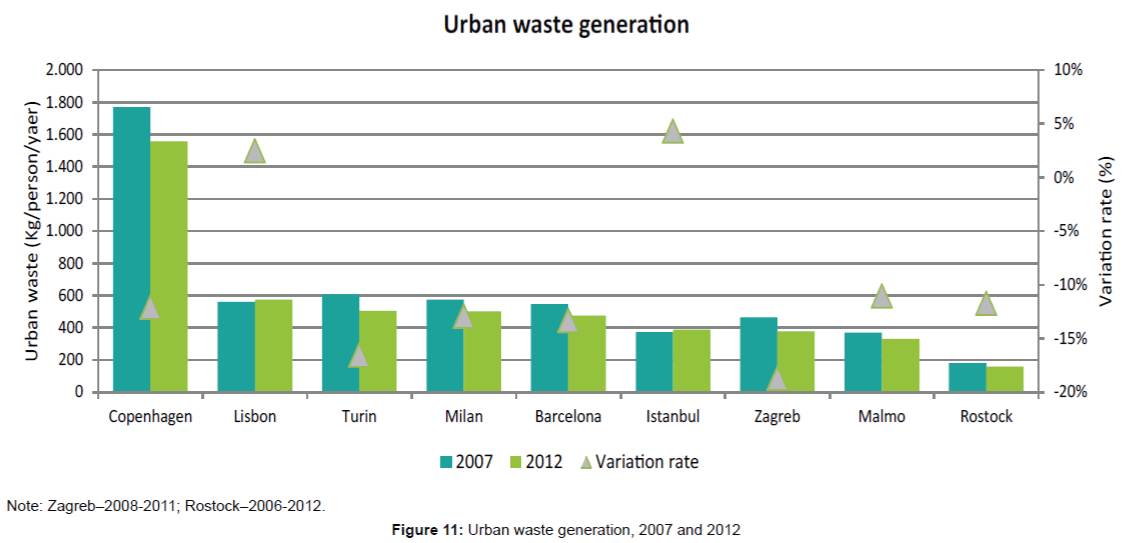
Urban waste: Urban waste production is calculated by the total amount of city urban solid waste generated per capita in kilogram.
Urban waste production was higher in Copenhagen, Turin and Milan in 2007. In 2011, Copenhagen and Lisbon reported the highest urban waste generation. However, the decrease in the amount of this indicator is the general trend, with exception of Lisbon and Istanbul (Figure 11).
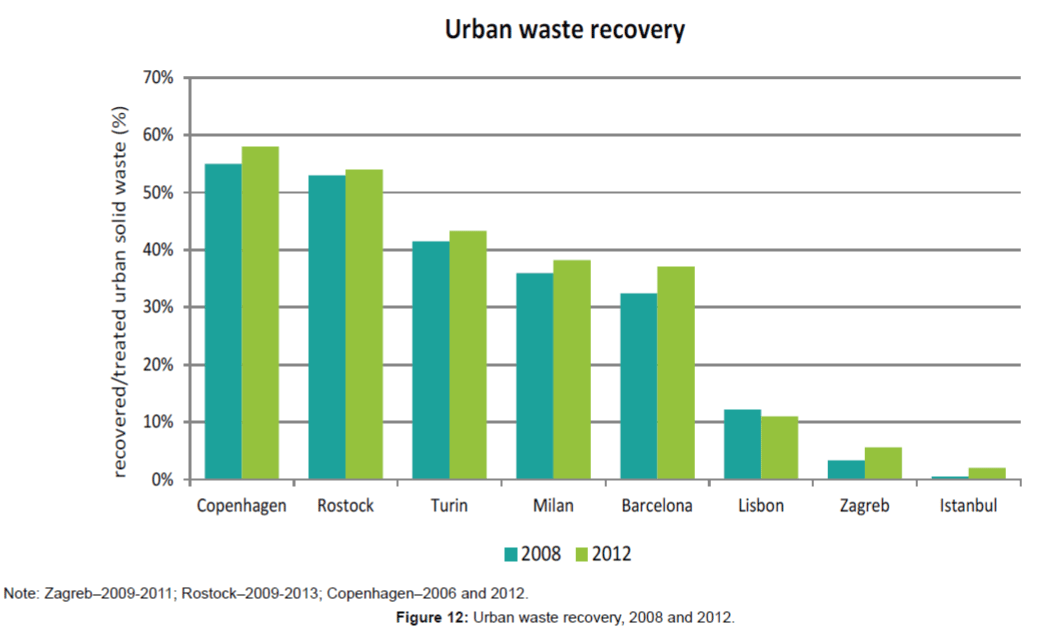
Urban waste recovery corresponds to the percentage of recovered/ treated waste. The information on waste recovering/treatment system is broken down into five categories of final destination: material recycling; total incineration, including energy recovery; deposit onto or into land; composting; and digestion.
This indicator is higher in Copenhagen, Rostock, Turin, Milan and Barcelona, being Lisbon, Zagreb and Istanbul the worst performers. The trend is towards the increase of urban waste recovery, with the exception of Lisbon (Figure 12).
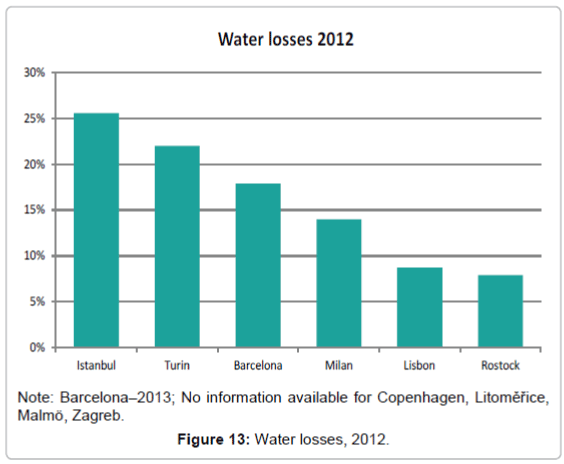
Water losses: This indicator determines the percentage of water losses registered in public supply networks.
Water losses are bigger in Istanbul and Turin, being Lisbon and Rostock the best performers (Figure 13).
Social Performance
Social performance of case study cities will be analysed based on selected KPI.
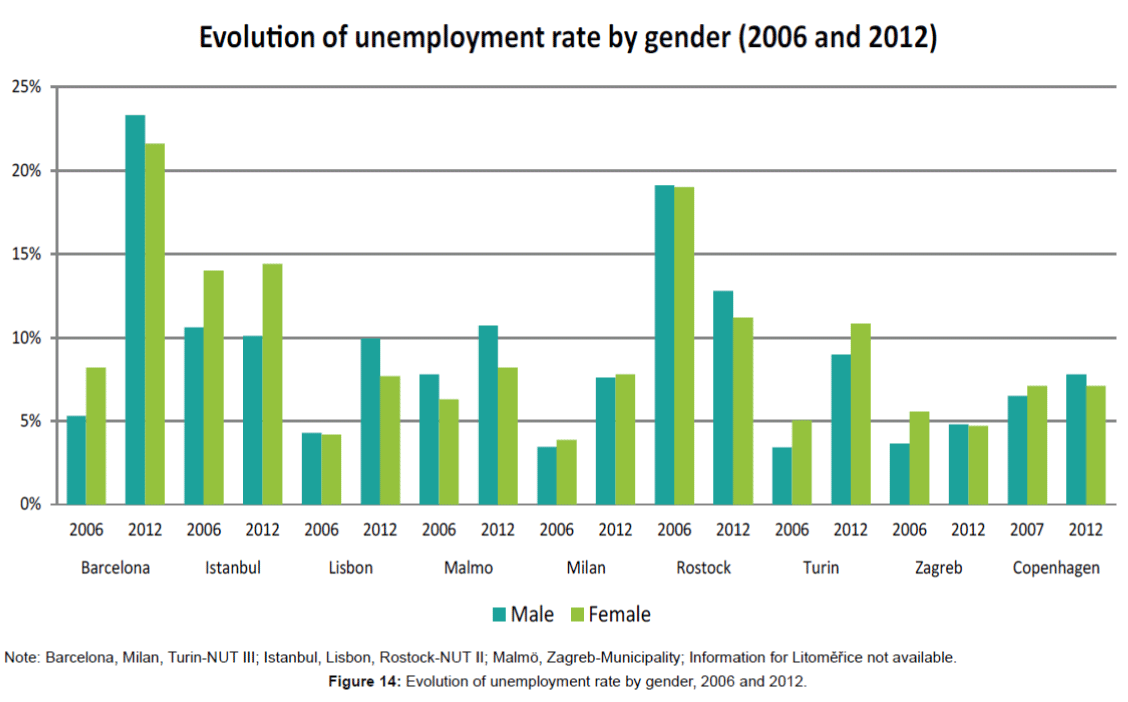
Unemployment level: In general, from 2006 to 2012 unemployment rate has increased mostly because of the adverse effects of the economic and financial crisis. Higher rates are reported in Barcelona. In this period, in Barcelona the variation of male’s unemployment rate was +239% and the variation of women unemployment rate was +158%. Exceptions are Istanbul, Rostock and Zagreb (Figure 14).
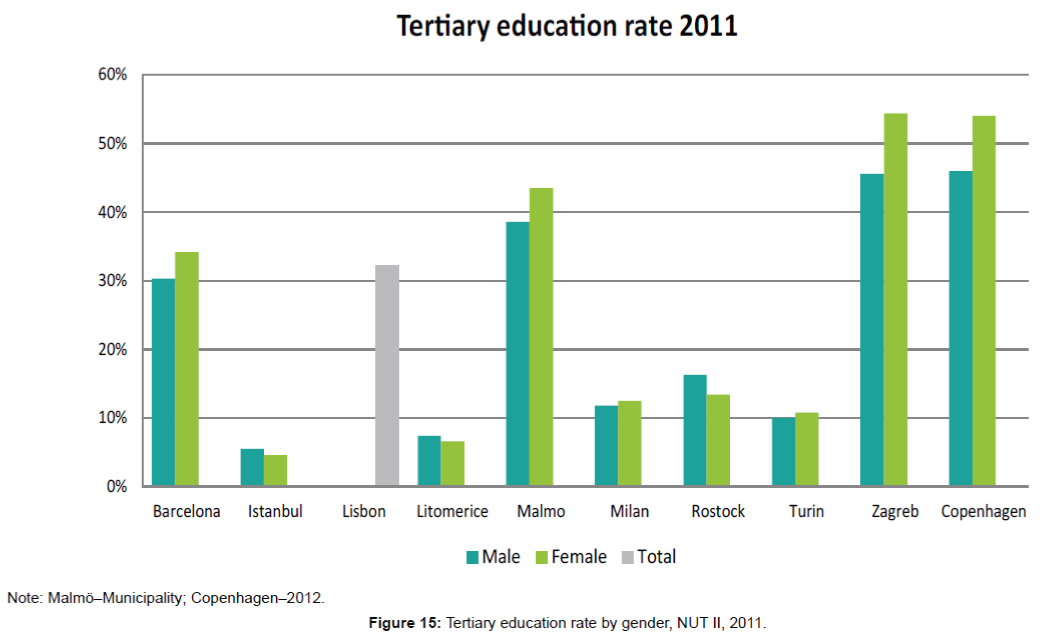
Tertiary education level: Tertiary education rate is higher in Zagreb and Copenhagen, followed by Malmö, Barcelona and Lisbon. Istanbul reports the lowest tertiary education level. It is interesting to note that female have generally higher education rates than men (Figure 15).
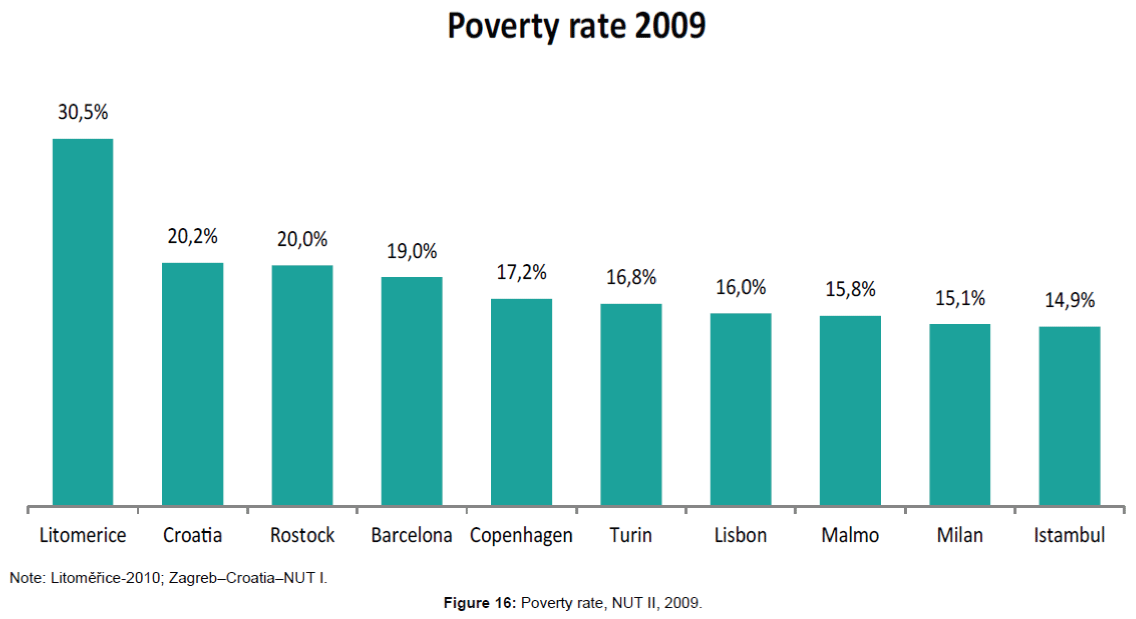
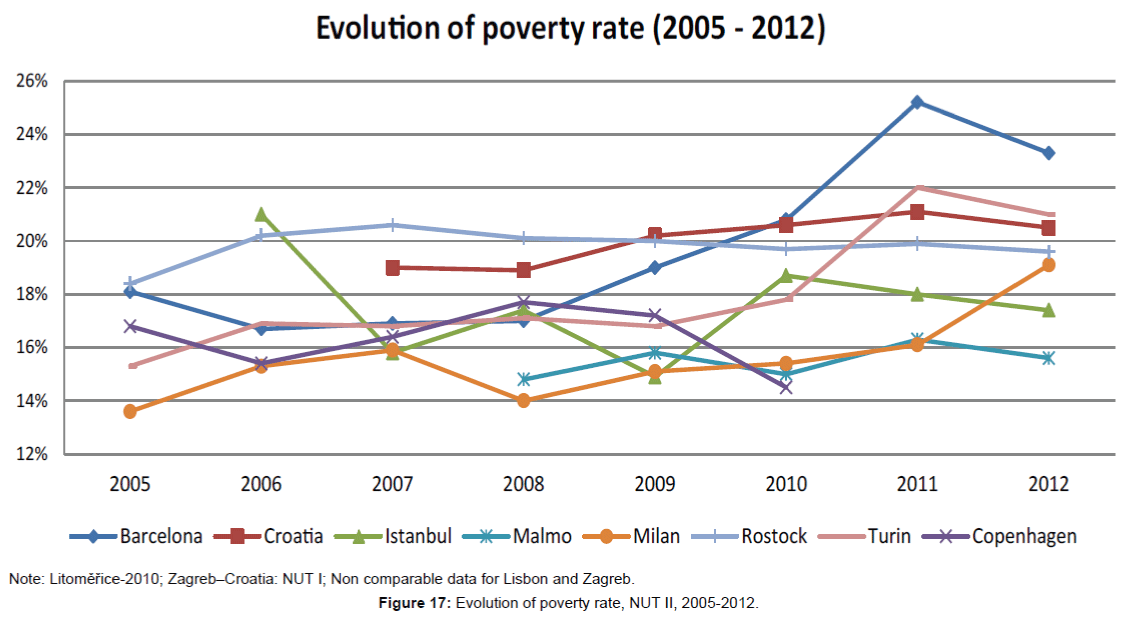
Poverty level: In 2009, Litomerice and Zagreb (Croatia) presented the highest poverty rates, followed by Rostock and Barcelona. Istanbul reported a poverty rate of 14.9%.
A sharp increase in the poverty rate happened between 2008 and 2011 while a reversion of this trend can be appreciated from 2011 onwards, being Milan the exception. It is worth of notice that Copenhagen reported a continuous decrease in poverty levels since 2008 (Figures 16 and 17).
Economic Performance
Economic performance of case study cities will be analysed based on selected KPI.
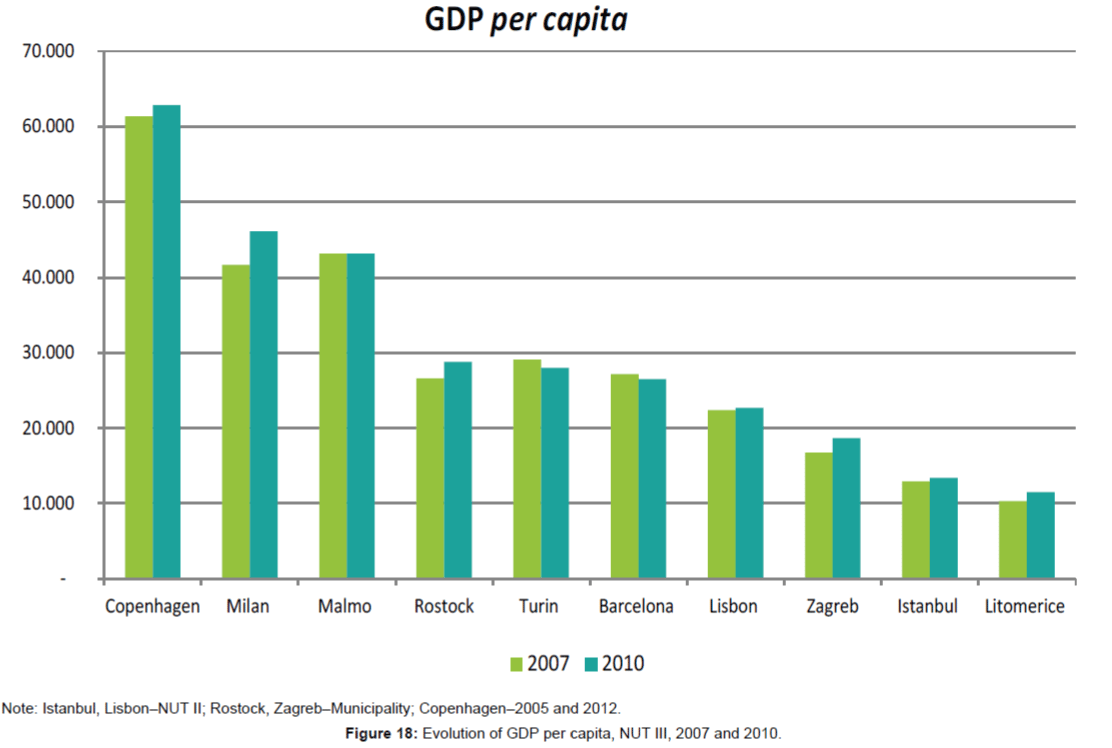
Wealth: Copenhagen, Milan and Malmö have the highest level of GDP per capita among the case study cities. This position is followed by Rostock, Turin and Barcelona. Turin and Barcelona presents a decrease in the level of wealth between 2007 and 2010 (Figure 18).
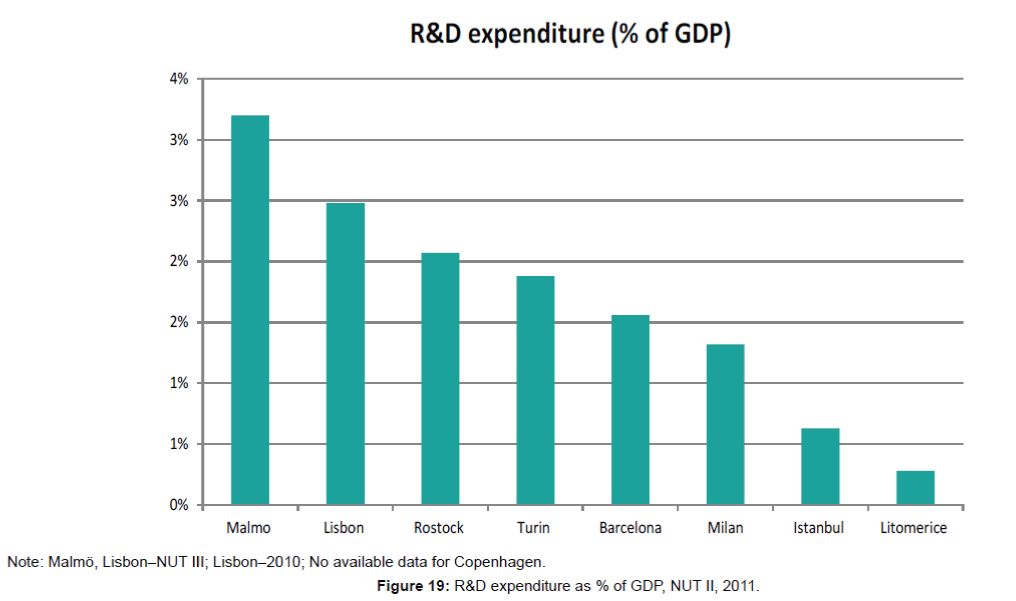
R&D intensity: Malmö (3.2%) and Lisbon (2.48%) are the best performers in term of R&D expenditure as a percentage of GDP, followed by Rostock and Turin. The worst performer is Litomerice (0.28%) (Figure 19).
Key Findings And Conclusions
The evaluation of the pre-defined Key Performance Indicators in the case study cities suggests that there is a global trend towards a post-carbon paradigm. However, cities were generally affected by the economic and financial crisis, with negative consequences on unemployment and poverty. Case study cities present different development stages towards sustainability.
Barcelona is at the forefront of the smart cities movement, with an intensive use of smart technologies. Several strategies towards a post-carbon city are being implemented by the Metropolitan Area; but energy and carbon emissions intensity are still high. Unemployment and poverty are weaknesses that have been enhanced by the economic and financial crisis. One of the biggest challenges of the city is to find a balance between the need to maintain it as a tourist centre, while keeping its local character.
Copenhagen is a leading city in terms of urban sustainability, being climate change one of the prominent urban policy issues. The ambition for Copenhagen is to become the first CO2 neutral capital in the world by 2025. Several strategies and plans are being implemented in the areas of climate change, green buildings and mobility. Moreover, the city developed an integrated monitoring system of a large quantity of environmental indicators. It is a young, qualified and diverse city with good economic performance. High level of low-income citizens and widening income gap are the main challenges faced by the city.
Istanbul is in an initial stage of development towards a post-carbon city. Environmental performance is the weakest dimension and most underestimated by the city. However, some investments were made in the area of transportation. The main problems are population increase and growing urbanisation, urban sprawl towards peripheries, air and environmental pollution, and stress on natural protection areas and forests. However, Istanbul is improving in economic and social terms, being a dynamic and vibrant city.
Lisbon is in an intermediate stage of development in the transition towards a post-carbon city. Several strategies and projects have been launched in the areas of energy, mobility, and biodiversity but with limited impacts. The car is still the privileged transport mode, being mobility one of the main urban challenges. However, the reduction of water losses was expressive. Due to economic and financial crisis, unemployment and risk of poverty are increasing. Reduced population and aging people in the city centre are also a problem. There is a need to invest in buildings renovation.
Litomerice is in an initial stage of development in the transition towards a post-carbon city. It is a small city that is influenced by the development of higher territorial units. However, it is one of pioneer cities in Czech Republic aiming at energy efficiency and renewable energy production. To become an energy self-sufficient city is the ambition, mostly based on the geothermal power plant future project. The dependence on the availability of external financial sources is a reality.
Malmö is also a frontrunner in the transition towards a postcarbon city. An ambitious energy strategy is being implemented with positive impacts in carbon emissions and energy consumption. Several improvements were made in the area of sustainable transportation. It is a young, qualified and multicultural city with reasonable economic and social performance. Economic inequity and social segregation (due to high immigration numbers) are the main urban challenges.
Milan is in an intermediate stage of development in the transition towards a post-carbon city. It is a leading city in economic terms but the investment in environmental policy issues is comparatively lower. However, it has an advantage compared to other Italian cities in terms of environmental standards, but behind European average standards. There is a need to invest in the shift towards a zero-carbon paradigm and to increase civil awareness. Major urban problems are pollution, poor air quality and aged building stock.
Rostock is in an advanced-intermediate stage of development in the transition towards a post-carbon paradigm. Important measures were adopted to reduce the environmental footprint of the city, namely in the areas of air quality, waste and water management and sustainable mobility with positive impacts. The main urban challenges are linked to poverty, unemployment and weak infrastructures.
Turin is in an intermediate stage of development in the transition towards a post-carbon city. It is an innovative city, but it is being affected by unemployment and poverty due to strong specialisation. Major urban problems are pollution and poor air quality.
Zagreb is in an initial stage of development in the transition towards a post-carbon city. Some grassroots movements are in place, but strategic planning is weak. Critical success factors are unemployment and poverty (social), public transportation and municipal waste management (environment), and GDP per capita, business survival and social entrepreneurship (economic). It is worth of notice the high qualification of the population, in comparison with other case study cities.
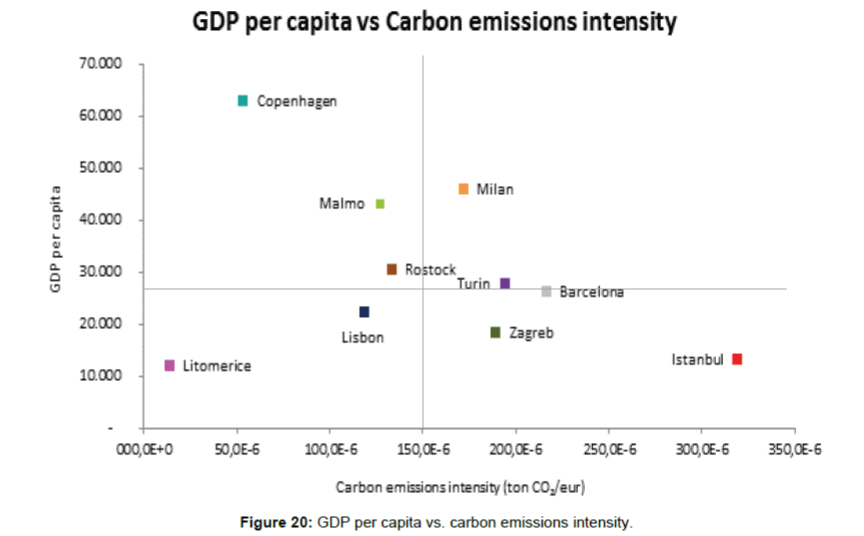
Based on the previous analysis and through the cross analysis of GDP per capita and carbon emissions intensity, we can identify tentatively groups of cities with different stages of development in the transition towards a post-carbon city (Figure 20):
Group 1: Copenhagen, Malmö and Rostock: Higher GDP per capita, and lower carbon emissions intensity.
Group 2: Milan, Turin and Barcelona: Higher GDP per capita, and higher carbon emissions intensity.
Group 3: Istanbul and Zagreb: Lower GDP per capita, and higher carbon emissions intensity.
Group 4: Lisbon and Litom??ice: Lower GDP per capita, and lower carbon emissions intensity.
Thus, Copenhagen and Malmö are at the forefront of the transition towards a post-carbon city. They are young, qualified and multicultural cities and present a good economic performance in terms of GDP per capita. These cities have clear strategic visions in the area of urban sustainability, and are implementing several projects on mobility, energy and climate with positive impacts.
However, case study cities are very different in terms of population size and economic, social and cultural dynamics, which makes the comparison difficult. Moreover, the majority of cities had problems on data collection; thus, the development of urban information systems is a recommendation for all case study cities.
References
- Levin, Simon A, Harvey JA (1999) Fragile Dominion: Complexity and the Commons. Perseus Reading, MA.
- Berkes F, Folke C, Colding J (2000) Linking social and ecological systems: management practices and social mechanisms for building resilience. Cambridge University Press.
- Gunderson LH (2001) Panarchy: understanding transformations in human and natural systems. Island press.
- Norberg J, Cumming GS (2008) Complexity theory for a sustainable future: conclusions and outlook. Complexity Theory for a Sustainable Future, Columbia University Press, pp: 277-293.
- Evans G (2008) Transformation from Carbon Valley to a Post-Carbon Society in a Climate Change Hot Spot: The Coalfields of the Hunter Valley, New South Wales, Australia. Ecology and Society 13: 39.
- UNEP (2011) Towards a Green Economy: Pathways to Sustainable Development and Poverty Eradication - A Synthesis for Policy Maker.
- Duren RM, Miller CE (2012) Measuring the carbon emissions of megacities. Nat Clim Chang 2: 560-562.
- Satterthwaite D (2008) Cities contribution to global warming: notes on the allocation of greenhouse gas emissions. Environ Urban 20: 539-549.
- Keivani R (2010) A review of the main challenges to urban sustainability. International Journal of Urban Sustainable Development 1: 5-16.
- Pisano U, Lepuschitz K, Berger G (2014) Framing Urban Sustainable Development.
- Adger WN, Arnell NW, Tompkins EL (2005) Successful adaptation to climate change across scales. Glob Environ Change 15: 77-86.
- Rotmans J, Kemp R, Van Asselt M (2001) More evolution than revolution: transition management in public policy. Foresight 3: 15-31.
- Geels FW (2011) The multi-level perspective on sustainability transitions: Responses to seven criticisms. Environ InnovSociet Trans 1: 24-40.
- Vivid Economics (2013) G20 Low Carbon Competitiveness Index: 2013 Update. Climate Institute.
- OECD/LEED (2013) Green Growth in the Benelux: Indicators of Local Transition to a Low-Carbon Economy in Cross-Border Regions. Secretary-General of the OECD.
- Economist Intelligence Unit (2012) “The Green City Index - A Summary of the Green City Index Research Series.†Siemens AG Corporate Communication and Government Affairs.
- Joint Research Centre European Commission, World Economic Forum (2012) Environmental Performance Index and Pilot Trend Environmental Performance Index.
- Marcelino M (2007) Environmental Portuguese Agency, New University of Lisbon - Faculty of Science and Technology. “Indicators System of Sustainable Development - SIDS Portugalâ€. Environmental Portuguese Agency.
- Folke C, Carpenter S, Walker B, Scheffer M, Elmqvist T, et al. (2004) Regime shifts, resilience, and biodiversity in ecosystem management. Annual Review of Ecology, Evolution, and Systematics 35: 557-581.
- GallopÃn GC (2006) Linkages between vulnerability, resilience, and adaptive capacity. Glob Environ Change 16: 293-303.
- Lebel L, Anderies JM, Campbell B, Folke C, Hatfield-Dodds S, et al. (2006) Governance and the capacity to manage resilience in regional social-ecological systems.
- National Research Council (2004) Adaptive Management for Water Resources Planning. The National Academies Press, Washington, DC.
- Olsson P, Gunderson LH, Carpenter SR, Ryan P, Lebel L, et al. (2006) Shooting the rapids: navigating transitions to adaptive governance of social-ecological systems. Ecology and society 11: 18.
Citation: Selada C, Silva C, Almeida AL, Guerreiro D (2016) Towards a Postcarbon Future: Benchmarking of 10 European Case Study Cities. Innov Ener Res 5: 140.
Copyright: ©2016 Selada C, et al. This is an open-access article distributed under the terms of the Creative Commons Attribution License, which permits unrestricted use, distribution, and reproduction in any medium, provided the original author and source are credited.
Select your language of interest to view the total content in your interested language
Share This Article
Recommended Journals
Open Access Journals
Article Usage
- Total views: 10982
- [From(publication date): 12-2016 - Aug 29, 2025]
- Breakdown by view type
- HTML page views: 10088
- PDF downloads: 894

