Trends Analysis of Groundwater: Using Non-Parametric Methods in Terengganu Malaysia
Received: 07-Dec-2014 / Accepted Date: 16-Jan-2015 / Published Date: 26-Jan-2015 DOI: 10.4172/2157-7617.1000251
Abstract
Groundwater is the most essential and reliable source of fresh water in every part of the world including an area with high excessive amount of rainfall and plentiful surface water. The study used Mann-Kendall t-test to analyze the data collected from the seven hydrological stations in Terengganu, Malaysia. This analysis investigated the pattern and trends of the daily groundwater level data. The result of the analysis shows that there is a negative increase in trends for the groundwater level of 2000 to 2012 and the result also indicate that, the most decreases in trends is from the year 2005 to 2009 that is from 130 to 280 in the trend chart. However there is small increases in trend from 2009 to 2012, that is from 280 to 350 in the chart. This result entailed that there is an expectation of increases in trend in the future in the area.
Keywords: Groundwater level; Trend analysis; Correlation; Homogeneity test; Mann-Kendall t test; Terengganu
7293Introduction
Groundwater is among the most vital source of fresh water in the earth that meets the demand of human endeavor such as manufacturing industries, agriculture, mining, and municipal water supply. Due to increases in population in different part of the world, the study of groundwater management is of great important in every part of the world as it’s a reliable source of fresh water including areas with abundant surface water [1]. The monitoring of groundwater for a good management and provision of all the solution to its problems has to do with trend analysis. A non-parametric analysis is a good method for trend identification. Various researchers have been used this technique for trend analysis of groundwater in different part of the world.
Vissar [2] studied the trend in groundwater through Mann-Kendall test at a specific depths and the time-averaged profile due to change in agricultural practices over the Dutch province of Noord-Brabant.
Shamsudduha et al., [3] studied recent trends in groundwater levels for the period 1985 to 2005 in highly seasonal hydrological system of Ganges-Brahmaputra-Meghna Delta of Bangladesh using nonparametric techniques. The result indicated that the observed variance in groundwater level declining by (>1 meter/year) were detected in preurban and urban areas. It is also found that the rate of 0.1-0.5 meter/ year where intensive abstraction of groundwater was conducted for the dry season rice cultivation. They also reported that rising groundwater levels from 0.5-2.5 meter/year were also observed in the estuarine and southern coastal regions.
Lee et al., [4] studied the variability in the groundwater levels at Daegu, Korea and the result was been reported that the construction of subway tunnels will lead to the declined in groundwater level of the area.
Chen et al., [5] investigated the correlation between the groundwater levels and the climatic parameters in the Manitoba Canada by estimating the mean data, the minimum and maximum temperature and precipitation during the hundred year’s period for 1900 to 2000. Their finding explained that the mean annual temperature and precipitation were found to be significantly correlated with the groundwater in the Monitoba Canada.
Tabari and Nikbakht Some’e [6] investigated the temporal trends in annual, seasonal and monthly groundwater levels using Mann-Kendall test and the Sen’s slope estimator in the Mazandaran province located at the north of Iran during the period of 1985 to 2007. The results obtained were a mixed combination of positive and negative trends in the groundwater level series, but the positive trends were greater than the negative trends. However, the results of spatial analysis indicated that the positive trend were mostly concentrated in the central parts of Mazandaran province where paddy fields are the major source of fresh water for consumption.
This present study endeavor to provide the dynamics and trend analysis of the behavior of seasonal groundwater level in Terengganu east coast of peninsular Malaysia over the past of 13 years, the large variability in time and space requires that, for accurate unbiased results long-term climate analyses be based on homogeneous data. Homogeneity is the one in which variations are caused only by variations in weather and climate [7]. Change in instruments, station location, station environment and other non-climatic factors can also affect the homogeneity of the data. Therefore some test and adjustment is needed to detect the non- homogeneities.
Materials And Methods
Study area
Terengganu is a state of Malaysia; it lies in the coordinate 4º45?N latitude and 103º0?E longitude which is located in the north-eastern of Peninsula Malaysia. Terengganu is bordered in the northwest by Kelantan, the southwest by Pahang and the east by South China Sea. Terengganu has tropical monsoon climate which is generally fairly hot and humid all year around. The temperature is relatively uniform within the range of 21ºC to 32ºC throughout the year. During the months of January to April, the weather is generally dry and warm. Humidity is consistently high which approximately 80% in day time and slight cooler during night (Figure 1).
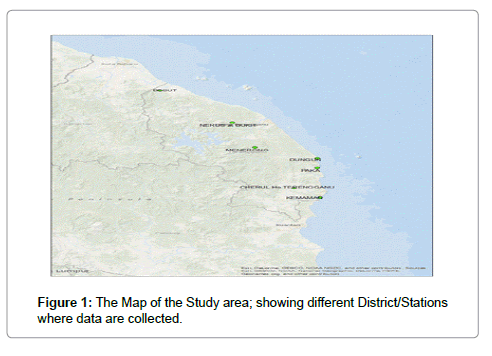
Figure 1: The Map of the Study area; showing different District/Stations where data are collected.
The study area has characterized by two main types of monsoon, the southwest monsoon season which is usually established in the latter half of May or early June and end in September, and the northeast monsoon season which is usually starts in early November and ends in March. Terengganu being exposed to the coast receives heavy rainfall of approximately between 2034 mm to 2504 mm per year which can easily break the bank of the rivers and cause overbank discharge. When the northeast monsoon blows between Novembers to January some areas suffer flooding [8].
Data quality and analysis
The daily groundwater level data from seven hydrological stations collected from the Department of Minerals and Geosciences Terengganu Malaysia for the period of 2000 to 2012 were sorted and arranged in an excel for different homogeneity test. The list of the stations, codes and their coordinates is given in Table 1 below.
| Station code | Stations | Latitude | Longitude |
|---|---|---|---|
| 5524001 | Besut | 5º44'20''N | 102º29'35''E |
| 4832011 | Dungun | 4º47'00''N | 103º26'00''E |
| 4234109 | Kemaman | 4º14'00''N | 103º27'00''E |
| 5229430 | Nerus at Bukit | 5º17'30''N | 102º55'20''E |
| 4733084 | Paka | 4º39'00''N | 103º26'00''E |
| 4131001 | Cherul at Ho, Tereng. | 4°21'56''N | 103º7'50''E |
| 4930038 | Menerong | 4º56'20''N | 103º03'45''E |
Table 1: Showing the stations with their codes and coordinates.
Homogeneity of trends
The data was sorted and arranged in Excel and checked the homogeneity of it using the standard normal homogeneity test and Von Neumann ratio test. The homogeneity test is based on partition the sum of square that uses one-side Chi-square test with alpha9,10]. The data series from these seven stations that were used in this study were found to be homogeneous. And the data was dully completed with only a missing data of less than 4% for the period of 2000 to 2012. Weighing method was adopted such as correlation and inverse distance was used to estimate the missing data during this analysis as suggested by Suhaila et al., [11]. Mann- Kendall test using XLSTAT was employed to analyze the trends in the groundwater level for all the seven stations using the monthly data of period 2000 to 2012. The test is to identify whether or not a statistically significant decreasing or increasing trends or none could be found in a data set. Mann-Kendall test is a nonparametric test for identifying trends in a series of data. Confidence levels of 90 and 95 percent were taken as thresholds to classify the significance of the trends, p-values smaller than 0.05 must to be fulfilled before the trend test was concluded to be significant.
Mann-Kendall test
Mann [12] presented a non-parametric statistical test for randomness against time, which constitutes a particular application of Kendall’s test for correlation commonly called “Mann-Kendall” or Kendall t test. This method has been extensively used to assess significance of trends (Monotonic) exist in hydro-metrological data such as precipitation, groundwater level, temperature and stream flow. This method is very essential as it has no assumption were made in the data to be tested. Letting X1, X 2…….Xn be a sequence of measurements over a time, Mann proposed to test the null hypothesis, Ho , that the data come from a population where the random variables are independent and identically distributed (that there is no trend). The alternative hypothesis H1' is that the data follow a monotonic trend over time (that there is trend). Under Ho the Mann-Kendall test statistics is given by:
Where Xj and Xi are the consecutive series of data values, and n is the length of the dataset.
Under the hypothesis of independent and randomly distributed random variables, when n ≥ 8, the S statistic is approximately normally distributed with zero mean and variance as:
As a consequence, the standardized Z statistics follow a normal standardized distribution:
It follow that, the hypothesis that there is no trend is rejected when the Z value computed by the equation above is greater in absolute value than the critical value Zα , at a chosen level of significant α.
Results and Discussion
The groundwater level data for the period of 13 years (2000 to 2012) of all the stations was checked for homogeneity as explained in data quality above, and found it to be homogeneous. The results of Mann-Kendall t test carried out for the seven stations included in this analysis shows that, there is negative increasing trend at 5% significant level. The analysis tables and chart of Mann-Kendall and Sen’s slope estimator has been used for the determination of trend. These were discussed accordingly.
The summary of this analysis explained that the exact p-value could not be computed, but an approximation has been used to compute the p-value. The interpretation of the table has to do with hypothesis of the analysis.
Ho : There is no trend in the series of groundwater level data
Ha : There is a trend in the series of groundwater level data
The assumption is that as the computed p-value is lower than the significance level alpha=0.05, the null hypothesis should be rejected and accept the alternative hypothesis. In the above Table 2 the result shows that the computed p-value is <0.0001 which is very low compared to the significance level alpha 0.05, hence the null hypothesis should be rejected and accept the alternative hypothesis. The risk to reject the null hypothesis why it is true is less than 0.01% which negligible values.
| Mann-Kendall trend test / Two-tailed test (GROUNDWATER LEVEL (M)): | |
|---|---|
| Kendall's tau | -0.365 |
| S | -20767 |
| Var(S) | 4309200.333 |
| p-value (Two-tailed) | <0.0001 |
| alpha | 0.05 |
Table 2: Showing the results for Mann-Kendall Trend Test.
However, the Sen’s slope, confidence interval, charts (Figure 2) and above Table 2 indicated the decreases in groundwater level in Terengganu Malaysia from 2000 to 2012.
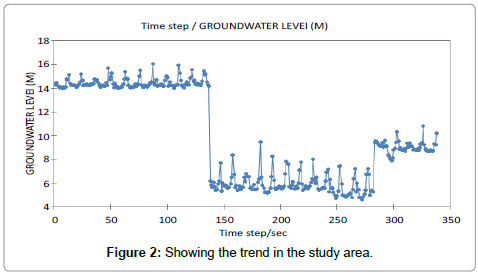
Figure 2: Showing the trend in the study area.
The result of the analysis shows that there is a negative increase in trends for the groundwater level of 2000 to 2012 and the result also indicate that, the most decreases in trends is from the year 2005 to 2009 that is from 130 to 280 in the trend chart. However there is small increases in trend from 2009 to 2012, that is from 280 to 350 in the chart. This result entailed that there is an expectation of increases in trend in the future in the area [13-17].
Conclusion
The groundwater level fluctuation and trends has been assessed using Mann-Kendall t test in Terengganu, Malaysia. The analysis shows the existence of trends for the analyzed data of 2000 to 2012. As the result of Mann-Kendall test show’s (computed p-value (<0.0001) is less than the alpha value (0.05) means the trend exist. The findings of this research can provide some information to the government on water management and for predicting future climatic events. Nevertheless, further studies should be conducted to consider more characteristics of groundwater level as well as other climate variables. Analyses such as bootstrap and permutation test can also be suggested for verification of the existence of trends in the area, because they are also good methods for trend identification.
Acknowledgements
The authors will like to thanks the entire staff of the Department of Minerals and Geosciences Terengganu, Malaysia for the providing the daily groundwater level data for this study. And the UniSZA postgraduate school for the whole transportations they provided during the site visit and collection of data.
References
- Abdullahi MG, Toriman ME, Gasim MB, Juahir H (2014) Rainfall Dynamics of Terengganu Malaysia and its Recent Trends Analysis Using The Mann-Kendall Test. J Adv Biotech 4: 2.
- Vissar A (2009) Trend in groundwater quality in relation to groundwater age. Netherlands Geographical studies 384.
- Shamsudduha M, Chandler RE, Taylor RG, Ahmad KM (2009) Recent trends in groundwater levels in a highly seasonal hydrological system: the Ganges-Brahmaputra-Meghna Delta. Hydrol Earth SystSci 13: 2373-2385.
- Yeongseon LJ, Seokyoon J, Hwanhwi L (2007) Causes of changes in groundwater levels at Daegu Korea: the effect of subway excavations. Bull EngGeol Environ 66: 251-258.
- Chen Z, Grassby S, Osadetz KG (2004) Relationship between climate variability and groundwater level in the Upper carbonate aquifer, South Monitoba, Canada. J Hydrol 290: 43-62.
- Hossein T, Jaefar N, Shifteh SB (2011) Investigation of groundwater level fluctuation in north of Iran. Environ Earth Sci 66: 231-243.
- Conrad and Pollak LW (1950) Method of Climatology. Harvard University Press, Cambridge, UK.
- Van Belle G, Hughes JP (1984) Non-parametric tests for trend in water quality. Water Resour Res 20: 127-136.
- Gan TY (1998) Hydro climatic trends and possible climatic warming in the Canadian prairies. Water Resour Res 34: 3009-3015.
- Suhaila J, Deni SM, Wanzin W, Jemain AA (2010) Trends in Peninsular Malaysia Rainfall Data during the Southwest Monsoon and Northeast Monsoon Seasons: (1975-2004). SainsMalaysiana 39: 533-542.
- Mann-Kendall G (1975) Rank Correlation Methods. [4th Edn] Griffin, London.
- Jan C, Chen T, Lo W (2007) Effect of rainfall intensity and distribution on groundwater level fluctuations. J Hydrol 332: 348-360.
- Kumar CP,Seethapathi PV (1988) “Effect of Additional Surface Irrigation Supply on Ground Water Regime in Upper Ganga Canal Command Area, part 1- Ground Water Balance†National Institute of Hydrology, Case Study Report No. CS-10. 1987-88.
- New M, Hewitson B, David B. Stephenson, Tsiga A, Kruger A, et al. (2006) Evidence of trends in daily climate extremes over southern and West Africa. J Geophys Res111.
- Suhaila MD (2010) Analysis of Distribution String Day Wet (Dry) in Peninsular Malaysia PhD Thesis. University Kebangsaan Malaysia (unpublished).
- Venema V, Mestre O, Aguilar E, Auer I, Guijarro JA, et al.(2012) Benchmarking homogenization algorithms for monthly data.Clim Past 8: 89-115.
Citation: Abdullahi MG, Toriman ME, Gasim MB, Dantsoho IG (2015) Trends Analysis of Groundwater: Using Non-Parametric Methods in Terengganu Malaysia. J Earth Sci Clim Change 6: 251. DOI: 10.4172/2157-7617.1000251
Copyright: © 2015 Abdullahi MG, et al. This is an open-access article distributed under the terms of the Creative Commons Attribution License, which permits unrestricted use, distribution, and reproduction in any medium, provided the original author and source are credited.
Select your language of interest to view the total content in your interested language
Share This Article
Recommended Journals
Open Access Journals
Article Tools
Article Usage
- Total views: 16430
- [From(publication date): 1-2015 - Aug 30, 2025]
- Breakdown by view type
- HTML page views: 11629
- PDF downloads: 4801