Research Article Open Access
Use of Protozoa for Assessing Water Quality in a Humid Subtropical Urban Wetland Ecosystem, Southern China
Cuicui Hou1, Xinlu Shi1*, Guijie Liu1, Songlu Liu1, Xiaowen Zhu1 and Henglong Xu2*1Hang Zhou Key Laboratory for Animal Science and Technology, and Laboratory of Experimental Animal Science, Hang Zhou Normal University, Hang Zhou 310036, China
2Laboratory of Microbial Ecology, College of Marine Life Science, Ocean University of China, Qingdao 266003, China
- *Corresponding Author:
- Xinlu Shi
Hang Zhou Key Laboratory for Animal Science and Technology
and Laboratory of Experimental Animal Science
Hang Zhou Normal University
Hang Zhou 310036, China
Tel: +86 15868472538
E-mail: shixl56@163.com - Henglong Xu
Laboratory of Microbial Ecology
College of Marine Life Science Ocean University of China
Qingdao 266003, China
Tel: +86 532 8203 2082
E-mail: henglongxu@126.com
Received date: October 25, 2016; Accepted date: November 17, 2016; Published date: November 24, 2016
Citation: Hou C, Shi X, Liu G, Liu S, Zhu X, et al. (2016) Use of Protozoa for Assessing Water Quality in a Humid Subtropical Urban Wetland Ecosystem, Southern China. Environ Pollut Climate Change 1:105
Copyright: © 2016 Hou C, et al. This is an open-access article distributed under the terms of the Creative Commons Attribution License, which permits unrestricted use, distribution, and reproduction in any medium, provided the original author and source are credited.
Visit for more related articles at Environment Pollution and Climate Change
Abstract
Multivariate bioassessment based on community data has many advantages to assess environmental quality status in aquatic ecosystems. However, there are few reports on their use for bioassessment in subtropical wetland systems. In this study, the protozoan microfauna and their use in evaluating water quality status was investigated in a humid subtropical urban (XiXi) wetland system in southern China, during the period of June 2013-May 2014. Samples were collected every month at six sampling stations within different pollution/eutrophication levels. A total of 85 protozoan species were recorded, including 67 ciliates, 10 flagellates, 8 sarcodines. A clear variation on spatial scale in protozoan community structures were represented at the six stations. Multivariate approaches revealed that the variations in the community structure were significantly related to the changes of environmental variables, especially nutrients ammonia-N (NH4-N), nitrate-N (NO3-N) and total phosphorus (TP), alone or in combination with water temperature (T) and dissolved oxygen (DO) and Four dominant species (Euglena acus, Cucurbitella mespiliformis, Codonella acutula and Hemiophrys punctata) were significantly correlated with nutrients. Otherwise, the species richness, diversity and evenness indices represented significant correlations with the nutrients. The results demonstrate that the community-based bioassessment using protozoa may be used as a feasible protocol for determining the water quality status and human disturbance in a humid subtropical urban wetland system.
Keywords
Community-based bioassessment; Protozoan communities; Environment stress; Urban wetland; Humid-subtropical zone.
Introduction
Protozoa have many advantages for assessing water quality, such as short life generations and more rapid response to environmental stress than metazoa [1-6]. As an important component of microfauna, protozoa play crucial roles in mediating carbon and energy from bacteria and microalgae to high trophic levels in aquatic microbial food webs, even in extreme environments [7-12]. Thus, special attention has been focused on bioassessment using protozoa as a robust bioindicator for evaluating water quality [13-15]. So far many investigations on such monitoring programs have been carried out based on ecological features at species/population resolutions (e.g. indicator species) or functional parameters (e.g. colonization rate) mainly in freshwater systems (e.g. lake and river) [13]. However, little information on community-based bioassessment using protozoa have been documented in subtropical wetland systems [13,16,17].
Xixi Wetland is the first and a unique national wetland park with integration of domestic urban, farming and cultural wetland in China. It is located in the center area of Hangzhou city, southern China, with an area of 10.08 km2. Of the total area, 46% is covered with variety of creeks and ponds [18]. As a humid subtropical urban wetland ecosystem, so far it have intensively been utilized for tourism, recreation, sedimentation and water supply, and thus is of a great conservation value for controlling flood, resisting drought, regulating climate, controlling soil erosion [19]. However, the water quality status of Xixi wetland has been seriously influenced by human activities such as tourist, industrial and agricultural activities [20]. In recent years, a range of ecological issues on water quality monitoring have been studied in freshwater river systems and subtropical canals [5,17]. However, few works on community-based bioassessment using protozoa in Xixi Wetland have been conducted.
In the present study, the protozoan community patterns were studied during a 1-year cycle (June 2013-May 2014) at six sampling stations in Xixi Wetland, southern China. Our aims were focused on: (1) the species composition of protozoa, (2) spatial variations in community structure of protozoa, (3) relationships between the variation in community patterns and changes of environmental variables, and (4) the applicability of bioassessment using protozoa as a robust bioindicator of water quality in freshwater humid subtropical urban wetland ecosystems.
Materials and Methods
Study stations
Six sampling stations (A–F), within a pollution/eutrophication gradient, were selected as study areas (11.5 km2) in the Xixi Wetland. Stations A (30°15′33.16”N, 120°03′26.81”E) and B (30°15′58.53”N, 120°03′17.03”E), near the tourist wharf, receiving organic pollutant discharge, were selected as most stressed areas. Station C (30°16′16.59”N, 120°03′19.60”E) and D (30°16′29.99”N, 120°03′59.35”E) were moderately polluted by domestic sewage from hotel and street market. Station E (30°15′58.33”N, 120°4′0.16”E) was located in the outlet of the Xixi wetland and was stressed by pollutions. Station F (30°15′47.02”N, 120°3′57.67”E) was a relatively clean area which was distant from the pollution source (Figure 1).
Data collection
A 1 year baseline with 12 sampling event were conducted from June 2013 to May 2014. At each station, 12 samples were collected (at 8–12 o’clock on day 15) every month. For quantitative and qualitative analyses, a mixed water sample of total 1,000 ml from three layers (upper, mid and bottom) in water column was taken at depths of 1–3 m. The fixation of water samples were carried out by adding Lugol’s iodine solution at 2% concentration (volume/volume), and the final volume of 30 ml concentrated sediments were extracted after settlement for 48 h For quantitative analyses of protozoa, a 0.1 ml subsample of each final concentrated sediment was examined in a Perspex chamber, and the protozoan individuals were counted under a light microscope at a magnification x400. For enumeration, a total of five subsamples (0.5 ml) were checked and yielded a coefficient of variation at <8% level. [21]. For species identification, the published references, such as Shen et al. [13], Patterson and Hedley [22] and Foissner et al. [23], were used. The taxonomic schemes used were according to Levine et al. [24].
Water temperature (T), dissolved oxygen (DO) and pH were measured in situ with OHAUS ST20 and HACH HQ30d, while the nutrients ammonium nitrogen (NH4-N), nitrate nitrogen (NO3-N), nitrite nitrogen (NO2-N), total nitrogen (TN) and total phosphorus (TP) and chemical oxygen demand (COD) were measured following the methods [25].
Data analysis
Shannon-Wiener (Species diversity, H′), Pielou (evenness, J′) and Margalef (richness, D) indices are were computed following the equations:
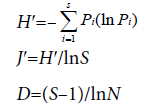
where Pi=proportion of the total count arising from the ith species; S=total number of species; and N=total number of individuals [6,26].
The values with mean and standard deviation (SD) was applied to describe and to evaluate the variations of the physicochemical variables among sites. All univariate correlation analyses were computed using the software SPSS v16.0. Data were log-transformed before analyses [5].
Multivariate analyses of protozoan communities and their relationships to changes of environmental variables were carried out using the PRIMER v7.0. Protozoan species-abundance data were fourth-root transformed before the Bray-Curtis similarity matrix was constructed while environmental variable data were log-transformed/ normalized before the Euclidean distance matrix was computed. The routine Bootstrap Average analysis was used to summarize the spatial patterns of both biotic and abiotic samples based on Bray-Curtis similarity and Euclidean distance matrices, respectively [27-29]. The routine ANOSIM (analysis of similarities) was used to signify the differences in samples among sampling stations; the routine RELATE was utilized to test the significance of biota-environment correlations; and the SIMPER (similarity percentage) analysis was used to summarize the contributions of protozoan species to communities [27,30]. The routine BIOENV (biota-environment) was run for exploring potential matching between biotic and the abiotic data [27].

Figure 1: Sampling stations (A–F) in Xixi Wetland, Hangzhou, South China. Stations A/B most stressed in Xixi Wetland near the Tourist wharfs, the pollution being mainly in the form of organic pollutants and nutrients from domestic sewage; stations C/D moderately polluted by domestic sewage from hotel and street market; Station E located in the outlet of the Xixi Wetland was stressed by pollutions. Station F was relatively clean area due to its position in the central of Xixi wetland which was distant from the pollution source.
Results
Environmental variables
The average values for environmental factors at six stations are shown in Figure 2. The average concentrations of DO were ranged from 5.35 mg l-1 (the lowest at station E) to 6.91 mg l-1 (the highest value at station F (Figure 2b). The pH ranged from 6.93 to 7.29 among the six sampling stations (Figure 2c). The highest values of COD were measured at station A, and the lowest value at station F (Figure 2d). For the nutrients NO3-N, NO2-N, TN, TP, high values were found at station A and D with minima at station F, while the high value of NH4-N occurred at station B and A compared with station C, D, E and F (Figures 2e-2i).
Species composition and distribution
A total of 85 protozoan species, including 67 ciliates, 8 sarcodines and 10 flagellates, were identified in total 72 samples during the study period. The special species distribution among six stations was summarized in Figure 3a. By cluster analysis, the 85 species were resulted in falling into seven groups (I–VII) at a 50% similarity level. For example, group I included 25 common species with high occurrence, while the other six groups (II–VII) composed of taxa with low occurrence: six common species (e.g. Cucurbitella mespiliformis, Euglena oxyuris, Euglena acus, Euglena caudata, Hlateria grandinella and Tintinnopsis wangi) in group I appeared over all six stations, eleven (78.6%) species (e.g. Nassula aurea and Hemiophrys meleagris) of group III occurred independently at station A, four (23.5%) (e.g. Colpoda patella, Arcella hemisphaerica and Lagynophrya retractilis) of group II at station B, all four forms (e.g. Euglypha tuberculata and Astylozoon faurei) of group VI at station C and all six species (e.g. Tetrahymena priformis, Trachelophyllum pusillum and Colpidium colpoda) of group VII at station D (Figure 3).
Spatial variations in protozoan community pattern
The spatial variations in species number and abundance of protozoan communities among six stations are summarized in Figures 3a and 3b. In terms of species number, the ciliates were the primarily contributors to the species compositions over all stations (Figure 4a), while the flagellates account for a dominant position at stations F on abundance (Figure 4b). The high and low species numbers were found at stations A/B and D/F (Figure 4a), but the high and low abundances were at station A/C/F and D, respectively (Figure 4b). Noted that the spatial pattern of the communities were consistent with the spatial variation in the water quality from stations A/B to F.
Compared with the relative species composition, a spatial pattern in relative abundance was shown clearly in Figures 3c and 3d. According to the spatial variation in relative abundance, two types of community structure may be identified. For example, stations A, B, C, D and E dominated by ciliates and station F was those dominated by flagellates with high contribution of flagellates (Figure 4d).

Figure 2: Spatial variations in water temperature (T, a), dissolved oxygen (DO, b), pH (c), chemical oxygen demand (COD, d), ammonium nitrogen (NH4-N, e), nitrate nitrogen (NO3-N, f), nitrite nitrogen (NO2-N, g), total nitrogen (TN, h) and total phosphorus (YP, i) among six sampling stations in Xixi Wetland, southern China, during the study period.

Figure 3:A dendrogram of the species distribution using group-average clustering on Bray-Curtis similarities for fourth-root transformed species abundance data of each species within the protozoan communities from six sampling stations in Xixi Wetland, southern China, during the study period. Abundance (ind l-1): ++++>1,000; +++100–999; ++10–99; +0–9.

Figure 4:Spatial variations in species number (a), abundance (b), relative species number (c), relative abundance (d) of protozoan communities from six sampling stations (A–F) in Xixi Wetland, southern China, during study period.

Figure 5:Multidimensional scaling (MDS) ordinations based on bootstrap average analysis for spatial patterns of environmental conditions (a) and protozoan communities (b) among six sampling stations in Xixi Wetland, southern China, during the period.
Relationship between biotic and abiotic variables
The relationships between the spatial patterns of the protozoan communities and spatial variation in environmental conditions among the sampling stations were shown in Figure 5. ANOSIM tests indicated significant differences between the pairs of A/F, B/F, D/F and E/F (P<0.05). RELATE analysis demonstrated a significant correlation between spatial variations of protozoan communities and changes in environmental variables (R=0.625; P=0.003). The BIOENV analysis showed that the changes in combination of T, DO, NH4-N, NO3-N, TP could explain the spatial variation in protozoan communities best (ρ=0.704, P<0.05) (Table 1).
The values of species number, richness, evenness and diversity represented a significant or a strong significant correlation with nutrients (NO2-N, TP or TN or NH4-N) (Table 2 and Figures 2 and 6). The evenness and diversity represented a significant negative correlation with T (Table 3). The four species (Euglena acus, Cucurbitella mespiliformis, Codonella acutula and Hemiophrys punctata) from 9 dominant protozoan species were significantly related to nutrients NH4-N, NO3-N, NO2-N, TN or TP or significantly negative correlated with T (Table 3).
Discussion
Up to now, a number of ecological studies demonstrated that multivariate analyses are more powerful for discriminating patterns of communities on spatial and temporal scales, in particular for summarizing relationships between community patterns and environmental changes [31,32,34]. In our study, the statistical multivariate tools demonstrated a significant correlation between the community patterns and the spatial variations in environmental variables. Otherwise, among 9 dominant protozoan species four forms, Euglena acus, Cucurbitella mespiliformis, Codonella acutula and Hemiophrys punctata were identified to be significantly correlated with nutrients. These findings suggest that the community-based bioassessment using protozoa may be used as a feasible protocol for assessing the water quality in the humid subtropical urban wetland systems.
The species number, individual abundance and three biodiversity (species diversity, evenness and richness) indices have widely been utilized as a useful indicator to evaluate water quality in many aquatic environments [33]. For example, the high levels of species richness, and low abundance occur in normal water bodies [4,26,32]. In our study, the species number and the three diversity indices were generally correlated with nutrients. This implies that these ecological parameters of protozoa fauna may be used as useful indicators of water quality in mid-tropical wetland systems.
Connell [34] suggested that with small environmental stress raise, the diversity will be increased because of the decreasing competition, while if the environmental stress increases up to a higher point, the diversity starts to decrease then. Thus, increased eutrophication could lead to either an increase or a decrease in diversity for a certain community. In our study, the three diversity indices of protozoan communities at station F were lower than stations A and B, although latter stations were more polluted than the former.
Conclusion
In summary, the protozoan fauna showed a clear spatial variation among the six sampling stations. Multivariate approaches demonstrated a significant correlation between the spatial patterns of protozoan communities and the changes of environmental variables, especially the combination of nutrients and DO. Four dominant species were found to be significantly related to with nutrients. The species richness, diversity and evenness indices were significantly correlated with the nutrients. The results demonstrated that the community-based bioassessment using protozoa may be used as a feasible protocol for assessing the water quality in humid subtropical urban wetland systems.
| Rank | Environmental variables | ρ value |
|---|---|---|
| 1 | T, DO, NH4-N, NO3-N, TP | 0.704 |
| 2 | DO, NH4-N, NO3-N, TP | 0.696 |
| 3 | DO, pH, NH4-N, NO3-N, TP | 0.696 |
| 4 | DO, NH4-N, NO3-N, NO2-N, TP | 0.696 |
| 5 | DO, NH4-N, NO3-N | 0.689 |
| 6 | T, DO, NO2-N, TP | 0.689 |
| 7 | T, DO, pH, NH4-N, NO3-N | 0.689 |
| 8 | T, DO, pH, NO2-N, TP | 0.689 |
| 9 | T, DO, NH4-N, NO3-N, NO2-N | 0.689 |
| 10 | DO, pH, NH4-N, NO3-N | 0.682 |
T: Water Temperature; DO: Dissolved Oxygen; COD: Chemical Oxygen Demand; NH3-N: Ammonium Nitrogen; NO3-N: Nitrate Nitrogen; NO2-N, Nitrite Nitrogen; TN: Total Nitrogen; TP: Total Phosphorus.
Table 1: Best matches of environmental variables with spatial variations in the protozoan abundances at six stations in the Xixi Wetland, southern China, during the study period
| Parameters | T | DO | pH | COD | NH4-N | NO3-N | NO2-N | TN | TP |
|---|---|---|---|---|---|---|---|---|---|
| S | -0.703 | 0.175 | 0.313 | 0.268 | 0.741 | 0.627 | 0.901* | 0.763 | 0.886* |
| N | 0.034 | 0.698 | 0.542 | -0.172 | 0.097 | -0.368 | -0.081 | -0.263 | 0.088 |
| D | -0.718 | 0.107 | 0.265 | 0.285 | 0.747 | 0.673 | 0.924** | 0.801 | 0.892* |
| J' | -0.898* | -0.298 | -0.238 | 0.562 | 0.759 | 0.877* | 0.943** | 0.935** | 0.878* |
| H' | -0.870* | -0.066 | 0.042 | 0.425 | 0.826* | 0.807 | 0.995** | 0.913* | 0.956** |
*Correlation is significant at the 0.05 level; **Correlation is significant at the 0.01 level. See Table 1 for abbreviations.
Table 2: Correlations between average values of the species number (S), abundance (N), richness(D), diversity (H') and evenness Pielou’s J'), and environmental variables.

Figure 6:Spatial variations in species richness (a) evenness (b) and diversity (c) of protozoan communities among six sampling stations (A–F) in Xixi Wetland, southern China, during study period.
| Species | T | DO | pH | COD | NH4-N | NO3-N | NO2-N | TN | TP |
|---|---|---|---|---|---|---|---|---|---|
| Euglena acus | 0.730 | 0.737 | 0.648 | -0.534 | -0.502 | -0.948** | -0.706 | -0.895* | -0.570 |
| Cucurbitella mespiliformis | 0.423 | 0.756 | 0.688 | -0.593 | -0.094 | -0.854* | -0.426 | -0.744 | -0.252 |
| Codonella acutula | -0.868* | -0.224 | -0.335 | 0.176 | 0.863* | 0.522 | 0.617 | 0.567 | 0.703 |
| Hemiophrys punctata | -0.820* | 0.001 | 0.141 | 0.051 | 0.952** | 0.615 | 0.893* | 0.738 | 0.913* |
| Euglena caudata | 0.792 | 0.647 | 0.678 | -0.335 | -0.654 | -0.742 | -0.583 | -0.703 | -0.552 |
| Euglena oxyuris | 0.350 | -0.518 | -0.620 | -0.200 | -0.449 | -0.162 | -0.625 | -0.337 | -0.635 |
| Tintinnopsis wangi | 0.065 | -0.664 | -0.667 | 0.068 | -0.252 | 0.291 | -0.217 | 0.127 | -0.306 |
| Sphaerophrya soliformis | 0.399 | 0.086 | -0.221 | -0.026 | -0.514 | -0.497 | -0.693 | -0.584 | -0.590 |
| Tintinnidium fluviatile | -0.110 | 0.106 | -0.147 | 0.173 | 0.048 | -0.226 | -0.118 | -0.213 | -0.018 |
*Correlation is significant at the 0.05 level; **Correlation is significant at the 0.01 level. See Table 1 for abbreviations.
Table 3: Correlations between four dominant species abundances and environmental variables during the study period.
Acknowledgement
This work was supported by Natural Science Foundation of China (project numbers: 31272262, 31071880, 41076089 and 31673308). Zhejiang Key Scientific & Technological Innovation Team Project (2010R50039-20), and the Hangzhou Key Laboratory for Animal Adaptation and Evolution (20100333T05).
References
- Cairns Jr J (1979) A strategy for use of protozoans in the evaluation of hazardous substances. In: James A, Evison L ed. Biological Indicators of Water Quality. John Wiley and Sons Great Britain
- Patrick R (1988) Importance of diversity in the function and structure of riverine communities. Limnol Oceanogr 33: 1304–1307.
- Corliss JO (2002) Biodiversity and biocomplexity of the protists and an overview of their significant roles in maintenance of our biosphere. Acta Protozool 41: 199–219.
- Madoni P, Braghiroli S (2007) Changes in the ciliate assemblage along a fluvial system related to physical, chemical and geomorphological characteristics. Eur J Protistol 43: 67–75.
- Tan X, Shi X, Liu G, Xu H, Nie P (2010) An approach to analyzing taxonomic patterns of protozoan communities for monitoring water quality in Songhua River, northeast China. Hydrobiologia 638: 193–201.
- Shi X, Sun Z, Liu G, Xu H (2015) Insight in an annual pool of phytoplankton in humid subtropical canal systems. Environ Sci Pollut Res 22:1199–1206.
- Panswad T, Chavalparit O (1997) Water quality and occurrences of protozoa and metazoa in two constructed wetlands treating different wastewaters in Thailand. Water Sci Technol 36: 183–188.
- Finlay BJ, Esteban GF (1998) Freshwater protozoa: Biodiversity and ecological function. Biol Conserv 7: 163–1186.
- Peštová D, Macek M, Pérez MEM (2008) Ciliates and their picophytoplankton-feeding activity in a high-altitude warm-monomictic saline lake. Eur J Protistol 44:13–25.
- Kchaou N, Elloumi J, Drira Z, Hamza A, Ayadi H, et al. (2009) Distribution of ciliates in relation to environmental factors along the coastline of the Gulf of Gabes, Tunisia. Estuar Coast Shelf Sci 83: 414–424.
- Xu H, Min G, Choi J, Kim S, Jung J, et al. (2009) Approach to analyses of periphytic ciliate communities for monitoring water quality using a modified artificial substrate in Korean coastal waters. J Mar Biol Assoc UK 89: 669–679.
- Xu H, Min GS, Choi JK, Jung JH, Park MH (2009) An approach to analyses of periphytic ciliate colonization for monitoring water quality using a modified artificial substrate in Korean coastal waters. Mar Pollut Bull 58: 278–1285.
- Shen Y, Zhang Z, Gong X, Gu M, Shi Z, et al. (1990) Modern biomonitoring techniques using freshwater microbiota. China Architecture Building Press, Beijing.
- Jiang J, Wu S, Shen Y (2007) Effects of seasonal succession and water pollution on the protozoan community structure in a eutrophic lake. Chemosphere 66: 523–532.
- Xu H, Zhang W, Jiang Y, Yang EJ (2014) Use of biofilm-dwelling ciliate communities to determine environmental quality status of coastal waters. Sci Total Environ 470: 511–518.
- Kiss ÁK, Ács É, Kiss KT, Török JK (2009) Structure and seasonal dynamics of the protozoan community (heterotrophic flagellates, ciliates, amoeboid protozoa) in the plankton of a large river (River Danube, Hungary). Eur J Protistol 45: 121–138.
- Shi X, Liu X, Liu G, Sun Z, Xu H (2012) An approach to analyzing spatial patterns of protozoan communities for assessing water quality in the Hangzhou section of Jing-Hang Grand Canal in China. Environ Sci Pollut Res 19: 739–747.
- Li Y, Liu H, Hao J, Zheng N, Cao X (2012) Trophic states of creeks and their relationship to changes in water level in Xixi National Wetland Park, China. Environ Monit Assess 184: 2433–2441.
- Wu M, Shao X, Jiang K (2008) Characteristics and Assessment on Nutrient Distribution in Water and Sediments of Xixi National Wetland Park in Hangzhou. Forest Res 21:587–591.
- Li G, Hu T, Wu J (2001) Ecological studies on zooplankton in the Xixi River, Hangzhou. Chin J Ecol 20: 29–31.
- Xu H, Warren A, Al-Rasheid KAS, Zhu M, Song W (2010) Planktonic protist communities in semi-enclosed mariculture waters: Temporal dynamics of functional groups and their responses to environmental conditions. Acta Oceanol Sin 29: 106– 115.
- Patterson DJ, Hedley S (1992) Free-living freshwater protozoa: A colour guide. Wolfe Publishing London.
- Foissner W, Berger H, Schaumberg J (1999) Identification and ecology of limnetic plankton ciliates. Bavarian State Office for Water Management Munich.
- Levine ND, Corliss JO, Cox FEG, Droux G, Grain J, et al. (1980) A newly revised classification of the protozoa. J Protozool 27: 37–58.
- APHA (1989) Standard methods for examination of water and wastewater. (17th Edn), APHA Washington DC.
- Xu H, Song W, Warren A, Al-Rasheid KAS, Al-Farraj SA, et al. (2008) Planktonic protist communities in a semi-enclosed mariculture pond: structural variation and correlation with environmental conditions. J Mar Biol Assoc UK 88: 1353–1362.
- Clarke KR, Gorley RN (2015) PRIMER 7: User manual/tutorial. PRIMER-E Ltd Plymouth.
- Xu H, Zhang W, Jiang Y, Zhu M, Al-Rasheid KAS, et al. (2011) An approach to determining the sampling effort for analyzing biofilm-dwelling ciliate colonization using an artificial substratum in coastal waters. Biofouling 27: 357–366.
- Bray JR, Curtis JT (1957) An ordination of the upland forest communities of Southern Wisconsin. Ecol Monogr 27: 325–349.
- Xu H, Zhang W, Jiang Y, Zhu M, Al-Rasheid KAS, et al. (2011) An approach to determining the sampling effort for analyzing biofilm-dwelling ciliate colonization using an artificial substratum in coastal waters. Biofouling 27: 357–366.
- Chen QH, Xu RL, Tam NFY, Cheung, SG, Shin PK (2008) Use of ciliates (Protozoa: Ciliophora) as bioindicator to assess sediment quality of two constructed mangrove sewage treatment belts in Southern China. Mar Pollut Bull 57: 689–694.
- Jiang Y, Xu H, Hu X, Zhu M, Al-Rasheid KAS, et al. (2011) An approach to analyzing spatial patterns of planktonic ciliate communities for monitoring water quality in Jiaozhou Bay, northern China. Mar Pollut Bull 62: 227–235.
- Ismael AA, Dorgham MM (2003) Ecological indices as a tool for assessing pollution in El-Dekhaila Harbour (Alexandria, Egypt). Oceanologia 45: 121–131.
- Connell JH (1978) Diversity in tropical rain forests and coral reefs. Sci New Series 199: 1302–1310.
Relevant Topics
Recommended Journals
Article Tools
Article Usage
- Total views: 7576
- [From(publication date):
January-2017 - Aug 29, 2025] - Breakdown by view type
- HTML page views : 6510
- PDF downloads : 1066