ISSN: 2165-7025
Journal of Novel Physiotherapies
Make the best use of Scientific Research and information from our 700+ peer reviewed, Open Access Journals that operates with the help of 50,000+ Editorial Board Members and esteemed reviewers and 1000+ Scientific associations in Medical, Clinical, Pharmaceutical, Engineering, Technology and Management Fields.
Meet Inspiring Speakers and Experts at our 3000+ Global Conferenceseries Events with over 600+ Conferences, 1200+ Symposiums and 1200+ Workshops on Medical, Pharma, Engineering, Science, Technology and Business

Validation of a Preoperative Risk Model for Pneumonia in Patients undergoing CABG Surgery

Hulzebos HJ1*, Buuren SV2,3, Klarenbosch JV4, Gigengack-Baars A5, Brutel de la Riviere6 and Helders PJM1 and Meeteren NLUV2
1Child Development and Exercise Center, Wilhelmina Children’s Hospital, University Medical Center Utrecht, The Netherlands
2TNO Leiden, The Netherlands
3Department of Methodology and Statistics, FSS, Utrecht University, The Netherlands
4Department of Anesthesiology, University Medical Center Utrecht, The Netherlands
5Department of Hospital Hygiene & Infection Prevention, University Medical Center Utrecht, The Netherlands
6Department of Cardio-thoracic Surgery, Onze Lieve Vrouwe Gasthuis, Amsterdam, The Netherlands
Corresponding Author : Hulzebos HJ
Child Development and Exercise Center
University Medical Center and Children’s Hospital
Room K 02.056, PO Box 85090
3508 AB Utrecht, The Netherlands
Tel: 31887554030
E-mail: h.hulzebos@umcutrecht.nl
Received July 01, 2014; Accepted August 27, 2014; Published August 29, 2014
Citation: Hulzebos HJ, Buuren SV, Klarenbosch JV, Gigengack-Baars A, Brutel de la Riviere, et al. (2014) Validation of a Preoperative Risk Model for Pneumonia in Patients undergoing CABG Surgery. J Nov Physiother 4:221. doi: 10.4172/2165-7025.1000221
Copyright: © 2014 Hulzebos HJ, et al. This is an open-access article distributed under the terms of the Creative Commons Attribution License, which permits unrestricted use, distribution, and reproduction in any medium, provided the original author and source are credited.

Visit for more related articles at Journal of Novel Physiotherapies

Abstract

Background: Postoperative pulmonary complications (PPCs) are among the most frequently reported complications of Coronary Artery Bypass Graft (CABG) surgery. However, the risk to develop a PPC is not the same for all patients. The aim of this study was to validate a previously developed preoperative six-factor pulmonary risk model (age>70 years; productive cough, smoking, diabetes mellitus, inspiratory vital capacity > 75% predicted and maximum expiratory mouth pressure>75% predicted) to predict pneumonia, in patients undergoing CABG surgery.

Methods: Prospectively collected data for 421 adult patients who had undergone elective CABG surgery, in a university medical center in the Netherlands, were used to validate the preoperative risk model for predicting pneumonia. The accuracy of the model was tested by comparing the expected and observed incidence of pneumonia in each patient.

Results: Of the 421 patients, 227 (54%) were classified as being at high pulmonary risk, 24 (11%) of whom developed pneumonia. Only 4 of the 194 (2%) patients classified as being at low pulmonary risk developed pneumonia (OR=5.6; 95%CI, 1.9 to 16.5). The sensitivity (SE) was equal to 0.86, at a specificity (SP) of 0.48, both close to the values calculated for the development sample (SE=0.87, SP=0.56). The negative predictive value (NPV) was 0.98 and the area under curve (AUC) of the receiver-operating characteristics (ROC) curve was 0.76. The model that includes only the four anamnestic risk factors (age≥ 70 year, productive cough, smoking and diabetes mellitus) had an AUC equal to 0.75, with a SE=0.75, SP=0.62, and NPV=0.97.

Conclusion: The study confirms the diagnostic accuracy of the preoperative six-factor pulmonary risk model in an independent sample. Both the six-factor and even the simple anamnestic four-factor models are accurate in identifying preoperative patients at risk of developing pneumonia undergoing CABG surgery.

Abstract

Background: Postoperative pulmonary complications (PPCs) are among the most frequently reported complications of Coronary Artery Bypass Graft (CABG) surgery. However, the risk to develop a PPC is not the same for all patients. The aim of this study was to validate a previously developed preoperative six-factor pulmonary risk model (age>70 years; productive cough, smoking, diabetes mellitus, inspiratory vital capacity > 75% predicted and maximum expiratory mouth pressure>75% predicted) to predict pneumonia, in patients undergoing CABG surgery.

Methods: Prospectively collected data for 421 adult patients who had undergone elective CABG surgery, in a university medical center in the Netherlands, were used to validate the preoperative risk model for predicting pneumonia. The accuracy of the model was tested by comparing the expected and observed incidence of pneumonia in each patient.

Results: Of the 421 patients, 227 (54%) were classified as being at high pulmonary risk, 24 (11%) of whom developed pneumonia. Only 4 of the 194 (2%) patients classified as being at low pulmonary risk developed pneumonia (OR=5.6; 95%CI, 1.9 to 16.5). The sensitivity (SE) was equal to 0.86, at a specificity (SP) of 0.48, both close to the values calculated for the development sample (SE=0.87, SP=0.56). The negative predictive value (NPV) was 0.98 and the area under curve (AUC) of the receiver-operating characteristics (ROC) curve was 0.76. The model that includes only the four anamnestic risk factors (age≥ 70 year, productive cough, smoking and diabetes mellitus) had an AUC equal to 0.75, with a SE=0.75, SP=0.62, and NPV=0.97.

Conclusion: The study confirms the diagnostic accuracy of the preoperative six-factor pulmonary risk model in an independent sample. Both the six-factor and even the simple anamnestic four-factor models are accurate in identifying preoperative patients at risk of developing pneumonia undergoing CABG surgery.

Keywords

Risk stratification; Pneumonia; CABG surgery; Physiotherapy

Introduction

Numerous studies have attempted to identify risk factors for patients undergoing cardiac surgery [1-10]. Knowing the risk is important to patients to determine whether the risk of surgery is personally acceptable to them. Surgeons need to know the patients risk factors to determine whether CABG surgery is an appropriate intervention, and to alert physicians to those patients who may need additional care or monitoring. Risk and risk scores are also of interest to quality assurance and assessment experts for comparing outcomes among providers (hospitals, surgeons) after adjusting for risk, and for providing an opportunity to assess changes in risk-adjusted outcomes for a single provider across time.

Over the last decade, several risk models, such as Parsonnet, EuroSCORE, STS, and UK Bayes, have been proposed to predict short-term mortality after accounting for differences in clinical case mix [3,5,9,11,12]. In cardiac surgery, short-term mortality is frequently used as a measure of performance [10], whereas postoperative pulmonary complications (PPCs) are recognized as being a major determinant of hospital costs and quality of life after heart surgery [13]. Consequently, there is a need for risk models that can evaluate and weigh preoperative risk factors and accurately predict which patients due to undergo CABG surgery are at risk of developing PPCs.

The aim of this study was to validate a previously developed preoperative risk model [14] designed to separate patients undergoing CABG surgery into those with a high risk and those with a low risk of developing PPCs, in particular pneumonia. Preoperative identification of patients at high risk of developing pneumonia after surgery can help clinicians to direct preoperative and postoperative interventions towards those that might benefit most.

Patients and Methods

Patients

Data were collected from patients who underwent elective CABG surgery between July 2002 and September 2005, in the Department of Cardiac Surgery, University Medical Center (UMC) Utrecht, The Netherlands. The protocol (number 02/035-E) was approved by the Institutional Review Board and Ethics Committee. Patients scheduled for primary elective CABG who had the ability to understand informed consent were eligible. Exclusion criteria were a history of cerebrovascular accident, use of immunosuppressive medication for 30 days prior to surgery, presence of a neuromuscular disorder, and a history of pulmonary surgery, cardiovascular instability, or aneurysm. Written informed consent was obtained from all participants.

On the basis of the risk model [14], the six factors were scored preoperatively to determine a patient’s risk of developing pneumonia: age ≥ 70 years and productive cough each scored 3 points, smoking and diabetes mellitus each scored 2 points, and inspiratory vital capacity (IVC) and maximum expiratory mouth pressure (Pe-max) (≥ 75%predicted) (both are protective factors) each scored -2 points. These six factors were added to yield a total risk score, ranging between -4 and 10 points. The suggested cut-off value for high risk is a score ≥-1 [14].

Data collection

Demographics and preoperative risk factors were prospectively recorded by means of a standardized interview. Age, gender, weight, height, body mass index (BMI), type of surgical procedure, current diagnoses, pulmonary status, history of smoking, history of myocardial infraction, diabetes mellitus, and spirometry and respiratory muscle testing findings were recorded preoperatively. Data obtained from medical records included duration of surgery, duration of mechanical ventilation, and perioperative complications. Included patients were closely monitored during their entire hospital stay until discharged.

A microbiologist and infection control professional , who were independent and blinded for the (high/low pulmonary risk) group allocation, collected data from the medical and clinical records, assessed bacteriology samples, and evaluated other data indicative of bronchitis and/or pneumonia, such as results of auscultation, chest X-rays, bacteriology samples, temperature curves, productive cough, hypoxemia, hypercapnia, reintubation, and ventilatory failure, according to the criteria of the Centers for Disease Control (CDC) and Prevention [15].

Pulmonary function tests

Force vital capacity (FVC), inspiratory vital capacity (IVC), and forced expiratory volume in 1 second (FEV1), were measured by spirometry (MicroLoop; PT-Medical, Leek the Netherlands). Spirometry was standardized according to the American Thoracic Society recommendations and was performed with the patient in a sitting position [16]. The value recorded was the best of three consecutive attempts. Predicted values for pulmonary function were calculated from regression equations according to age, height, and sex [17]. The accuracy of the spirometer is 2%, or 0.05 L, and the validation limits for flow are 3% or 0.07 L (operating manual). The reproducibility criterion used was that the largest FEV1 and the second largest FEV1 should not vary by more than 5% or 0.10 L. If the first three measurements did not agree within 5% of each other, three additional measurements were taken. The reproducibility of this procedure was evaluated beforehand in 10 healthy subjects. The intra-class correlation coefficient was 0.99 for FEV1, and FVC and 0.98 for IVC [18].

Respiratory muscle tests

To evaluate maximal inspiratory and expiratory respiratory strength, the maximal inspiratory and expiratory mouth pressures (Pi-max and Pe-max), were measured with a hand-held pressure gauge (RPM; PT-Medical, Leek the Netherlands). The Pi-max reflects the strength of the diaphragm, whereas the Pe-max reflects the strength of abdominal and intercostal muscles [19]. Tests of maximal respiratory strength are useful if respiratory muscle weakness is suspected to be the cause of small lung volumes, or hypoventilation [20]. Standardization of the respiratory muscle tests was carried out according to Clanton and Diaz [21]. Normal values for Pi-max and Pe-max were calculated from regression equations according to age and sex [19,22]. Five measurements were recorded, with the criterion that the two highest values did not vary by more than 10%. Since there could be some overshoot in the signal with some maximal respiratory strength instruments, we also calculated the mean of the five highest values [23]. We then compared this mean with the single highest maximal respiratory pressure value. The difference was 5 cm H2O or less for 93% of the participants, so we concluded that overshoot was minimal with the instrument, and that most of the participants could sustain their maximal pressure for at least 1.0 second. Therefore, we report the highest value obtained in 1.0 second.

PPCs

The six-factor risk model to be validated was originally developed to identify PPCs of grade 2, 3 and 4. The clinically most relevant complications fall into grades 3 and 4. In this paper we use pneumonia (both suspected and proved) as the primary outcome measure. Pneumonia is widely used in the literature, it is well defined according to internationally accepted CDC criteria [15], and it is largely responsible for other complications, like reintubation and ventilatory failure.

Four-factor model

The six-factor model as developed requires four anamnestic factors (age, productive cough, smoking, diabetes mellitus) and two measured factors (IVC, Pe-max). When it is not possible to obtain the measured factors, we consider the use of a four-factor risk score, which is exclusively based on anamnestic data. It is of practical interest to know how well the four-factor risk score performs relative to the six-factor risk score without pulmonary function test.

Statistical analysis

The data were stored in SPSS, version 18.0 (SPSS Inc., Chicago, IL, USA), checked for completeness, and obvious outliers were removed. The performance of the six-factor risk model was measured in terms of its discrimination. We calculated each patient’s predicted outcome (pneumonia) and compared this with the known patient outcome. Discrimination, which was measured using the area under the curve (AUC) at varying cut off values, captures the model’s ability to distinguish patients who developed pneumonia from patients who did not. A model with an AUC of 0.5 has no discriminative power at all (such as a coin flip), and an AUC of 1.0 reflects perfect discrimination without any false-positive and false-negative results [24].

Results

Patients

A total of 458 consecutive patients underwent first-time elective CABG surgery in the University Medical Center Utrecht, the Netherlands. Thirty-seven patients were excluded: 4 patients did not understand Dutch, 8 had undergone an emergency procedure, 16 had undergone percutaneous transluminal coronary angioplasty, and 9 patients died (5 patients died before surgery due to cardiac reasons, 3 died after surgery due to on respiratory failure as a consequence of pneumonia, and 1 died after surgery due to cardiac failure). The remaining 421 patients were available for the study, of who 28 developed pneumonia. Table 1 lists the characteristics of patients, split according to postoperative pneumonia status.

Six-factor model

Each patient’s risk score was determined using the six risk factors. Of the 421 patients, 227 (54%) were classified as being at high risk of PPCs (risk score ≥ -1). Of this group, 24 patients (11%) developed postoperative pneumonia, whereas only 4 of the 194 (2%) patients classified as being at low risk of PPCs developed pneumonia (Odds Ratio [OR]=5.6; 95% CI, 1.9 to 16.5) (Table 2). The sensitivity (SE) and specificity (SP) of the model were 0.86 (24/28) and 0.48 (190/393), respectively. The positive predictive value (PPV) was 0.11 (24/227), and the negative predictive value (NPV) was 0.98 (190/194). For comparison, the diagnostic measures in the development study14 were: 0.87 (SE), 0.56 (SP), 0.56 (PPV) and 0.87 (NPV). As expected, the SE at the suggested cut off value of ≥ -1 in the validation sample is lower, but the differences is very small (-1%). Furthermore the SP was slight increased by 8% in the validation sample. This suggests that the diagnostic performance of the six-factor model in practice is close to that estimated from the development sample. The validation study had more false-positives (from 44% to 89%), due to the stricter definition of PPC. However, this rise was accompanied by a substantial reduction in the number of false-negatives (from 13% to 2%) in the validation study.

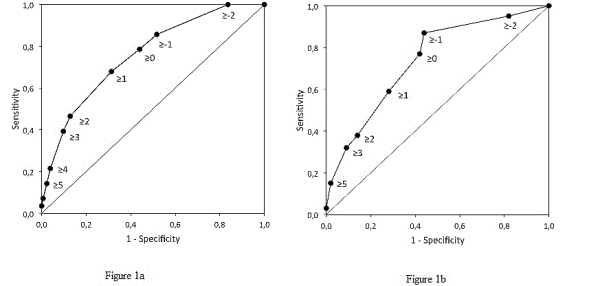
Figure 1a plots the receiver operating characteristics (ROC) curve of the six-factor clinical risk model to detect patients at risk for pneumonia. The ROC plots the SE against 1-SP at different cut off values for the risk score. For comparison, Figure 1b plots the ROC curve of the development study [14]. In general, the performance of the model is similar across both studies.

The AUC of the six-factor risk model to separate patients who developed postoperative pneumonia from those who did not was equal to 0.76 (95% CI, 0.67-0.85). The AUC calculated from the development study was 0.74 (95% CI, 0.66-0.83). Thus, the performance of the six-factor risk model to separate patients who developed postoperative pneumonia was not statistically significant different (p=0.9) between the development study [14] and the validation sample (this study).

Four-factor model

Application of the six-factor model requires patient data on all six risk factors and additional lung function and respirator muscle tests. In practice, it may be too costly, or impossible, to obtain all relevant data for some patients. Especially measurement of IVC and Pe-max could be more difficult to obtain. It is therefore of practical utility to have insight into the performance of the model that relies on only the four anamnestic factors.

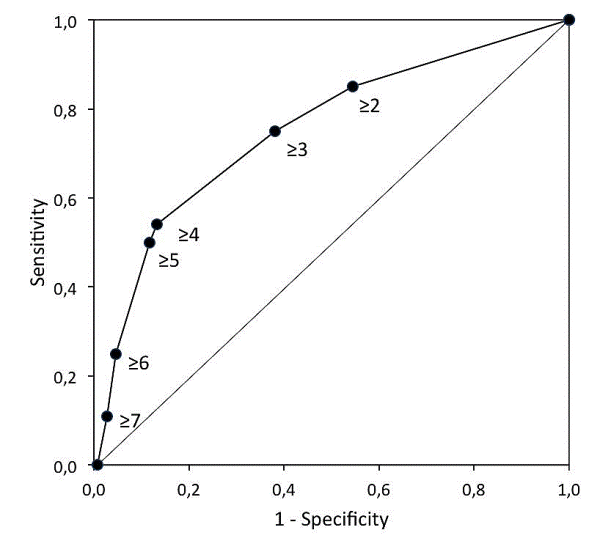
Figure 2 contains the receiver-operating characteristics (ROC) curve of the four-factor risk model. The curve indicates that the four-factor model predicted pneumonia as well as the six-factor model, and even slightly better in regions of high specificity. Since the scale ranged from 0 to 10, the cut off values were different from the score obtained in the six-factor model. The diagnostic values of the rule that classifies patient as high risk if their risk score equals or exceeds 3 were SE=0.75 (21/28), SP=0.62 (243/393), PPV=0.12 (21/171) and NPV=0.97 (243/250), (see Table 3). The AUC of the four-factor model was equal to 0.75, (95% CI, 0.65 ��? 0.82), very close to the AUC of the six-factor model. Thus simplification of the six-factor risk model to a four-factor risk model had virtually no impact on model accuracy.

Discussion

The purpose of this study was to validate a preoperative pulmonary risk model [14] that differentiates between patients with a high risk and patients with a low risk of developing PPCs, especially pneumonia, after CABG surgery. Using a model based on six factors that can be measured non-invasively, we classified 227 (53.9%) of the 421 patients as being at high risk of developing PPCs, of whom 24 (10.6%) developed pneumonia, whereas only 4 of the 194 (2.1%) patients classified as being at low risk of PPCs developed pneumonia (OR=5.62; 95% CI, 1.91 to 16.48). The AUC of the receiver-operating characteristics (ROC) curve to distinguish patients who developed postoperative pneumonia from those who did not was 0.76. This model was very accurate in identifying patients at low risk of developing pneumonia (NPV=0.98).

Simplification of the six-factor risk model to a four-factor risk model, only including the anamnestic items, had a minimum impact on model accuracy. The AUC of the four-factor model was 0.75, and its NPV was 0.97. These results suggest that the six-factor risk model can be simplified to a four-factor risk model (with age>70 year, productive coughing, smoking and diabetes mellitus as risk factors) without a loss of accuracy.

What is already known from the literature of prediction models? Mitchell et al. [25] presented a logistic model to predict PPCs that included variables such as preoperative sputum production, in combination with postoperative nasogastric intubation, and longer anesthesia duration. Although this model had an accuracy of 92% in predicting PPCs, it cannot be used for preoperative risk selection. Carrel et al. [26] found that the frequency of abnormal preoperative lung function and smoking was significantly higher in patients who developed pneumonia after cardiac surgery than in those who did not develop pneumonia. Bevelaqua et al. [27] concluded that (1) patients with severe lung impairment diagnosed before surgery generally do well after cardiac surgery but have PPCs more often than patients without this impairment, and (2) patients with restrictive pulmonary disease appear to recover faster than those with obstructive disease. Overall, preoperative pulmonary condition is a major determinant of the risk of PPCs in patients scheduled for upper abdominal and cardiac surgery. Like Bevelaqua et al. [27], we also consider preoperative screening of pulmonary function to be essential for alerting clinicians to the possible risk of PPCs, although the results of pulmonary function testing cannot, by themselves, be used to exclude patients from operation.

Several risk-scoring systems have been developed for patients undergoing cardiac surgery to predict mortality [28] and receiver operating characteristics (ROC) curves were used to describe the performance and accuracy of these scoring systems. Actual mortality was 2.9% at 30 days and 6.1% at 1 year. Discriminatory power for 30-day and 1-year mortality in cardiac surgery was highest for logistic (0.84 and 0.77) and additive (0.84 and 0.77) European System for Cardiac Operative Risk Evaluation (EuroSCORE) algorithms, followed by Cleveland Clinic (0.82 and 0.76) and Magovern (0.82 and 0.76) scoring systems. In coronary artery bypass grafting (CABG)-only surgery, EuroSCORE followed by New York State (NYS) and Cleveland Clinic risk score showed the highest discriminatory power (AUC) for 30-day and 1-year mortality varying between 0.71 and 0.84. These models are based on fairly large models containing 12-16 different risk factors. The most-often reported preoperative general and cardiac risk factors in these mortality risk models are age, female gender, diabetes, chronic pulmonary disease, previous cardiac surgery, and left ventricular ejection fraction. It may well be that these factors will also influence PPC risk. We studied only patients undergoing first time elective CABG surgery, so we could not include the risk factor previous cardiac surgery in the model. In principle however, our risk factor model could be extended with factors that are known to increase mortality risk.

A review of the literature shows that few attempts have been made to examine PPCs as endpoints in isolation [29]. Despite the relatively high prevalence of PPCs, little is known about the postoperative antecedents of PPC, which are thus excluded from models. Multivariate clinical prediction rules that incorporate antecedent patient and process factors from the continuum of cardiovascular care for specific pulmonary outcomes are recommended. Models such as the one presented here would be useful for practice, policy, and quality improvement [29].

Conclusion

In conclusion, the six-factor model retained its diagnostic accuracy in an independent sample. Both six-factor and four-factor preoperative models, without additional lung function and respirator muscle tests have satisfactory diagnostic properties. The simple models are useful as tools to predict the risk of pneumonia developing in patients undergoing elective CABG surgery. Preoperative identification of patients at high risk of developing pneumonia after surgery can help clinicians to direct their interventions toward these patients, and may reduce the incidence of pneumonia in patients undergoing CABG surgery [30].

Funding/Support

This study was funded by project grant from the Netherlands Organization for Health Research and Development (ZonMw; grant no: 1310.0004), the Rudolf Magnus Institute of Neuroscience of the University Medical Center Utrecht, the Netherlands.

Role of the Sponsor

The funding agencies and sponsors had no role in study design, data collection, data analysis, data interpretation, writing of the report, or the decision to submit the report for publication.

Acknowledgment

We thank Dr. Kalkman JC, MD, PhD (Department of Anesthesiology), Brutel de la Riviere A, MD, PhD (Department of Cardiothoracic Surgery, OLVG, Amsterdam) and Lammers JW, MD, PhD (Department of Pulmonary Diseases) for their comments and suggestions. We thank also Kim Jalink (Department of Hospital Hygiene and Infection Prevention) for their registration of nosocomial infections.

References


--

Tables and Figures at a glance

Figure Figure Figure
Table 1 Table 2 Table 3


Figures at a glance

Figure Figure
Figure 1 Figure 2
Post your comment

Share This Article

Article Usage

  • Total views: 13088
  • [From(publication date):
    September-2014 - Oct 13, 2024]
  • Breakdown by view type
  • HTML page views : 8752
  • PDF downloads : 4336
Top