Vegetation and land surface temperature relationship using MODIS data; a case study of central vegetation zone of Adamawa state, Nigeria
Received: 01-Jul-2022 / Manuscript No. jescc-22-68659 / Editor assigned: 04-Jul-2022 / PreQC No. jescc-22-68659 (PQ) / Reviewed: 18-Jul-2022 / QC No. jescc-22-68659 / Revised: 21-Jul-2022 / Manuscript No. jescc-22-68659 (R) / Accepted Date: 21-Jul-2022 / Published Date: 28-Jul-2022 DOI: 10.4172/2157-7617.1000630
Abstract
Land surface temperature and vegetation cover are two vital climatic variables that change independently of each other. Global concern over climate change has however necessitated the need to study how the change in any one of the variables affects the other. This work is aimed at assessing the spatio-temporal trend of the relationship between vegetation cover and land surface temperature, concerning the Northern Guinea Savanna vegetation zone of Adamawa state, Nigeria. Twenty years (2000 to 2019) data series of Moderate Resolution Imaging Spectroradiometer (MODIS) surface reflectance data (MOD09A1), the day time land surface temperature data (MOD11A) and the night time land surface temperature (MYOD11A1) were used to spatially compute the Normalized Difference Vegetation Index (NDVI) and day-time and night-time Land Surface Temperature (LST) for each of the respective years of the study period. Both the day-time and night-time LST were correlated with the NDVI using simple linear regression analysis. The temporal analysis of the results indicates nonlinear changes in both the NDVI, day-time LST and nighttime LST. The results also indicate a negative correlation between LST and NDVI in both cases. The day-time result gives a vegetation cover reduction of 0.0063 per kelvin change in LST with fitting coefficient R2 = 0.3026 whereas the night-time results indicate a reduction of 0.0103 vegetation cover per kelvin rise in LST with a fitting coefficient R2 = 0.3697. The relatively low coefficient of determination is considered to be a result of other intervening variables such as the variation in the land surface emissivity and the station elevation.
Keywords: Land Surface Temperature (LST); Moderate Resolution Imaging Spectroradiometer (MODIS); Normalized Difference Vegetation Index (NDVI); Northern Guinea savanna
Introduction
The evidence and impacts of global warming were documented by many authors [1-3], which is seemingly considered the major threat to humanity. It is obvious that the significant changes in climatic conditions experienced worldwide which are primarily consequence of the natural atmospheric greenhouse have a predictable effect on the climatic parameters. This is manifestly noticeable in the role of greenhouse deflation in raising the atmospheric temperature [4]. Global warming is the gradual increase in the mean atmospheric temperature associated with the increase in the amount of radiant heat energy incident and trapped in the earth's atmosphere due to the high concentration of the trapping gas molecule, the ozone. Consequences of this phenomenon include more frequent and severe weather conditions such as excessively higher atmospheric temperature, severe storms, heatwaves, floods, drought rise in sea level, more acidic rains, etc.
The phenomenon of global warming has a significant impact on the overall global ecosystem as it severely affects the interaction between living and the nonliving components of the ecosystem. Climate change obstructs the natural adaptation mechanism of biodiversity and population distribution in the ecosystem. For instance global warming influence the changes in the chemical composition of water which subsequently lead to a decrease in the oxygen content of the water [5]. Depletion of oxygen can lead to the extinction of some species. Thus the response of the biodiversity to global warming is diverse and complex. In an attempt to develop a climate model in response to the ever increased greenhouse gasses in the atmosphere, [6] observed that the CO2 absorbed by the green plant during photosynthesis and the subsequent released of O2 and water in the processes of plants' evapotranspiration cools the surrounding air, leading to the moderation of the atmosphere. Excessive CO2 however shrinks the plant’s stomata, leading to a decrease in the amount of water and O2 released by the plant and hence reduces the cooling effect. Furthermore, changes in the diffused reflection of the solar radiation (the albedo) result in increased variation in the distribution of green vegetation [7] Studies on the impact of solar radiation and surface temperature of specific leaf areas of various plants [8] indicate a complex relationship that significantly varies with the temperature range and plant type.
Being an indicator parameter of solar radiation, Land Surface Temperature (LST) is an important parameter of great influence on the effective biodiversity of an ecosystem in general and a specific indicator of the availability of the albedo for the green vegetation. It plays an important role in heat energy exchange between land surfaces and the atmosphere [9], and therefore influences vegetation cover dynamics. Studies on the correlation between the LST and vegetation index carried out by many authors [10] indicate that the relationship between the two parameters is nonlinear and site-specific due to the increase in the intensity of urban heat island. It is therefore recommended that the LST –vegetation cover relationship should be calibrated for specific local climate zone.
This paper is aimed at examining the relationship between daytime and nighttime LST, and the vegetation density of the Adamawa arm of the northern guinea savanna vegetation zone of Nigeria. The Adamawa portion of the climate zone is defined by the Benue valley which is the area’s most significant feature and transects through its center. The goals of the work are to observe the spatio-temporal trends of the vegetation cover, and the LST and to determine the level of influence of the LST on the vegetation relative to the local climate zone.
Method and Materials
Remote sensing satellite systems provide a unique opportunity for monitoring the earth’s atmospheric parameters and processes continuously on a global scale. Before the development of the remote sensing satellite system, measurements and observations of atmospheric parameters are accomplished using land-based meteorological instruments where the records are characterized by low spatial resolution, cumbersomeness in large-scale mapping, and high cost of equipment deployment. With the space-borne earth observation satellite system, a wide range of atmospheric parameters can be monitored continuously at a regular interval of time on a global scale. This leads to an enhanced understanding of the earth’s atmospheric processes and dynamics. Various satellite platforms and sensors provide data in different spatial and temporal resolutions. Taking into cognizance the size of the study area and the temporal resolution requirement, Moderate Resolution Imaging Spectroradiometer (MODIS) data was used for both the LST retrieval and the green vegetation mapping.
Study Area
The study covered a central portion of Adamawa state, northeastern Nigeria, defined by one of the three classes of the vegetation belts of the state, the Northern Guinea Savanna. It is geographically located between latitudes 8o49’48” N - 9o57’09” N and longitudes 11o11’17” E – 13o20’51” E. (Figure 1). The vegetation of Adamawa state of Nigeria is roughly classified into three major zones: the Northern Guinea Savanna, the Southern Guinea Savanna, and the Sudan Savanna. The study area is limited to the Northern Guinea Savanna region, which constitutes the largest landmass in the state. The area is centrally located and follows the trends of the Benue River. The vegetation of the area is therefore defined by the Benue valley characterized by the combination of thick trees, open grassland, and the fringes of forest along the river valleys. The region is a beehive of agricultural activities, especially in areas close to settlements, a factor that is likely to influence the magnitude of the vegetation cover. The Adamawa segment of the Northern Guinea savanna vegetation is characterized by the mean annual rainfall of 900-1100 mm and a rainy season that lasts for about 4-5 months. The area is moderately vegetated with a wide variety of species ranging from woody to grasses.
Data Acquisition and Interpretation
MODIS is a satellite-based remote sensor used for observation of the earth and climate parameters. The sensors are aboard the Terra and Aqua satellites. It is described as a significant tool for global studies of atmosphere, land, and ocean processes. MODIS scans the earth's surface from nadir in 36 bands. Bands 1-19 and band 26 correspond to the visible and near-infrared range while the remaining bands correspond to the thermal infrared (3-15 mμ). However, only seven MODIS emissive bands are useful for land surface remote sensing (Wan, 2014). The improved version (version 6) of MODIS produces data consisting of surface reflectance (MOD09A1), day–time land surface temperature (MOD11A2), and the night-time land surface temperature MYOD11A2. MOD09A1 is a product that provides a spatial estimate of the surface spectral reflectance with sufficient spatial and temporal resolution to map spatial variation in vegetation density with reasonable accuracy. The sensor records 8-day surface reflectance at a spatial resolution of 500 m in seven bands (MODIS Bands 1 to 7). The level three (L3) products used for this study were atmospherically corrected for cloud cover and aerosol. Table 1 gives a list of the seven reflectance bands and their bandwidth description.
| Bandwidth(nm) | Band description | |
|---|---|---|
| Band 1 | 630 - 670 | Shortwave/VIS |
| Band 2 | 841 – 876 | Shortwave/NIR |
| Band 3 | 459 – 876 | Shortwave/VIS |
| Band 4 | 545 - 565 | Shortwave/VIS |
| Band 5 | 1230 - -1250 | Shortwave/NIR |
| Band 6 | 1628 - 1652 | Shortwave Infrared/SWIR |
| Band 7 | 2105 - 2155 | Shortwave Infrared/SWIR |
Table 1: The 7 bands of MOD09A1surface reflectance.
MOD11A1 and MYOD11A1 (day and night-time respectively) are two standard daily LST products generated from the products of the sensor radiance data, the geolocation product, the atmospheric temperature, water profile, cloud mask, and the land cover. The LST product is generated using the generalized split-window algorithm. The two provide per pixel daily records of the day–time and night-time land surface temperatures in kelvin at a spatial resolution of 1 km with a scale factor of 0.02. The LST band pixel values are therefore converted into LST in 0C by multiplying the pixel values with the scale factor of 0.02 and subtracting 273.15 from the result.
The Normalized Difference Vegetation Index (NDVI) is a sufficiently good indicator of vegetation density and greenness of land surface because of its ability to optimally discriminate between the chlorophyll-absorbed visible red light and the reflected near-infrared light. The photosynthesis activity associated with a healthy plant of dense vegetation will result in minimal reflectance in the red band and high reflectance in the near-infrared band. Thus comparative analysis of the reflectance spectra could lead to a reliable detection and spatial mapping of the vegetation cover. The vegetation density was computed in this case using the NDVI. Using the MODIS MOD09A dataset, NDVI is computed as the ratio of the reflectance in the near-infrared NIR band ![]() to the reflectance in the red band
to the reflectance in the red band ![]() . That is
. That is
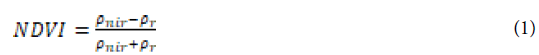
From table 1, it can be observed that the NIR band corresponds to band 1 (630 – 670 nm) while the red band corresponds to band 2 (841 – 876 nm). Thus NDVI computation is accomplished by computing the ratio

Both MOD09A1, MOD11A1, and MYOD11A1 products were downloaded from the NASA earth data home page (https://search. earthdata.nasa.gov). We downloaded the sets of data acquired within the first two weeks of December for the years 2000 to 2019 and used to compute the LST and the correspondent NDVI. We compared the computed LST and NDVI using a cross-validation technique [19] for each of the two correspondent images.
Results
Both the computed LST and the vegetation index according to this study indicate significant nonlinear variation with time at least within the relatively short period of the study. Figure 1 are maps of the spatial variation of the daytime LST for the years 2000, 2005, 2009, 2013, 2017 and 2018. The maps indicate significant variation in LST. It is however observed that there is consistency in the magnitude of variation of the LST with the spatial location for all the years. This can be understood based on the variability of the emissivity values of the different permanent land cover types. The day-time LST for the twenty-year study period ranges from a minimum value of 31.790C (which occur in 2015) to a maximum value of 37.710C (which occur in 2001). This indicates nonlinear changes in the surface temperature with time. As expected, the night-time LST is comparatively lower in magnitude compared to the day-time LST. Figure 2 depicts the plots of the spatial distribution of the night-time LST, serially arranged for the selected 6 years within the study period. It varies from a minimum value of 17.11°C (2006) to a maximum value of 200C (2013). Careful observation of the figure indicates that the night-time LST is more spatially consistent compared to the day-time LST.
The vegetation index of the study area for the period was estimated using equation (2). Figure 3 is the plots of the NDVI map, depicting the spatial distribution of the vegetation cover for some selected 6 years within the study period. The figure indicates erratic changes in the vegetation cover of the area which indicates significant changes in the vegetation density over time. Statistical distribution of both the day and night time LST as well as the NDVI indicate a nonlinear variation of the three parameters on a time scale. Figure 4-6 are respectively the boxplots of the statistical distribution of the three parameters. The plots give a pictographic view of the observed inter annual variability of the three parameters within the study area. The nonlinear variability may not be unconnected with the high level of human activities within the area which tends to affect the land cover type at different times. From the spatial distribution of NDVI map (Figure 4), it is observed that the marshy areas within the banks of the Benue and its distributaries are consistently characterized by vegetation density in contrast with the built-ups and rocky upland areas.

Figure 1: Day-time Land Surface Temperature of the study area for the years 2000, 2005, 2009, 2013, 2017 and 2018.

Figure 2: Night-time Land Surface Temperature of the study area for the years 2000, 2005, 2009, 2013, 2017 and 2018.

Figure 3: NDVI maps of the study area for the years 2000, 2005, 2009, 2013, 2017 and 2018.

Figure 4: Boxplot of the distribution of day-time LST.
Observation of Figures 5 and 6 shows that LST peaks were recorded for both daytime and nighttime in the year 2001. The high values of LST are good demonstration of how factors such as heat waves can affect the temporal distribution of the surface temperature. The occurrence of intermitted drought on the other hand could be responsible for the temporal variability of NDVI as shown in Figure 7 where low records were observed in 2016 and 2017.
We used regression analysis to observe the pattern of the interrelationship between the daytime LST and the NDVI on one hand and the night-time LST and the NDVI on the other hand. The analysis is done based on per-pixel correlation to analyze the relationship in the spatial rather than temporal domain. Corresponding pixels from two images were randomly sampled using create random point functions of the Arc Toolbox in ArcGIS. The raster images are converted from float to integer type and the pixel values at the sampled points were extracted in each of the images. The corresponding DN of the sampled pixels were compared based on statistical metrics by computing the coefficient of determination R2 and the Root Mean Square Error RMSE respectively. Figure 7 shows the plots of the daytime and nighttime LST with the NDVI respectively. The regression equations in each case indicate a negative slope, which means a negative correlation or inverse relationship between LST and the vegetation indices. This implies that an increase in land surface temperature has a negative effect on the vegetation cover. The plot of the variation of the mean NDVI with day-time LST gives a negative slope of -0.0063. This indicates an NDVI reduction of 0.0063 per kelvin change in land surface temperature. The figure is significantly higher than the NDVI variation with night-time temperature where a slope of -0.0103 is recorded, indicating a reduction of 0.0103 vegetation cover per kelvin change in night-time temperature. The night-time changes also record a higher value of the coefficient of determination (R2 = 0.3697) which implies that the response of the vegetation density to night-time LST is more significant and consistent than that of the day-time LST (R2 = 0.3026).

Figure 5: Boxplot of the distribution of night-time LST.

Figure 6: Boxplot of the distribution of NDVI.

Figure 7: Plots of the correlation between LST and NDVI.
Discussion
The findings of this study demonstrate the fact that a time series analysis of the 20 –the year day and night time LST-NDVI relationship for the study area showed a higher daytime surface temperature than the night-time, obviously due to the influence of solar insolation. A decrease in the trend of the vegetation cover with surface temperature was recorded for both daytime and night–time. The spatial distribution of LST and NDVI values obtained from the maps indicates the abundance of vegetation cover along the Benue valleys and its tributaries (Figure 4). This correspondingly coincides with the low values of surface temperature for both day and night time (Figure 2-3). This same trend was observed by many authors in different regions of the world [10]. It is observed based on the study that there is a nonlinear trend in the relationship between LST and the degree of vegetation density. The nonlinear trend in the relationship between LST and the vegetation cover suggests the influence of land-use changes such as urbanization and the variation in the level of agricultural activities in the area. Conversely, lover vegetated areas within the north-central and the central portion of the study area correspond to higher values of land surface temperatures. This is however not a perfect inverse relationship as shown in the correlation analysis plot. This could be attributed to a lot of intervening factors such as the land cover type and elevation of the geographic location.
Based on the degree of changes in both the LST and NDVI with time, it can be observed that LST varies with the different land cover types due to variation in optical properties (emissivities) of the different land covers. Since no land cover type is homogeneous, the LST also differs for different parts of each land cover. Vegetation could serve as a cooling mechanism which will reduce heat flux through shading and evapotranspiration. Vegetation shading in the area decreases the penetration of the sunlight intensity into the soil which helps in cooling the land surface. Hence lower LST is recorded in the highly vegetated areas. Conversely, convection and free air floor are higher in low vegetation density regions. This tends to reduce the LST. Though the impact of this factor depends on the topography of the area, it is considered one of the factors responsible for the low value of the coefficient of determination. It can however be concluded based on the foregoing that the availability of vegetation cover is one of the major factors that control the land surface temperature in the area which in turn, influence the ambient temperature of the environment.
Conclusion
In this paper, a 20-year time series analysis of NDVI and day and night time LST were accomplished to evaluate the spatio-temporal relationship between land surface temperature and vegetation density. The study is restricted to the Adamawa state portion of the Northern Guinea Savanna vegetation belt, northeastern Nigeria. The results indicate a nonlinear temporal trend of variations in both the day and night-time LST and the NDVI. It is also observed that both the day and night-time LST decrease with an increase in vegetation density with the night–time data having a greater coefficient of reliability. The low level of fitting coefficients recorded in both the day-time and the night-time data is attributed to some climatological factors other than vegetation cover that affect ambient temperature and consequently influence LST. The work, therefore, demonstrates the fact that land surface temperature is affected by many factors other than vegetation density, including station altitude, land cover type, surface moisture content, etc. the work also demonstrates the capability of MODIS data in modeling and analysis of climatological data.
References
- Jin M, Dickinson R (2002) New observational evidence for global warming from satellite. Geophys Res Lett 29(10):39-1-39-4.
- Aptroot A, Van-Herk C (2007) Further evidence of the effects of global warming on lichens, particularly those with Trentepohlia phycobionts. Environ Pollut 146(2):293-298.
- D’agostino R, Lionello P (2007) Evidence of global warming impact on the evolution of the Hadley Circulation in ECMWF centennial reanalyses. Clim Dyn 48:3047-3060.
- Bolaji BO, Huan Z (2013) Ozone depletion and global warming: Case for the use of natural refrigerant - a review. Renew Sustain Energy Rev 18:49-54.
- Rogora M, Buzzi F, Dresti C, Leoni B, Lepori F, et al. (2018) Climatic effects on vertical mixing and deep-water oxygen content in the subalpine lakes in Italy. Hydrobiologia 824:33-50.
- Dusenge ME, Duarte AG, Way DA (2019) Plant carbon metabolism and climate change: elevated CO2 and temperature impacts on photosynthesis, photorespiration and respiration. New Phytol 221:32-49.
- Durand M, Murchie E, Lindfors A (2021) Diffuse solar radiation and canopy photosynthesis in a changing environment. Agric For Meteorol 311:108-684.
- Rosbakh S, Romermann C, Poschlod P (2015) Specific leaf area correlates with temperature: new evidence of trait variation at the population, species and community levels. Alp Botany 125:79-86.
- Haghighi E, Gianotti S, Akbar R (2018) Soil and atmospheric controls on the land surface energy balance: A generalized framework for distinguishing moisture-limited and energy-limited evaporation regimes. Water Resour Res 54:1831-1851.
- Guha S, Govil H (2021) An assessment on the relationship between land surface temperature and normalized difference vegetation index. Environ Dev Sustain 23:1944-1963.
Indexed at, Google Scholar, Crossref
Indexed at, Google Scholar, Crossref
Indexed at, Google Scholar, Crossref
Indexed at, Google Scholar, Crossref
Indexed at, Google Scholar, Crossref
Indexed at, Google Scholar, Crossref
Indexed at, Google Scholar, Crossref
Indexed at, Google Scholar, Crossref
Indexed at, Google Scholar, Crossref
Citation: Idi BY, Abubakar IM (2022) Vegetation and land surface temperature relationship using MODIS data; a case study of central vegetation zone of Adamawa state, Nigeria. J Earth Sci Clim Change, 13: 630. DOI: 10.4172/2157-7617.1000630
Copyright: © 2022 Idi BY, et al. This is an open-access article distributed under the terms of the Creative Commons Attribution License, which permits unrestricted use, distribution, and reproduction in any medium, provided the original author and source are credited.
Select your language of interest to view the total content in your interested language
Share This Article
Recommended Journals
Open Access Journals
Article Tools
Article Usage
- Total views: 3682
- [From(publication date): 0-2022 - Dec 07, 2025]
- Breakdown by view type
- HTML page views: 3169
- PDF downloads: 513