Simulation and Modelization of Parabolic Solar Concentrator
Received: 03-Jul-2012 / Accepted Date: 19-Jul-2012 / Published Date: 21-Jul-2012 DOI: 10.4172/2157-7617.1000113
Abstract
Solar energy is the source of the most promising energy and the powerful one among renewable energies. Photovoltaic electricity (statement) is obtained by direct transformation of the sunlight into electricity, by means of cells statement. Greenius is a powerful simulation environment for the calculation and analysis of renewable power projects such as solar thermal trough power plants, photovoltaic systems, wind parks or Dish/Stirling systems. In this work, we simulated the operation of the concentrator dish Stirling, this simulation allowed us correctly to predict the influence of the meteorological parameters (direct normal isolation, ambient temperature, air density (altitude), the angle elevation of the sun, and wind speed) on the system performance and the net power produced.
Keywords: Simulation; Modelization; Parabolic; Solar; Concentrator
5514Introduction
The Dish Stirling systems have demonstrated the highest efficiency of any solar power generation system by converting nearly 31.25% [1] of direct normal incident solar radiation into electricity after accounting for parasitic power losses. Therefore, the Dish Stirling technology is anticipated to surpass parabolic troughs by producing power at more economical rates and higher efficiencies. Because the Dish Stirling systems are modular; each system is a self-contained power generator, they can be assembled into plants ranging in size from a kilo-watts to 10 MW [2]. These systems can also be combined with natural gas and the resulting hybrid provides continuous power generation like other conventional solar energy systems [3]. Dish Stirling systems are applicable in the regions having high level of Direct Normal Irradiance; the so-called Sun Belt area which includes: the Northern Africa (where Algeria is located), Mexico, Southwest of USA, Australia, MENA region.
The synthesis of theoretical reflections vary thoroughly on the use of the methods of Monte Carlo in radioactive transfers [4]. The scopes of application considered were very vast [5,6].
Stirling dish systems have not been researched as extensively as other solar technologies such as photovoltaic or solar hot water heaters, and literature on these systems is difficult to find and rarely organized in one cohesive report. Data on the performance of Stirling dish systems have typically not been accessible to the public, and few Stirling dish systems have been constructed to date. Despite these limitations, data were obtained from Sandia National Laboratory for the WGA Mod 2-2 Stirling dish system in order to validate models of Stirling dish power systems developed during the course of the present study.
Model Equations
Our software of simulation Greenius is based on the following mathematical model:
The gross electrical performance is given by the equation (1) [7]:
Pgros= 
Where Ecor is the corrected irradiance in W/m2, EDNI is the direct normal irradiance in W/m2 and EDNI, min is the minimal direct normal irradiance for starting generation in W/m2.
The coefficients of the gross power are:
a is performance model constant in We /(W/m2) and b is the performance model constant in We. So the corrected irradiance is given by :Ecor=EDNI . fref . ftemp, and the correction factors are :
ftemp: the temperature correction factor and fref: the reflection correction factor.
The expression of the reflection correction factor is given by the equation (2):
fref= fshadowing . fintercept (2)
Where fshadowing is the shadowing and blockage factor and fintercept is the intercept factor.
The temperature correction factor is shown in this equation (3):
Ftemp= 
Then ϑnorm,amb is the normalized temperature for performance model in °c and ϑamb is the actual ambient temperature.
or ϑup,Stiriling is the upper Stirling temperature in °c and the Ccooler is the cooler constant in °c / (W/m2) .
Results and Discussions
The data used in this model included the sun elevation angle, cooling water inlet/outlet temperatures, engine pressure, 100 expansion space temperatures (heater head temperature), net power, wind speed, ambient temperature, direct normal isolation, and the average receiver temperature. Plots of key measured data were generated for a clear day (4/26/2009) to better understand the factors influencing the Stirling dish system performance. Two days of data from the summer (7/24/09), and winter (1/13/09) were used to obtain the dish Stirling system used in the Stirling cycle component model. The component model was then compared with experimental data that were not used to establish the efficiency curves. Results of the comparisons are provided for in the “Results Analysis: Comparison of Component Models to Data” section below.
A plot of the gross power versus insolation illustrates the transients in performance during the morning and evening as shown in Figure 1. The Stirling dish systems tend to perform worse in the morning due to the thermal capacitance of the receiver walls and absorber requiring energy to obtain a steady state heater head temperature. Figure 1 also indicates data influenced by shading in the morning resulting from mountains to the east, which eliminates most of the data points at lower insolation values [8]. The effective shading of the mountains results in a curve fit of the data slightly over-predicting the system performance during the morning since the data points recorded at insolation values below approximately 400 W/m2 all occur in the evening when the performance is greater. The net effect on the data due to the mountains is expected to be minimal.
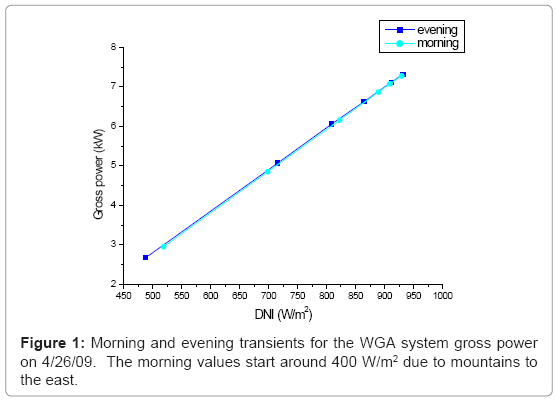
Figure 1: Morning and evening transients for the WGA system gross power on 4/26/09. The morning values start around 400 W/m2 due to mountains to the east.
The gross power versus direct normal insolation data were plotted for two days of data in Figures 2 and 3. The figure shows lower performance during start-up during colder temperatures, but this could also be affected by the location the sun rises over the eastern mountains during different times of the year. The data does indicate higher performance once the system has been running at lower ambient temperatures.
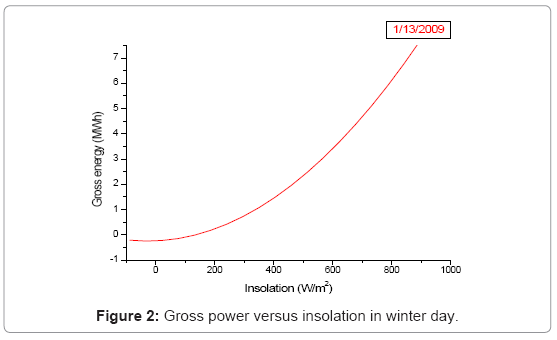
Figure 2: Gross power versus insolation in winter day.
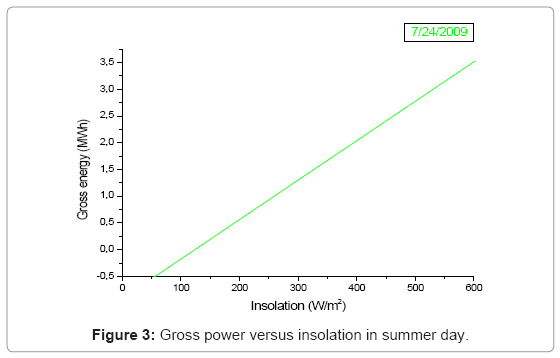
Figure 3: Gross power versus insolation in summer day.
At lower ambient temperatures, the receiver losses are also greater, so the net power versus direct normal insolation will not be as high at colder temperatures in comparison to the efficiency curves.
Large parasitic power loads resulted in large negative values for the net power. The data included the net power (Figures 4-6 at different isolations), but not the gross power, so data with negative net power values were filtered out in order to obtain better values for the performance prediction simulations. The parasitic power can become greater than 1.0 kW early in the morning or evening due to starting the engine and the collector leaving or entering the stow position. The additional large parasitic power loads throughout the day most likely resulted from system faults or cloud conditions requiring the engine to shutdown and restart. These data were filtered.
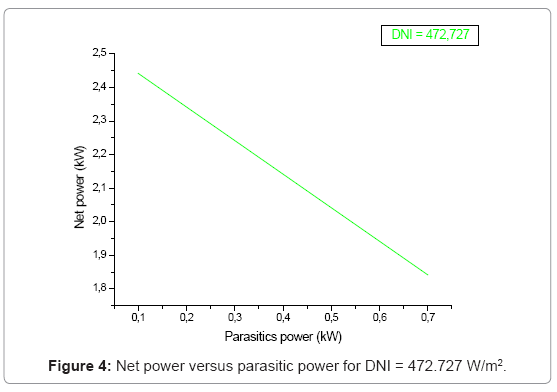
Figure 4: Net power versus parasitic power for DNI=472.727 W/m2.
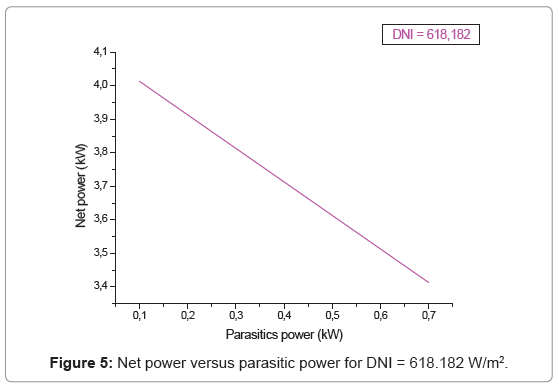
Figure 5: Net power versus parasitic power for DNI = 618.182 W/m2.
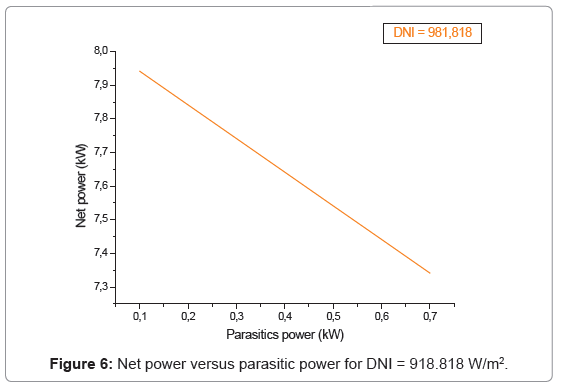
Figure 6: Net power versus parasitic power for DNI = 918.818 W/m2.
Conclusion
A computational model was created and used to investigate the effects of system design parameters for a Stirling dish system. The model, implemented in Greenius, can be used to predict the variation of the net energy production in a specific location using input weather data files. The model is expected to have greater accuracy predicting the system performance in different locations due to the additional properties of the wind velocity, sun elevation angle, and altitude. This model ideally will be used by designers to optimize design parameters and by researchers or utilities to obtain a better representation of a Stirling dish systems location specific performance.
References
- Taggart S (2008) CSP: dish projects inch forward. Renawable Energy Focus 9: 52-4.
- Mancini T, Heller P, Butler B, Osborn B, Schiel W, et al. (2003) Dish Stirling system. An overview of development and status. J Sol Energy Eng 125: 135-151.
- Ab Kadir MZA, Rafeeu Y, Adam NM (2010) Prospective scenarios for the full solar energy development in Malaysia. Renewable and Sustainable Energy Reviews, 14: 3023-3031.
- Schawarzböl P, Buck R, Sugarmen C, Ring A, Jesus Marcos Crespo M, et al. (2006) Solar gas turbine systems: design, cost and perspectives. Sol Energy 80: 1231- 1240.
- Shuai Y, Xia XL,Tan HP (2008) Radiation performance of dish solar concentrator/cavity receiver systems. Sol Energy 82: 13-21.
- Villafan-Vidales HI, Arancibia-Bulnesa CA, Dehesa-Carrascoa U, Romero-Paredes H (2009) Monte Carlo radiative transfer simulation of a cavity solar reactor for the reduction of cerium oxide. Int J Hydrogen Energy 34: 115-124.
- Institut für Thermodynamik und Wärmetechnik Universität Stuttgart (ITW): Freigegebene Testberichte zur Solarkollektoren. ITW : Stuttgart 2005.
- Andraka CE (2007) Alignment Strategy Optimization Method for Dish Stirling Faceted Concentrators. Energy Sustainability Conference, Long Beach, CA.
Citation: Kaddour A, Benyoucef B (2012) Simulation and Modelization of Parabolic Solar Concentrator. J Earth Sci Climate Change 3: 113. DOI: 10.4172/2157-7617.1000113
Copyright: ©2012 Kaddour A, et al. This is an open-access article distributed under the terms of the Creative Commons Attribution License, which permits unrestricted use, distribution, and reproduction in any medium, provided the original author and source are credited.
Select your language of interest to view the total content in your interested language
Share This Article
Recommended Journals
Open Access Journals
Article Tools
Article Usage
- Total views: 15497
- [From(publication date): 7-2012 - Dec 19, 2025]
- Breakdown by view type
- HTML page views: 10575
- PDF downloads: 4922