Summer Monsoon Rainfall over Nepal Related with Large-Scale Atmospheric Circulations
Received: 29-Feb-2012 / Accepted Date: 15-Jun-2012 / Published Date: 18-Jun-2012 DOI: 10.4172/2157-7617.1000112
Abstract
Summer monsoon rainfall variability from June to September over Nepal (SMRN) was statistically investigated with a focus on the large-scale atmospheric patterns such as El Niño-Southern Oscillation (ENSO) and Indian Ocean Dipole (IOD), as well as examination of moisture fluxes toward Nepal. A main large-scale pattern influential on the SMRN variability was explained by ENSO as a significant correlation with Southern Oscillation Index (SOI): i.e., when La Niña occurs, the eastward moisture flux is blocked over Bay of Bengal (BOB) by the anomalous circulation extending from the Pacific. The local-scale condition for higher SMRN is implied by two moisture routes, a main one of which is moisture carried along the eastern arm of the low pressure in northeastern India. A minor one is the route from the Arabian Sea (AS). This aspect was proved by a correlation between SMRN anomalies and the moisture fluxes. As implied by a high cloud core over northern India, moisture accumulates and tends to flow toward Nepal producing high SMRN. The significant correlation between SMRN and moisture in June suggested that an early onset of monsoon is an additional indication of high SMRN. Since the correlation between SMRN and moisture fluxes was not as high as that between SMRN and SOI, the additional cause has to be sought, this could be related with local re-evaporation.
Keywords: SMRN; IOD; SOI; Moisture flux
5490Introduction
The climate of Nepal is dominated by the monsoon circulation system: i.e., southeasterly from June to September, which gives around 80% of the annual precipitation. Summer monsoon generally arrives in early June, is characterized by violent lightning and thunderstorms, and lasts through September. The geopotential in summer is low around Indian plains and Nepal. The wind that flows northwestward from the head of BOB transports moisture to the Nepal region. The meridional wind component is dominant over the zonal wind component near the southern edge of Nepal. The influence of summer circulation patterns is unequally distributed over the Nepal Himalaya, with greater rainfall in the central-eastern part and less in the northwestern part (Figure 1). It is important to understand large-scale connections in precipitation around Nepal from a scientific perspective as well as socio-economic aspects such as flood damages.
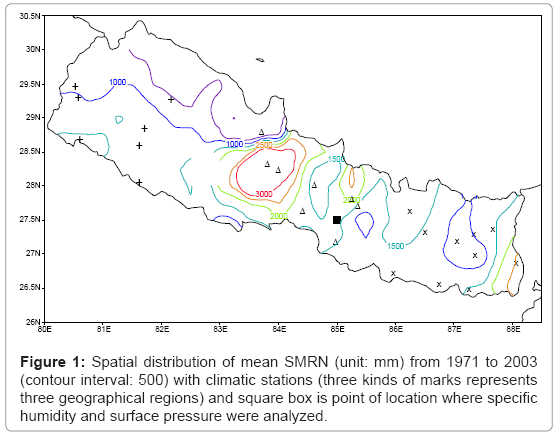
Figure 1: Spatial distribution of mean SMRN (unit: mm) from 1971 to 2003 (contour interval: 500) with climatic stations (three kinds of marks represents three geographical regions) and square box is point of location where specific humidity and surface pressure were analyzed.
ENSO has been widely accepted as an important player in the tropical climate variability. Its influence on South Asian precipitation is exerted through the variability in the Walker and Hadley circulation cells [1]. We use a representative index, SOI, which measures a large-scale fluctuation in sea level pressure between La Niña and El Niño. However, the tropical climate variability did not necessarily synchronize with ENSO recently, and some scientists have raised concerns about the changes in the frequency and intensity of ENSO over the last few decades.
Kumar et al. [2] suggested that the link of monsoon with ENSO had weakened in the recent two decades and also that an increase in surface temperatures over Eurasia favoured a stronger monsoon and hence reduced responses to El Niño in the 1990s. Yang et al. [3] studied Indian Ocean Basin Mode (IBM) SST variability and suggested that Indian Ocean warming is not just a passive response to El Nino but active and important for summer climate variability in the Indo-west Pacific region. Ashok et al. [4] proposed that the event of no drought over India, despite of the strongest El Niño in the century, is explained by the positive phase of IOD. This newly found climate index, Dipole Mode Index (DMI) has a high correlation with precipitation in the equatorial Indian Ocean. However, we have yet to examine any impact of ENSO and IOD on the summer climate in Nepal.
As local phenomena, monsoon depressions develop over BOB and spread over India [5]. It is widely known that heavy rainfall is induced by the depressions. However, it was suggested for India that interannual variability of monsoon rainfall may not be related with the depressions [6].
Studies with a focus on Summer Monsoon (June-to-September, JJAS) Rainfall variability over Nepal (hereafter SMRN) are rather limited. The role of atmospheric parameters on summer monsoon variability has not been fully explored. No study has been carried out to analyze monsoon circulation patterns and moisture flux that influence SMRN variability, although a few authors were concerned with precipitation variability over Nepal [7,8].
A main objective of this paper is to examine which climate index is more influential on SMRN variability and to know the circulation pattern that induces the SMRN variability. In data, we introduce data. Starting with the large-scale phenomena, we present the results of relation between SMRN and large-scale indices in Relationship with large-scale climate patterns, and then, between SMRN and atmospheric components around BOB and on the AS side in Moisture fluxes from BOB and AS. We examine a role of the monsoon onset and document a rare case of high SMRN in Synoptic processes and monsoon onset. In Summary and discussion, discussion and summary are addressed.
Data
In this study, we used observed rainfall data over Nepal along with atmospheric reanalysis data and climate indices. The rainfall data include the rain gauge data provided by the Nepal Government’s Department of Hydrology and Meteorology at stations in Figure 1. Monthly mean rainfall data from 26 observatories for summer monsoon (JJAS) started in 1971 for 33 years. The stations were selected on the basis that they have no period of missing data. The data were examined carefully so that the removal of a couple of stations may not change interannual variability.
SMRN is derived by averaging the summer monsoon precipitation anomalies over these stations. As Nepal is a mountainous country hills and middle mountains (nearly 1500 m) are located from east to west occupying most of the land. Locations facing the upwind side are struck by southeasterly convective systems, which give high amount of rainfall at the foot hills and middle mountains compared with stations at the downwind side of the same region. The stations in the northwestern region have generally less amounts of rainfall compared with the central and eastern regions (Figure 1). A few stations with high precipitation exist in the hilly area of the central region. In addition, the eastern end is connected to a high rainfall belt extending from Northeast India and Bangladesh.
Daily reanalysis data of winds, specific humidity and geopotential height at 2.5º × 2.5º resolution were provided by the National Center for Environmental Prediction/National Center for Atmospheric Research (NCEP/NCAR) [9]. Monthly Sea Surface Temperature (SST) provided by Global sea ice coverage and sea surface temperature (GISST) was analyzed with the atmospheric data, and monthly SOI from Climate Prediction Center, National Oceanic and Atmospheric Administration (CPC/NOAA). DMI for the same period was taken from Japan Marine Science and Technology Center (JAMSTEC, http://www.jamstec. go.jp).
CPC Merged Analysis of Precipitation (CMAP) data for summer monsoon season (1979-2003) were compared with rain gauge data. We found that CMAP monthly precipitation is nearly half of rain gauge precipitation of SMRN (figure not shown). The inter annual variations also showed low correlation between them. CMAP precipitation is not representative for a local feature such as Nepal, and hence, we analyzed the rain gauge data as a more representative source for our analysis.
Relationship with Large-Scale Climate Patterns
The relation between SMRN variability and the large-scale atmospheric indices was examined. Here, the seasonal averaged values in summer months (JJAS) were used for the correlations among SMRN, the indices and wind patterns. During the period of 33 years, 20 years show a relationship with same signs between ENSO (measured by SOI) and SMRN in Figure 2. The correlation coefficient (CC) between them is 0.52, which is above the 99-percent confidence level. In the low phase of SOI (<-0.5), the average deficit of SMRN is 8.1%, while the average excess is 7.5% in the high phase with SOI>0.5. The CC is -0.28 between SMRN and IOD (by DMI) (Figure 2), whereas we should note that the CC is -0.59 between SOI and DMI. The relationship of IBM Index, SST variability over Indian Ocean (40−110°E, 20°S−20°N), with SMRN is weak with the CC of 0.15.
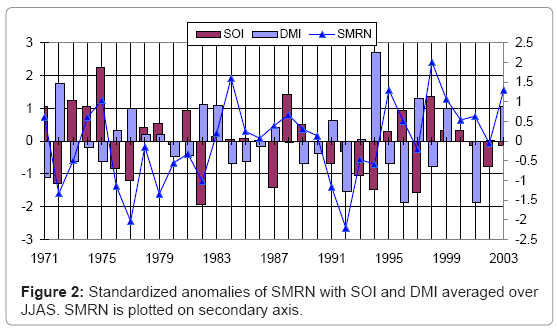
Figure 2: Standardized anomalies of SMRN with SOI and DMI averaged over JJAS. SMRN is plotted on secondary axis.
From these simple analyses, we might think that SMRN are controlled by ENSO and also by IOD to a lesser extent. However, ENSO and IOD are dependent on each other, and the further regression analysis was conceded [10]. The first case is that ENSO is considered as an independent variable, and SMRN and IOD are treated as dependent variables. The components of SMRN and IOD regressed on ENSO are removed, and the CC is calculated between their residuals. The result from this analysis shows an extremely low CC (0.03) between the residuals of SMRN and IOD. Similarly for the other case, when IOD is considered as an independent variable, the residuals of SMRN and ENSO have a high CC (0.46). From these analyses, we can finally conclude that SMRN is related with ENSO, but not with IOD. Hence, the SMRN component which is not explained by ENSO has no relationship with IOD.
The regressed SST anomalies on SMRN possess a pattern quite similar to those associated with ENSO (figure not shown): i.e., a positive anomaly spreads around Indonesia and the western tropical Pacific. It is noted that only a much weaker anomaly is observed in the BOB, suggesting that the SST there is not related with SMRN.
The wind pattern regressed on ENSO was produced in Figure 3 and fundamentally similar to the moisture flux regressed on SMRN in Figure 4, which is well expected from the positive correlation between SMRN and ENSO. In Figure 3 a wind anomaly is clearly northwestward from Bangladesh to Nepal as the eastern part of a cyclonic rotation over eastern India and south of BOB. This circulation system is originated with easterly winds around 15°N near Indonesia, which is resulted by a westward flow from the equatorial Pacific. The mean pattern clearly possesses westerly winds, being reduced under influences of the stronger easterly circulation in the Pacific during La Niña. Thus, the crucial feature is the easterly wind anomaly around 15°N. The zonal moisture convergence clearly shows up around 15°N in Figure 4 and was released northward partially. Moisture tends to increase over India and BOB, and could be partially transported northward over the northern BOB to Bangladesh and Nepal.
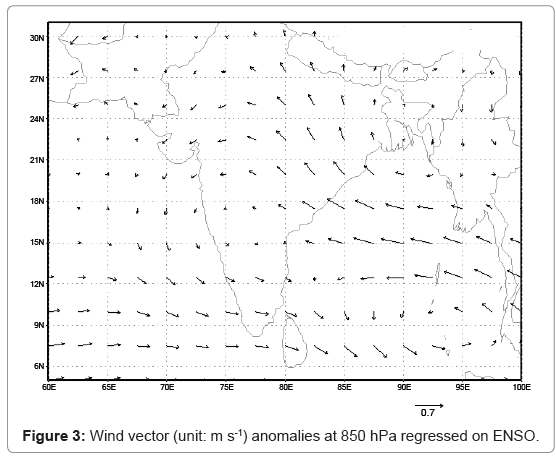
Figure 3: Wind vector (unit: m s-1) anomalies at 850 hPa regressed on ENSO.
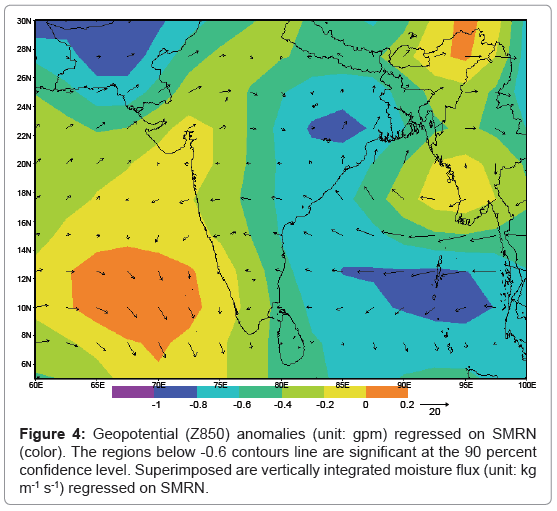
Figure 4: Geopotential (Z850) anomalies (unit: gpm) regressed on SMRN (color). The regions below -0.6 contours line are significant at the 90 percent confidence level. Superimposed are vertically integrated moisture flux (unit: kg m-1 s-1) regressed on SMRN.
In the regression on IOD, the winds are fundamentally opposite to those on SMRN and ENSO, suggesting the inverse relation of IOD with SMRN. Near Nepal, however, the wind is very weak and not effective for a role of IOD on SMRN. Thus, the atmospheric circulation patterns around Indian continent are set up in relation to ENSO and works as the condition for the interannual variability in SMRN. An additional remark is given on the clear difference between SMRN and SOI over Pakistan coast and northwestern India: i.e., the northeastward moisture flux only is clearly shown (Figure 4). This feature indicates a possible mechanism for SMRN variability other than ENSO and is examined in Moisture fluxes from BOB and AS.
Moisture Fluxes from BOB and AS
We now investigate the 2000km-scale conditions for the interannual variability of SMRN by focusing on moisture flux. A standard analysis of moisture balance is made on a control box around a concerned area including Nepal. A control box was taken around Nepal (80°E–90°E, 25°N–30°N), and the moisture convergence was taken up to 850 hPa. The correlation is low (0.20) between SMRN and the moisture convergence averaged over JJAS. The convergence integrated to 500 hPa gave a similar correlation, since a main convergence occurs below 850 hPa with only negligible flux through the northern edge over Himalaya. Possible reasons for this result could be attributable to the reanalysis data with possible underestimations of local orographic effects, under-resolved low pressures and local re-evaporation.
The moisture flux anomaly is examined by separation into a seasonal average pattern in the upstream region here and monsoon onset around Nepal in Synoptic Processes and Monsoon Onset. As presented in the previous section, the moisture accumulation over 15°N can be released by a clear northward route through the northern BOB associated with the geopotential height regressed on SMRN. Therefore, the section in the northern BOB was taken to examine the required moisture supply to yield the high SMRN. We calculated the moisture flux across the zonal section along 20°N from 85°E to 95°E. The CC between SMRN and the moisture transport is 0.36 above the 95 percent confidence level (Table 1). It is noted that this CC is lower than that between SMRN and SOI, indicating the other mechanisms such as local re-evaporation near Nepal.
| rainc | rainw | MFe | MFw | MFs | SMRN | |
| raine | 0.47 | 0.19 | 0.18 | 0.12 | 0.15 | 0.72 |
| rainc | 1 | 0.46 | 0.21 | 0.28 | 0.32 | 0.84 |
| rainw | 1 | 0.43 | 0.09 | 0.16 | 0.64 | |
| MFe | 1 | -0.20 | 0.87 | 0.36 | ||
| MFw | 1 | 0.32 | 0.19 | |||
| MFs | 1 | 0.40 |
Table 1: Correlation coefficients among the precipitations in the eastern, central and western regions, the moisture fluxes over BOB and from AS, and SMRN (Bold values are significant above 95% confidence level). MFe and MFw: northward moisture flux along the eastern route across (85°E to 95°E, 20°N), and eastward moisture flux along the western route across (70°E, 20°N to 30°N). MFs: sum of MFe and MFw. rainc and rainw: summer monsoon precipitations in the eastern, central and western regions in Nepal. CC is listed at the cross-point between two parameters: e.g., CC is 0.47 between raine and rainc.
As shown in Figure 4, another moisture route exists from the northern end of the Arabian Sea. Hence, the moisture flux from the AS is examined with the eastward one across the meridional section along 70°E from 20°N to 30°N. As shown in Table 1, this flux is less correlated with SMRN than that over BOB. The sum of both fluxes (MFs) is more highly correlated with SMRN than the individual fluxes. The optimal correlation is found to be 0.43 between the entire SMRN and the sum of the eastern flux and 70% of the western flux: i.e., MFe+0.7MFw.
We now look into the relationship between the moisture flux routes and regional precipitations in Nepal. The regional precipitations are highly correlated with entire SMRN, while the correlation is low between the eastern and western regions (Table 1). The regional precipitations are not simply related with the moisture fluxes in the routes closer to the respective regions: i.e., the central SMRN is correlated with the total moisture flux (MFs), while the western SMRN is more highly correlated with the eastern flux than the western flux. This result suggests that moisture accumulates first over northern India mainly with the flux from BOB along with a minor contribution from the AS side, and then, it is transported to Nepal.
Figure 5 shows the summer monsoon OLR regressed on SMRN, describing a clear negative anomaly in northern India and Nepal. The climatic OLR has a low center over southern India and spreads northward. Low values of OLR indicate higher cloud tops (and more rain when clouds are deep) and consequent positive anomalies of precipitation. Specific humidity is significantly correlated with OLR and MFs (Table 2). The geopotential height regressed on SMRN has the extension of a low pressure anomaly in northeastern India (Figure 4) and situated under the eastern part of the low OLR. Thus, we can conclude that the moisture fluxes and accumulation support a favorable condition for moisture available for SMRN.
| OLRni | SHnp | OLRnp | MFs | SMRN | |
| SHni | -0.47 | 0.27 | -0.60 | 0.59 | 0.24 |
| OLRni | 1 | -0.48 | 0.67 | -0.31 | -0.21 |
| SHnp | 1 | -0.71 | 0.44 | 0.32 | |
| OLRnp | 1 | -0.30 | -0.21 |
Table 2: Correlation coefficients among specific humidity, outgoing long wave radiation, moisture flux and SMRN (Bold values are significant above 95% confidence level). SHni and OLRni: Specific humidity at 1000hPa and outgoing long wave radiation over northern India (80-90°E, 20-25°N). SHnp and OLRnp: Specific humidity at 1000hPa and outgoing long wave radiation near Nepal (85°E, 25°N) only for June.
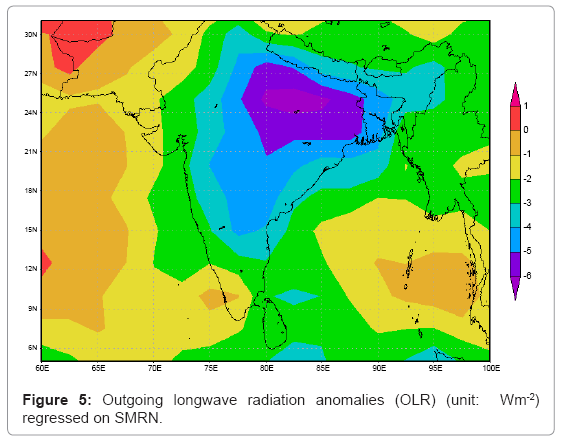
Figure 5: Outgoing longwave radiation anomalies (OLR) (unit: Wm-2) regressed on SMRN.
Synoptic Processes and Monsoon Onset
Following the large scale atmospheric circulation and the moisture flux toward northern India, the final point is set on the processes near Nepal so that we may identify an additional parameter crucial for SMRN. It is of interest that the entire SMRN is more highly correlated with specific humidity near Nepal for June than northern India for the entire summer monsoon season (Table 2). It is reasonable to expect the specific humidity in June indicating monsoon onset timing as arrival of humid air. Thus, the early onset may play a role of high SMRN.
The statistical analyses explain majority cases, while exceptional cases always exist. In order to identify and describe the exceptional cases, a special method was chosen. In the climate field, an extreme year is often chosen from a decadal period and analyzed for exploring an important mechanism [11]. We selected the top-three high (1984, 1995, 1998) and bottom-three low (1977, 1979, 1992) years of SMRN among 33 years: i.e., they represent high- and low-extremes at 10%, or anomalies outside of 1.3 times of standard deviation (σ) under the assumption of a normal distribution. The moisture flux across the zonal section at 20°N from 85°E to 95°E was also categorized based on the threshold of 1.3σ. It is noted that SMRN has the significant correlation of 0.36 with the moisture flux. Among these six years, high moisture flux (>1.3σ) occurred in 1995 and 1998, and low moisture flux (<-1.3σ) occurred in 1979 and 1992. However, the years of 1984 and 1977 were exceptional with nearly averaged fluxes.
To test the effects of synoptic low pressures characterized by the pressure fluctuations as mechanisms for rainfall, the first two months were selected: i.e., June when monsoon is initiated, and July with the highest monthly (more than 33%) precipitation. Then, these two months of the top-three and bottom-three years were checked whether they possessed extreme rainfall in the individual months (Figure 6). As listed in Table 3, two cases among the three high years had high June rainfall (>1.3σ). This ratio is consistent between June and July, and also between the high and low years. It is noted that one of the low years, 1979, is attributable to August and September.
| High rain year | Low rain year | |||
| June | 1984 (h+) | 1995 (h+) | 1977 (p-,h-) | 1992 |
| July | 1984 (p+) | 1998 (h+) | 1977 | 1992 (h-) |
p= surface pressure, h=specific humidity
Table 3: High and low rain years for June and July with the marks of monthly mean specific humidity and surface pressure fluctuations exceeding ± 1.3σ.
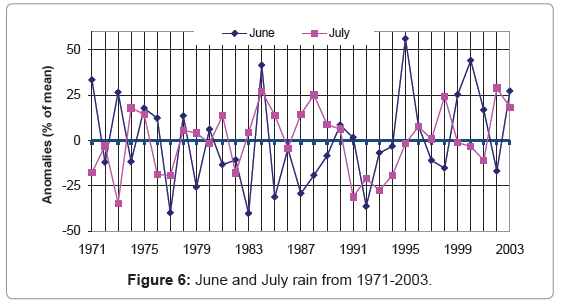
Figure 6: June and July rain from 1971-2003.
We focused on the pressure fluctuations which exceed ± 1.3σ, and noticed the surface pressure has two marks in Table 3. As 1984 (1977) is characterized with the fluctuations, we can expect the higher (lower) fluctuations caused by the monsoon depressions, resulting in the higher (lower) rainfall.
We further try to characterize the years of 1984 and 1977. As a useful parameter, we choose specific humidity (at 850 hPa) for describing summer monsoon conditions at (85°E, 27.5°N). The specific humidity is shown for June and July in Figure 7 and it has five cases exceeding ± 1.3σ among eight extreme rain months (Table 3). In most years, high (low) precipitation in June and July was consistent with high (low) specific humidity over Nepal. It is a reasonable interpretation that the anomalies in June moisture indicate early and late onsets of monsoon for 1984 and 1977, respectively (Figure 7), although July moistures are high any way and close to the saturated values.
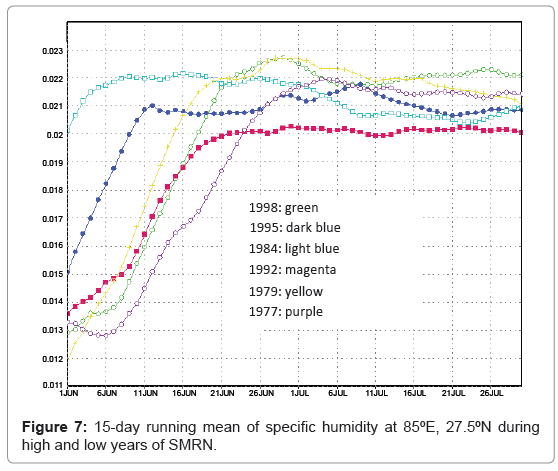
Figure 7: 15-day running mean of specific humidity at 85ºE, 27.5ºN during high and low years of SMRN.
As summary of top-three high and bottom-three low SMRN years, two high and two low years are explained by the northward moisture flux from BOB, while one high and one low years could be attributable to early and late onsets of summer monsoon (Table 3).
Summary and Discussion
We relied on statistical analyses between SMRN and the large-scale phenomena such as ENSO and IOD, suggesting ENSO as the most influential one. Atmospheric patterns were regressed on the key indices and revealed that the atmospheric inflow comes from the equatorial region to BOB. The statistical relationship between tropical Pacific circulations (e.g. ENSO) and summer monsoon around northern India is consistent with the established finding [1,12,13]. In the present paper, the mechanism which governs strength of the monsoon system was shown as the large-scale condition, La Niña for high SMRN. The reversed anomaly occurs during El Niño, the warm episode of ENSO.
Based on the statistical analyses, the significant aspect of anomalous SMRN is the moisture flux from BOB along with a minor contribution from AS, showing higher precipitation as the high cloud core over northern India. The main moisture route is clearly related with La Niña. As rare cases of 1984 and 1977, early and late onsets of monsoon might have played a role on SMRN variability, respectively. Anomalous SMRN without contribution of northward moisture flux from BOB might indicate a role of local re-evaporation. The further analysis and modeling would be useful to determine the role of synoptic depressions, which could enhance uphill winds and convection around Nepal.
The timing of monsoon onset was found to be effective for precipitation in June. In occasional cases of 1984 (1977), the onset was early (late), and then, synoptic depressions may have appeared earlier (later) and induced more (less) rain. It is noted, however, that the present analyses are not capable of explaining small local scale systems interacting with orography and meso-scale processes over Nepal, but have such a study left for future.
In spite of the suggestion by Kumar et al. [2] and Ashok et al. [4], SMRN was significantly correlated with SOI until late 1990s. However, the recent tendency departed from this relationship so that, from 2000, SMRN was high, while SOI was low (Figure 2), and the northward moisture flux reduced over BOB. This interesting tendency is also left as a future study.
Acknowledgements
Nepal Government’s Department of Hydrology and Meteorology is acknowledged for providing the observational rain gauge data. Scholarship and other financial support were provided for first author from MEXT- Japan. We are thankful to Dr. Youichi Tanimoto for fruitful comments and to Dr. Tak Ikeda for proof reading.
References
- Goswami BN (1998) Interannual Variations of Indian Summer Monsoon in a GCM: External Conditions versus Internal Feedbacks. J Clim11: 501-522.
- Kumar KK, Rajagopalan B, Cane MA (1999) On the Weakening Relationship between the Indian Monsoon and ENSO. Science 284: 2156-2159.
- Yang J, Liu Q, Xie SP, Liu Z, Wu L (2007) Impact of Indian Ocean SST basin mode on the Asian summer monsoon. Geophy Res Lett 34: L02708.
- Ashok K, Guan Z, Yamagata T (2001) Impact of the Indian Ocean Dipole on the Relationship between the Indian Monsoon Rainfall and Enso. Geo Res Lett 28: 4499-4502.
- Lang TJ, Barros AP (2002) An investigation of the Onsets of the 1999 and 2000 Monsoons in Central Nepal. Mon Wea Rev 130: 1299-1316.
- Krishnamurthy V, Ajayamohan RS (2008) The composite structure of monsoon low pressure systems. COLA Technical Report 270, Center for Ocean-Land-Atmosphere Studies, Institute of Global Environmental and Society, Inc, Maryland, US.
- Shrestha AB, Wake CP, Dibb JE, Mayyewski PA (2000) Precipitation fluctuation in the Nepal Himalaya and its vicinity and relationship with some large scale climatology parameters. Intl J Climatol 20: 317-327.
- Shrestha ML (2000) Interannual variation of summer monsoon rainfall over Nepal and its relation to southern oscillation Index. Meteorol Atmos Phys75: 21-28.
- Kalnay E, Kanamitsu M, Kistler R, Collins W, Deaven D, et al. (1996) The NCEP/NCAR 40-Year Reanalysis Project. Bull Amer Meteor Soc 21: 437-471.
- Saji NH, Yamagata T (2003) Possible impacts of Indian ocean Dipole mode events on global climate. Clim Res 25: 151-169.
- Marengo JA, Hastenrath S (1993) Case Studies of Extreme Climatic Events in the Amazon Basin. J Clim 6: 617-627.
- Krishnamurthy V, Goswami BN (2000) Indian Monsoon-ENSO relationship on interdecadal timescale. J Clim 13: 579-595.
- Chowdhury MR (2003) The El Niño-Southern Oscillation (ENSO) and seasonal flooding – Bangladesh. Theor Appl Climatol 76: 105-124.
Citation: Sigdel M, Ikeda M (2012) Summer Monsoon Rainfall over Nepal Related with Large-Scale Atmospheric Circulations. J Earth Sci Climate Change 3: 112. DOI: 10.4172/2157-7617.1000112
Copyright: ©2012 Sigdel M, et al. This is an open-access article distributed under the terms of the Creative Commons Attribution License, which permits unrestricted use, distribution, and reproduction in any medium, provided the original author and source are credited.
Select your language of interest to view the total content in your interested language
Share This Article
Recommended Journals
Open Access Journals
Article Tools
Article Usage
- Total views: 24716
- [From(publication date): 7-2012 - Nov 16, 2025]
- Breakdown by view type
- HTML page views: 19458
- PDF downloads: 5258