Suspended Sediment Load Monitoring Along the Mekong River from Satellite Images
Received: 23-Aug-2013 / Accepted Date: 24-Sep-2013 / Published Date: 30-Sep-2013 DOI: 10.4172/2157-7617.1000160
Abstract
The Mekong River has recently been suffering from environmental degradation despite its global significance of biodiversity. The monitoring of important constituents of ecosystems is critical for implementing effective environmental management. Meanwhile, the application of remote sensing to assess inland water quality has recently escalated due to its scanning wide water bodies within a short time period. In this study, the applicability for monitoring suspended sediment load (SSL) in the Mekong River over temporal and spatial dimensions was investigated. Landsat scenes captured between 1988 and 2000, including 110 Thematic Mapper (TM) images and 21 Enhanced Thematic Mapper Plus (ETM+) images, were analysed in correspondence with ground observations. The three visible and near infrared bands were included in the analysis. The polynomial relationship of the NIR exoatmospheric reflectance, band 4 wave length: 760-900 nm, to SSL based on the ground observations at 9 sites along the river demonstrated the best agreements (overall R2, 0.76). Subsequently, the equation enables us to reasonably estimate the suspended sediment load longitudinal profiles and its temporal changes. Thus, the results confirmed a high applicability of satellite image for monitoring SSL in relatively large rivers such as the Mekong River.
Keywords: Suspended sediment; Mekong river; Satellite image; Longitudinal profile; Temporal change.
11140Introduction
The monitoring of important components of ecosystems is critical for implementing effective environmental management [1]. However, due to the spatial and temporal heterogeneity of water bodied coupled conventional sampling methods often result in inadequate monitoring and characterization of water quality [2]. Meanwhile, the application of remote sensing to assess inland water production has escalated recently because its capability of scanning wide water bodies within a short time period [3]. Consequently, a combined approach utilizing the spatial and temporal coverage of remote sensing with conventional water sampling provides potentially effective solution to monitoring fresh water ecosystem [4]. In relation to water quality, sediments transport and erosion is a complex natural process that is strongly affected by human activities such as deforestation, agriculture and urbanization. In particular, sediment play a key role in controlling water quality and it can cause a major reduction on stream capacity for handling flood waves [5]. Sediment is the most common constituent both in weight and volume in surface waters of fresh water systems. Thus, especially for turbid rivers, the effect of the other optical active substances on the satellite data is negligible [6].
The Mekong River is Asia’s third largest river in terms of length and sediment load [7]. It receives enormous public attention in Asia because the river runs through six countries and approximately 60 million people live on or dependent on the Mekong basin [8]. The Mekong has recently been suffering from environmental degradation due to population increase, economic development, deforestation, and intensified meteorological extremes [9,10]. Especially, the dam construction and land use change within the basin are expected to alter hydrological process and sediment transport [11]. Therefore, adequate monitoring of sediment load is needed if prospective plans for basin development and management were under taken or current plans are continued.
Sediment has been recognized as the important contaminant affecting the Mekong water [12]. Besides its direct role in determining water clarity, bridge scouring, and reservoir storage, sediment serves as a vehicle for the transport of many binding contaminates, including nutrients, trace metals, semi-volatile organic compounds, and numerous pesticides [13]. Over the past three decades, remotely sensed images have been widely used in the assessment of suspended sediment [9,10]. Relative to large water bodies, such as lakes and reservoirs, water in rivers are more immediately sensitive to and more directly influenced by the characteristic of the river bank, human activities, and other external forces [14]. Therefore, the successful application of remote sensing technology to suspended sediment load monitoring of rivers could be a very useful tool for management and development at basin scales [15].
The present study aims to investigate the applicability of satellite images for monitoring suspended sediment load (SSL) in the Mekong River over temporal and spatial dimensions. Based on the generated observations, the empirical equation to estimate SSL was then applied to construct suspended sediment load profiles over the Mekong length and its temporal changes.
Materials and Methods
Study area
The Mekong is the largest trans-boundary river in Asia. It originated at Tibet in China and flows down to Southern Vietnam, a distance of more than 4600 km (Figure 1). It delivers approximately 160 million tons of sediment and 475 km3 of fresh water per year into the South China Sea [8]. Compared to other major rivers of the world, the Mekongis ranked 12th with respect to length, 21st with respect to catchment’s area and 8th with respect to average annual runoff [16]. The climate of the Mekong is humid and tropical. Mean annual rainfall ranges from 1000 mm in Thailand to 3200 mm in the mountainous region of Laos PDR. The Mekong River Basin is dominated by two distinct monsoon seasons: the rainy southwest monsoon season and the dry northeast monsoon season. Most researchers agree that the rainy season accounts for more than 80% of the annual rainfall between mid-May and early October [17]. The Mekong River flows over rocks for about 80% of its length before it enter the alluvial plain of Cambodia and Vietnam. Bedrock within China and Lao PDR are mainly sedimentary and metamorphic rocks [12].When the Mekong River reaches Northern Cambodia, alluvial channel deposits with exposures of Triassic sediment rocks and Neogene basalts become the primary river bed material. The river ultimately runs into the Mekong Delta, which is composed of Holocene alluvial sediment and has experienced a rapid pro-gradation since 8000 y Bp [12,18].
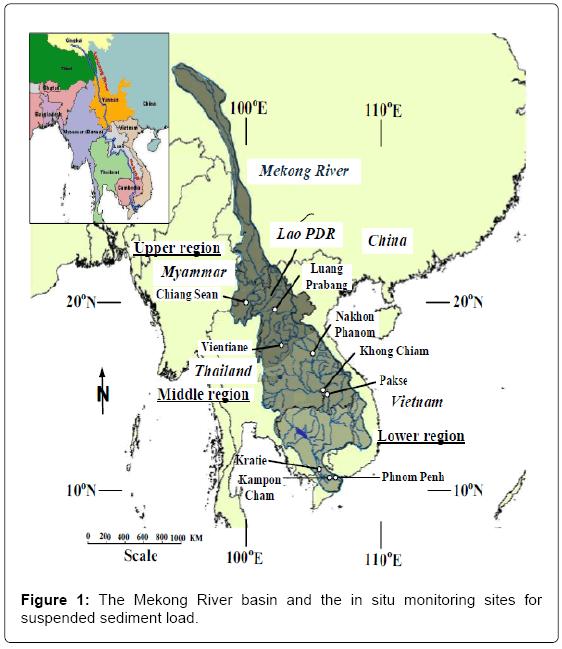
Figure 1: The Mekong River basin and the in situ monitoring sites for suspended sediment load.
The Mekong River basin is experiencing rapid economic and population growth. Increasing demand for hydropower and fresh water leads to the construction of more and more dams and reservoirs along the main stream, which will inevitably change the water/sediment discharge downstream. The most controversial hydropower project on the Mekong River so far is the Lancang Cascade within China’s Yunnan Province in the upstream area. Since the completion of the Manwan Dam (the first of 14 dams in total) in 1993, arguments have been raised about its positive and, especially, negative impact on the Lower Mekong River basin [19]. A general consensus is that although there was a sharp decrease of sediment flux at Chiang Sean shortly after completion of the dam, other stations downstream did not show abrupt changes [20,21].
The basin of the Mekong is mainly under forest and farming. The delta is the most fertile area. Several small urban settlements occur along the river, but most of the basin is rural with a low population density ranging from 8/km2 10 in the hills to 570 in the delta [22]. A "fluvial system"-concept is useful in characterising the Mekong Basin sediment processes. An idealized fluvial system consists of Zone 1, the drainage basin as a sediment and runoff source; Zone 2, the main river channels as a transfer component; and Zone 3, the alluvial floodplains, fans, deltas, etc., as zones of deposition. Zone 1 can be further divided into upland areas, lateral areas, and small stream channels. Considered together, these three elements form the watershed [8].
We focused on the Mekong River from the upstream of Chiang Sean to the downstream of Phnom Penh, which is 2,365 km long (Figure 1). In situ measurements of SSL from January 1988 to December 2000 along the Mekong were collected, Mekong River Commission [8]. The spatial distribution of monitoring sites is shown in Figure 1. Gupta and Liew divided the Mekong into eight units based on different channel characters [22]. Among the stations in this study, Chiang Sean and LuangPrabang are located on the upper rock-cut channel; Vientian and NakhonPhanom are located on the alluvial channel; KhongChiam is located in the lower rock-1 cut channel; Pakse is located on the composite channel; Kratie is located on the anastomosed channel in rock and alluvium; Kampong Cham is located on structure-guided alluvial channel; and Phnom Penh is located on free alluvial channel.
Landsat data
Landsat scenes captured between 1988 and 2000, including 110 Thematic Mapper (TM) images and 21 Enhanced Thematic Mapper Plus (ETM+) images were used to estimate the patterns of suspended sediment load in the Mekong. The spatial resolution of TM and ETM+ data is 30 m (except for band 6 of the thermal infrared channel with 120 m). The images were acquired from the different seasons of the year from the Landsat archive from the United States Geological Survey (USGS) (http://glovis.usgs.gov). The three visible and near infrared bands were included in the analysis. These data were combined with in situ measurements for determination of statistical relationships between reflectance of different TM and ETM+ bands and SSL. The monitoring cases from 1988 to 2000 were used to illustrate the longitudinal profiles and the temporal change of SSL of the Mekong.
Satellite reflectance
Suspended sediments increase the radiance emergent from surface waters in the visible and near infrared (NIR) proportion of the electromagnetic spectrum [3]. The Landsat TM and ETM+ visible and NIR bands, 1-4, are optical bands recording electromagnetic radiation of 0.45-0.52, 0.52-0.60, 0.63-0.69 and 0.76-0.90 μm, respectively. Cloud-free pixels in the middle of the river width, counting the information only from water surface but not from land, were used to estimate SSL. Since analysis was carried out for individual image with quite a small angular range, the atmospheric correction has a little effect on correlation analysis [23]. Thus, the atmospheric correction was neglected. The analysis involved transformation of the raw Landsat TM and ETM+ digital numbers (DNs) to physical values of 1 radiance using in-flight sensor calibration parameters [24],
 (1)
(1)
where, Lλ is spectral radiance measured over band width λ (m W cm-2 sr-1 μm-1); DN is digital number value recorded, Lmax is radiance measured at detector saturation (m W cm-2 sr-1 μm-1); and Lmin is lowest radiance measured by detector (m W cm-2 sr-1 μm-1). Then, exoatmosphere reflectance for each band width computed [24],
 (2)
(2)
where, ρλ is reflectance as a function of band width λ; d is Earth-sun distance correction; Eoλ is exoatmospheric spectral irradiance; and θs is solar zenith angle. In this study, some regression methods including linear, exponential and log formulations were used to examine the relationships between SSL analysed in the laboratory and remote sensing reflectance data in TM and ETM+ bands 1-4.
Results and Discussion
Suspended sediment load models
Because of the nonlinear behaviour of the observations, the polynomial regression method to relate SSL to exoatmospheric reflectance of the visible bands 1-3 and NIR band 4 was chosen. The Landsat scenes and the corresponding in situ measurements of SSL at the monitoring sites were used. The polynomial graphs were developed by 49 data points (29 points during the dry season and 19 during the winter season). The relationships were obtained with optimized c 1 curve-fitting, (Figures 2a-2d). The results showed R2 values of 0.436, 0.358, 0.566, and 0.76 for band 1, band 2, band 3, and band 4, respectively. Overall, the best relationship was obtained for Landsat TM and ETM+ band 4 per,
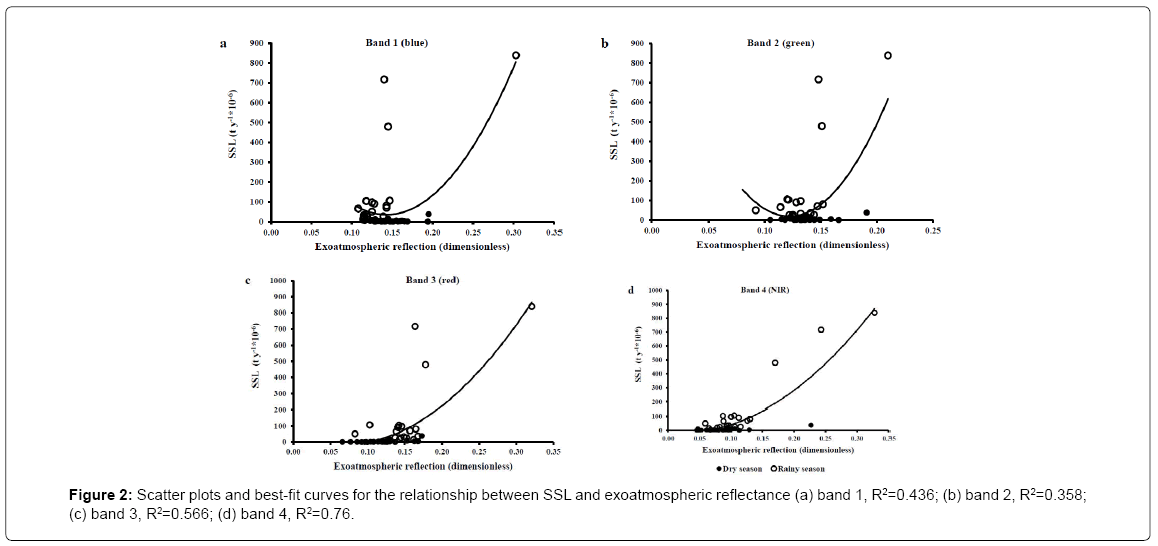
Figure 2: Scatter plots and best-fit curves for the relationship between SSL and exoatmospheric reflectance (a) band 1, R2=0.436; (b) band 2, R2=0.358; (c) band 3, R2=0.566; (d) band 4, R2=0.76.
 (3)
(3)
where, SSL is suspended sediment load (t y-1*10-6); ρ4 is exoatmospheric reflectance of band 4. The best wavelengths for satellite assessment of suspended sediment load are found in the NIR, which is in line with previous research conclusions (Figure 2) [3].
Scatter plot of predicted values from equations (3) versus measured values of SSL is shown in Figure 3. The correlation coefficient and the Root Mean Square Error (RMSE) are 0.76, and 81.5 t y-1*10-6. The results indicate that predicted values of SSL and measurements are in a reasonable agreement.
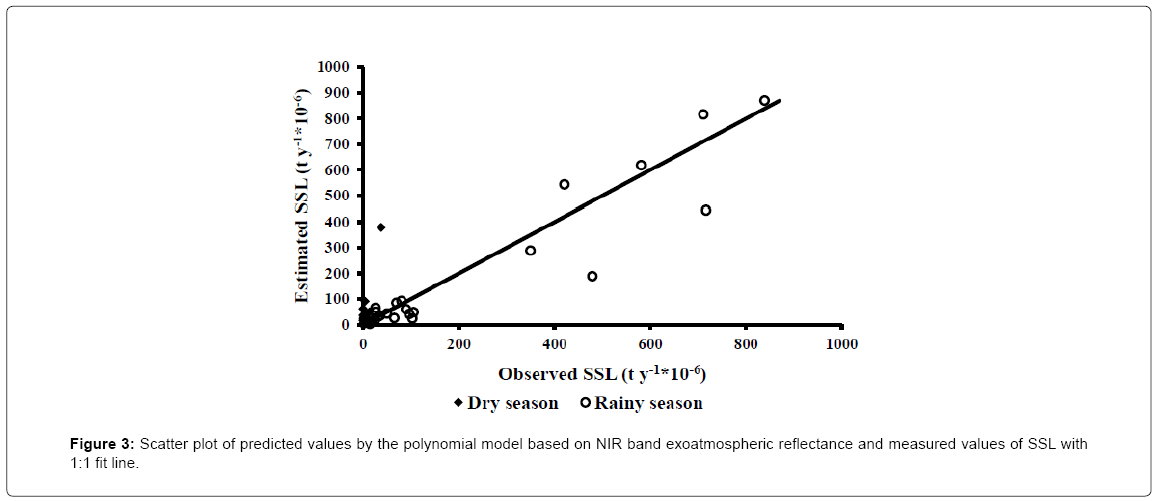
Figure 3: Scatter plot of predicted values by the polynomial model based on NIR band exoatmospheric reflectance and measured values of SSL with 1:1 fit line.
Longitudinal profiles and temporal changes of suspended sediment load
In order to illustrate the longitudinal profile of suspended sediment load for different seasons we select four longitudinal profiles, where there was extensive satellite coverage of the Mekong. Two profiles represent the variation of SSL for dry season, winter (December to February) and spring profile (March to May), and the other two for rainy season, summer (June to August) and autumn profile (September to November). The polynomial model based on the NIR data, equation (3), was applied to estimate SSL. Results of the SSL model were in reasonable agreement with the measurements, as shown in Figures 4a- 4d. The Root Mean Square Error (RMSE) between the observed and estimated SSL were 4.41, 11.1, 38.73 and 17.45 t y-1*10-6 for winter, spring, summer and autumn profiles, respectively.
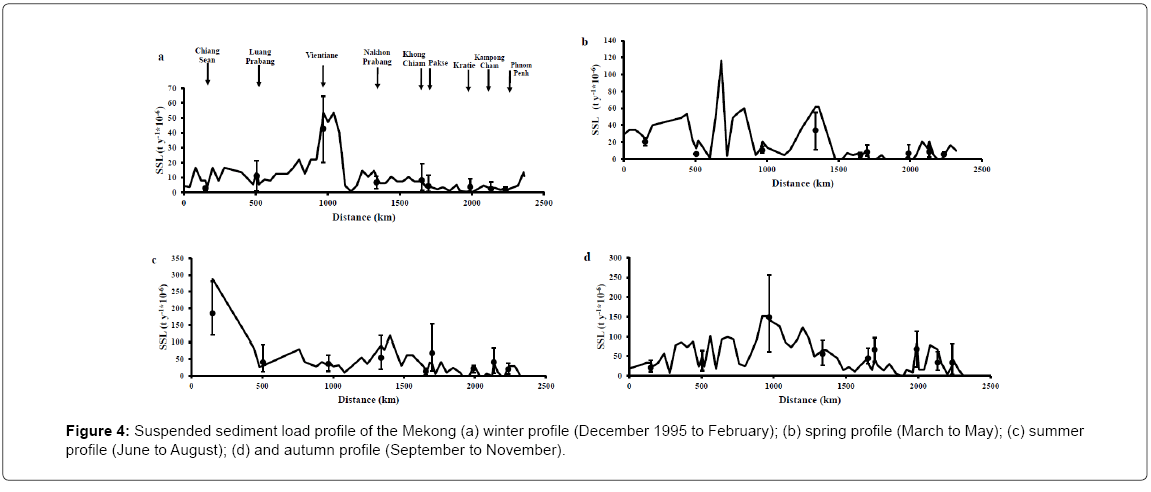
Figure 4: Suspended sediment load profile of the Mekong (a) winter profile (December 1995 to February); (b) spring profile (March to May); (c) summer profile (June to August); (d) and autumn profile (September to November).
Generally, the Mekong exhibited a downstream decrease in the SSL. The longitudinal gradient was not linear and SSL changes occurred along the fluvial continuum. The SSL shows no steady trend along the Mekong, as illustrated in Figures 4a-4d. Walling explained this phenomenon as a convergence losses associated with sediment storage starting from approximately 50 km upstream of Chiang Sean [25]. The highest SSL variations here were close to Vientiane and Nakhon phanom. The SSL was raised along this part because the maximum precipitation in the Mekong basin is documented at Nakhon Phanom with a mean rate of 2298.7 mm y-1 (1953-2005) and this section is mainly under forest [12]. Subsequently, intensive soil erosion was occurred carrying high sediment load to the river along this part. The summer profile showed the highest SSL values along the Mekong varies from 288.15 t y-1*10-6 at Chiang Sean to 25.5 t y-1*10-6 at Phnom Penh, while the lowest SSL values was varied from 7.9 t y-1*10-6 at Chiang Sean to 3.1 t y-1*10-6 at Phnom Penh, for winter profile as shown in Figures 4a and 4c. Thus, the load of suspended sediment was higher in the rainy season than the dry season. This can be attributed to the intensive soil erosion coincident with the heavy precipitation. The average SSL at Phnom Penh, the start of Mekong Delta, were estimated to be 3.1, 2.96, 25.54, and 25.5 t y-1*10-6 in winter, spring, summer and autumn seasons, respectively. This was the lowest among the studied stations due to the sediment deposition behaviour in the Delta region, which decrease the SSL in the water phase.
The annual sediment loads of the Mekong River were relatively stable in the past 40 years [25]. However, there is a significant seasonal change in the SSC among the year seasons. The polynomial model based on the NIR was applied to estimate this temporal change in SSL at the monitoring stations. Figures 5a-5c shows the trend of seasonal SSL change for one of upper region stations (Chian Sean), one of the middle region stations (Khong Chiam), and one of the lower region stations (Kampon Cham) with RMSE between observed and estimated SSL values of 18.11, 40.42, and 37.46 t y-1*10-6, respectively. The seasonal SSL was fairly well estimated at the main stream stations of the Mekong in all three regions. Thus, the SSL model represented observed data satisfactorily describe the seasonal cycle of suspended sediment load in the Mekong, which can be applied to estimate the future SSL in the basin.
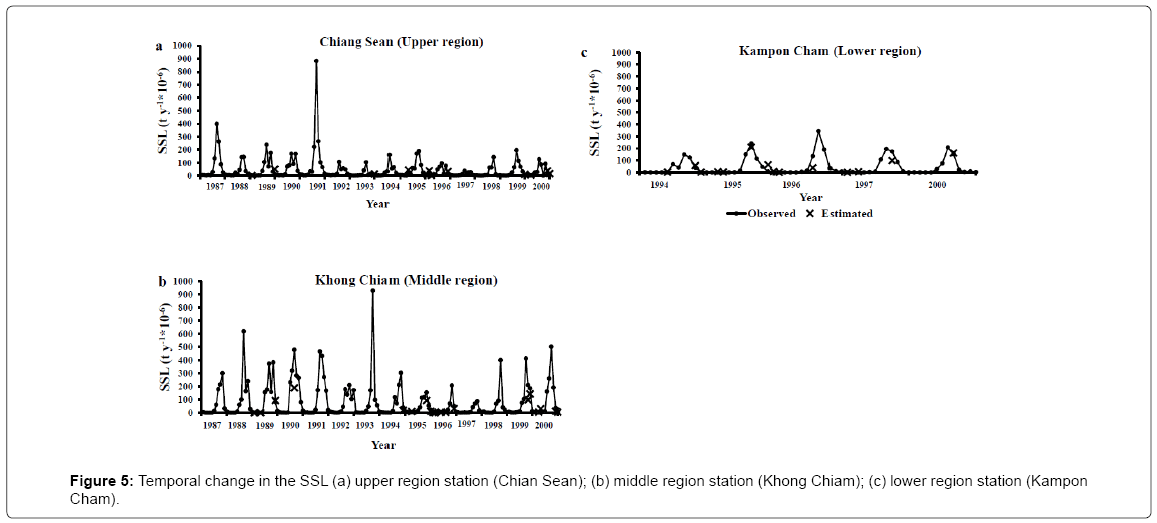
Figure 5: Temporal change in the SSL (a) upper region station (Chian Sean); (b) middle region station (Khong Chiam); (c) lower region station (Kampon Cham).
Based on the estimations, the average SSL was higher in the rainy season than the dry season. That is due to the intensive soil erosion coincident with the heavy precipitation. The result reveals a decreasing trend in the SSL along the three regions. This longitudinal decrease was due to the decrease in the main stream water velocity, which increases the sediment deposition and the SSL become lower.
The average SSL at Kampon Cham was the lowest among the studied stations due to the sediment deposition behaviour in the Delta region, which decrease the SSL. The results provided average decrease in SSL post Manwan Dam at Chiang Sean. However, the effect of the dam at the other downstream stations was negligible. That can be because the heavily precipitation in the middle region and the deposition behaviour in the Mekong Delta are the control factors for the SSL in the river at these stations compared to the effect of the upstream dams (Figure 5).
Conclusion
An effective combination of Landsat TM and ETM+ images with conventional in situ measurements was found to monitor SSL along the Mekong River. The analysis composed transformation of the raw Landsat TM and ETM+ digital numbers (DNs) to physical values of radiance and to exoatmosphere reflectance. Regression methods were used to examine the statistical models between SSL analysed in the laboratory and remote sensing reflectance values in TM and ETM+ bands 1-4. The results indicate that the best wavelengths for satellite assessment of suspended sediment load was in the NIR range, band 4. A polynomial model based on the NIR data was chosen to predict the SSL along Mekong because of its higher correlation. The model fairly represented field data satisfactorily at the main stream stations of the Mekong in all three regions and would be used to estimate the future SSL in the basin. Generally, the Mekong River exhibited a decrease in the SSL downstream. The longitudinal gradient was not linear and SSL changes occurred along the fluvial continuum. The highest SSL variations, rising, were close to Vientiane and Nakhon phanom. The suspended sediment load was higher in the rainy seasons than the dry seasons. The lowest SSL was estimated at the start of Mekong Delta, due to the sediment deposition behaviour in the Delta region, which decrease the suspended sediment concentration in the water. The approach introduced here shows suitability of monitoring SSL at large basin scales like the Mekong. Thus, it can be applied not only for the Mekong but also for other large basins since suspended sediment is the common constituent in surface waters.
Acknowledgements
The author is very grateful for Egyptian Ministry of Higher Education (MOHE) for providing financial support for this research.
References
- Duan W, Takara K, He B, Luo P, Nover D, et al. (2013) Spatial and temporal trends in estimates of nutrient and suspended sediment loads in the Ishikari River, Japan, 1985 to 2010. Sci Total Environ 461-462: 499-508.
- Liu Y, Islam MA, Gao J (2003) Quantification of shallow water quality parameters by means of remote sensing. Progress Physic Geog 27: 24-43.
- Ritchie JC, Zimba PV, Everitt JH (2003) Remote Sensing Techniques to Assess Water Quality. Photogrammetric Engineering and Remote Sensing 69: 695– 704.
- Yang W, Matsushita B, Chen J, Fukushima T (2011) Estimating constituent concentrations in case II waters from MERIS satellite data by semi-analytical model optimizing and look-up tables. Remote Sensing Environ 115: 1247–1259.
- Arnold JG, Williams JR, Maidment D R (1995) Continuous-time water and sediment routing model for large basins. J Hydrol 121: 171-183.
- Lal R (1994) Soil Erosion, Soil and Water Conservation Society. Ankeny, Iowa 340.
- Milliman JD, Meade RH (1983) World-wide delivery of river sediment to the oceans. J Geol 91: 1–21.
- Mekong River Commission - Annual report (2005) Vientiane, Mekong: Mekong River Commission, Cambodia.
- Olsen DM, Dinerstein E (2002) The global 200: priority ecoregions for global conservation. Ann Mo Bot Gard 89: 199–224.
- Dudgeon D (2005) River rehabilitation for conservation of fish biodiversity in monsoonal Asia. Ecol. Soc. 10: 15.
- Le TVH, Nguyen HN, Wolanski E, Tran TC, Haruyama S (2007) The combined impact on the flooding in Vietnam’s Mekong River delta of local man-made structures, sea level rise, and dams upstream in the river catchment. Estuarine, Coastal and Shelf Science 71:110–116.
- Xue Z, Liu JP, Ge Q (2011) Changes in hydrology and sediment delivery of the Mekong River in the last 50 years: connection to damming, monsoon, and ENSO. Earth Surface Process and Landforms 36: 296–308.
- U.S. Environmental Protection Agency (EPA) (2000) National water quality inventory, report to congress. Washington DC, USA.
- Palmer MA, Lettenmaier DP, Poff NLR, Postel SL, Richter B, et al. (2009) Climate change and river ecosystems: protection and adaptation options. Environ Manage 44: 1053–1068.
- Julian JP, Doyle MW, Powers SM, Stanley EH, Riggsbee JA (2008) Optical water quality in rivers. Water Resource Research 44.
- Davies BR, Walker KF (1986) The Ecology of River Systems. Dr. W Junk Publishers, Dodrecht, The Netherlands.
- Kite G (2001) Modelling the Mekong: hydrological simulation for environmental impact studies. J Hydrol 253: 1–13.
- Tamura T, Saito Y, Sieng S, Ben B, Kong M, et al. (2009) Initiation of the Mekong River delta at 8 ka: evidence from the sedimentary succession in the Cambodian lowland. Quaternary Science Reviews 28: 327–344.
- Nguyen QM (2003) Hydrologic impacts of China’s Upper Mekong dams on the Lower Mekong River.
- Lu XX, Siew RY (2006) Water discharge and sediment flux changes over the past decades in the Lower Mekong River: possible impact of the Chinese dams. Hydrol Earth Syst Sci 10: 181–195.
- Kummu M, Varis O (2007) Sediment-related impacts due to upstream reservoir trapping, the Lower Mekong River. Geomorphology 85: 275–293.
- Gupta A, Liew SC (2007) The Mekong from satellite imagery: a quick look at a large river. Geomorphology 85: 259–274.
- Zhang Y, Pulliainen JT, Koponen SS, Hallikainen MT (2003) Water quality retrieval from combined Landsat TM data and ERS-2 SAR data in the Gulf of Finland. IEEE Trans. Geosci. Remote Sens. 41: 622–629.
- Jensen JR (1996) Introductory Digital Image Processing–a Remote Sensing Perspective, Prentice Hall, Englewood Cliffs, NJ, USA.
- Walling DE (2008) The changing sediment load of the Mekong River. Royal Swedish Academy of Sciences 37:150–157.
Citation: Fleifle AE (2013) Suspended Sediment Load Monitoring Along the Mekong River from Satellite Images. J Earth Sci Clim Change 4: 160. DOI: 10.4172/2157-7617.1000160
Copyright: ©2013 Fleiflea AE. This is an open-access article distributed under the terms of the Creative Commons Attribution License, which permits unrestricted use, distribution, and reproduction in any medium, provided the original author and source are credited.
Select your language of interest to view the total content in your interested language
Share This Article
Recommended Journals
Open Access Journals
Article Tools
Article Usage
- Total views: 17192
- [From(publication date): 12-2013 - Dec 20, 2025]
- Breakdown by view type
- HTML page views: 12127
- PDF downloads: 5065