The Impact of Climate Change and Soil Salinity in Irrigation Water Demand in the Gaza Strip
Received: 07-Aug-2012 / Accepted Date: 27-Sep-2012 / Published Date: 29-Sep-2012 DOI: 10.4172/2157-7617.1000120
Abstract
Aim: The presented work aims to analyze the potential impacts of the temperature and precipitation changes as two main characteristics of climate change in addition to water salinity on the agricultural water demand. Changes in humidity concentration were not evaluated, nor were the changes in wind velocity and solar radiation. The study was carried out on 5 representative crops (Olive, Palm, Grape, Citrus and Guava) that cover around 83% of the orchard farms in Gaza Strip, considering eight simulated climate change conditions.
Methodology: To achieve this goal, CropWat modeling software version 8.0, is used to calculate the reference evapotranspiration rate and crop water requirement under different temperature and precipitation scenarios. Furthermore, a survey was conducted to evaluate the farmer’s current irrigation practices and the impact of water salinity on leaching requirements and production yield.
Result: The study results showed that the increased temperatures by +1°C or +2°C caused an increase of the annual average evapotranspiration by 45mm and 91mm relative to the current climate condition and leading to increase of irrigation requirements by 3.28% and 6.68%, respectively. Considering the increase of temperature +2°C, and decrease of precipitation by 10%, the irrigation requirements will be increased by 8.69% relative to the current scenario. In order to devoid the salinity effect on yield, leaching requirements do not exceed 15% in case of EC value less than 2 dS/m, while it begin to increase rabidly for the EC value over 3 dS/m for grape, citrus and guava and accounted for 250%. Generally, the impact of salinity increase on the irrigation requirements is much higher than the impact of evapotranspiration increase due to the temperature increase by 2°C and 10% precipitation reduction.
Conclusion: Currently, the farmers use excessive amount of irrigation water; higher than the required increase due to the proposed climate change effect. The impact of salinity increase on the irrigation requirements is much higher than the impact of climate change.
Keywords: Gaza strip; Climate change; Irrigation requirements; Salinity and leaching fraction
8702Introduction
Agriculture is by far the largest water-use sector, accounting for about 70% of all water withdrawn worldwide from rivers and aquifers for agricultural, domestic and industrial purposes. In several developing countries irrigation represents up to 95% of all water withdrawn, and it plays a major role in food production and food security [1]. In the arid and semiarid climates, irrigation is often essential to achieve economically viable crop productions. The main expected impacts of global warming will be represented by higher and more variable temperatures, changes in precipitation patterns (lower and more erratic rainfall) and higher frequency of extreme events. With particular regard to the Mediterranean environment, according to climate models, an increase in winter temperature combined with changes in rainfall amount and distribution would be expected [2]. Gaza strip, like any other parts in Mediterranean environment, has a distinct and serious deficit in water, the problem in this area is more clear and serious, and it is related to the water quantity and quality [3-5]. Ground water is the only resource of water while agriculture is the main water consumer in the Gaza Strip with more than 70% of the total groundwater extraction [6]. Ground water is the only resource of water, and many estimates of the annual groundwater recharge in the Gaza strip have been mentioned in different references, all of these references agree on one fact; the annual recharge is less than the extracted quantities for a long time, resulting in a serious mining of the groundwater resources. Simulations of sea water intrusion corresponding to various combinations of groundwater extraction and sea-level rise established that groundwater extraction is the predominant driver of sea water intrusion [7]. The spatial changes of ionic ratios of rCa2+/(rHCO3 -+rSO42-) and the relationship between sodium and chloride in the coastal area in the Gaza Strip indicate that the aquifer experienced seawater intrusion leading to sever increase of salinity in groundwater which currently used for irrigation [5,4,8]. Yet, during the 21st century, the Mediterranean basin is expected to observe: (i) an increase in air temperature of between 2.2°C and 5.1°C; (ii) a decrease in rainfall of between 4% and 27%; (iii) an increase in drought periods related to a high frequency of days during which the temperature would exceed 30°C; and (iv) an increase of the sea level of around 35 cm and saline intrusion [9].
It is forecasted that the Palestinian territories are facing a severe water deficit likely to be exacerbated within the next years due to the consequence of the global warming and excessive use of irrigation water. Changes in climate along the Mediterranean coast have received particular attention in the literature owing to their potential impact on water resources in the region [10].
The farmers use about 20 to 30% excess irrigation water than required for the common cultivated crops. Prudent planning requires that a strong water resources research program be maintained, that decisions about future water planning and management be flexible, and that the risks and benefits of agricultural economy be incorporated into all long-term water planning [7]. Apparently, increased temperatures lead to more groundwater pumping to meet the escalating crop water demand. Annual precipitation rates are deemed likely to fall in the eastern Mediterranean-decreasing 10% by 2010 and 20% by 2050 with an increased risk of summer droughts. The agriculture in the Palestinian territories is the most sensitive to climatic hazards both current and future, this means that agricultural production will be reduced for rain-fed agriculture, the price of vegetables, fruits, and other agriculture products will rise as well, bringing about a further negative effect on marginalized communities [11]. Despite its small area (365 km2) and generally flat terrain, there are also significant variations in the Gaza Strip’s temperate climate; the average seasonal rainfall is 522 mm in the northern Beit Lahia governorate and 225 mm in the southern Rafah governorate [12]. The Gaza Strip experiences hot, dry summers and mild winters, there is already some evidence that global warming is affecting the Gaza Strip [13,14]. This is to imply that, there is an urgent need to address climatic changes on agricultural livelihoods; climatic variables such as temperature and precipitation are essential inputs to agricultural. Thus, it is important to assess the potential effect of climate change, not only the direct effects of climate on crop yields and farm profit, but also the effects of climate change on the effective water requirements and the availability of water for agricultural irrigation [15]. The overall objective of the current research is to review the current irrigation practices and to analyze the potential impact of climate change and water salinity on the agricultural water demand for 5 representative crops. The main climate change factors were mainly the temperature and precipitation change.
Methodology
CROPWAT model
CROPWAT is a computer program that uses the FAO Penman-Monteith model to calculate reference Evapotranspiration (ETo), Crop Water Requirements (CWR) and crop irrigation requirements. Four main datasets are used as inputs in the CROPWAT estimation: climatic, crop, soil and irrigation. Climatic and crop data are obtained from the FAO CLIMWAT database. The climatic data are maximum and minimum temperatures, mean daily relative humidity (in %), daily sunshine (in hours) and wind speed. Gaza city meteorological station located at 34°27E and 31°30N is the source of the climatic data input to the model. The crop parameters include: water stress coefficient (Ks), length of the growing season and critical depletion level. The soil data include total available soil water content and the maximum infiltration rate for runoff estimates in addition to the initial soil water content at the start of the season. The model is used to calculate the crop water requirement for the chosen orchards such as olive, palm, grape, citrus and guava which cover around 83% of the orchards farms in all entire Gaza strips [16]. Additionally, the model is used to simulate the expected changes in agricultural water demand under different climate change scenarios. Water salinity is another factor considered for the calculation of irrigation water requirements to maintain the productivity of the trees at the threshold value.
Farmers data and survey analysis
To define the number of farmers to be surveyed; the following equations were used to calculate the number of potential sample:

Where;
n Sample size
Z Tabulated value of the standard normal distribution (For 99% is 2.58, For 95% is 1.96 and For 90% is 1.65), for the calculation the confidence level was 95% which set the value of “Z” equal to “1.96”.
δ Standard deviation, which calculated through (start) sample of 10 farmers before setting the final number of sample farmers.
D Maximum error, in the sample calculation 5% as a margin of error could be accepted.
While the previous equation calculated the sample size regardless of the population number; which is the total number of farmers cultivating the potential orchards in the potential governorates, the next equation used to finite the population correction of the targeted population.
This equation is used if the population is small- 7957 farmers- then the sample size calculated through the first equation can be adjusted and reduced slightly. This is because a given sample size provides proportionately more information for a small population than for a large population.

Where “n” is the sample size, “n0” is the sample size calculated in the first equation and “N” is the total number of the farmers in the three governorates.
Table 1 summarizes the number of surveyed framers according to the above equations based on the percentage of each orchards type among the total orchards farms in the Gaza Strip.
| Orchards | Olive | Palm | Grape | Citrus | Guava | Total | |
| Valencia | Lemon | ||||||
| Sample No. | 82 | 18 | 11 | 14 | 21 | 8 | 154 |
Table 1: Surveyed farmers distribution number for the selected orchards of the research area.
With respect to the above mentioned number of sample, more than 200 farmers were interviewed and “187” valid questioner were filled. The used questioner contained different data about the farmer as well as measuring the EC value for the irrigation water, but the main goal of the questions was to estimate the irrigation quantity applied by the farmers. The data of the questioner is processed in excel sheet in order to compare it with recommended irrigation requirements by Ministry of Agriculture (MoA) and with the outputs of the CropWat model for each orchards type at various temperature and precipitation rates.
Results and Discussion
Gaza strip climate change indicators
Gaza Strip temperature records in the three decades between 1976 and 2006 showed a trend towards raising temperatures in both the minimum and maximum averages, this increase was clear in the minimum temperature averages more than the maximum temperature averages. As shown in Figure 1, the trend of minimum averages of the three interval time (1976-1985, 1986-1995 and 1996-2006) accounted for 15.91, 16.70 and 17.64°C, respectively. In general, Gaza Strip temperatures analysis between 1976 and 2006 showed a rising trend; in the second decade between 1986 to 1995 comparing to the first decade between 1976 to 1985, the average temperatures showed increase by 0.79°C and 0.29°C for the minimum and maximum temperatures, respectively. In the third decade between 1996 to 2006 comparing to the second decade between 1986 and 1995, the average temperatures showed increase by 0.94 and 0.26°C for the minimum and maximum temperatures, respectively. Overall, temperatures increase in Gaza Strip within the past thirty years was clear by around 1.73 degree in the average minimum temperatures, and around 0.55 degree in the average maximum temperatures of the Gaza Strip. It appears almost certain that climate change will have a negative impact on both Palestinian water resources. It is already known that during the 20th century there was an average increase in annual mean temperature between 1.5 and 4°C for the region. Globally, the mean temperature is expected to increase by an additional 1.8 and 4°C by the end of the 21st century in relative to the 1980-1999 periods [17,18].
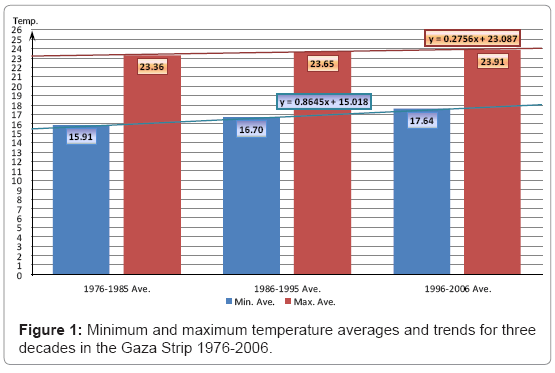
Figure 1: Minimum and maximum temperature averages and trends for three decades in the Gaza Strip 1976-2006.
For Palestine, the temperature is expected to rise by 3.5-5°C by 2071-2100 in comparison to 1961-1990 Alpert et al. [18,19]. The full consequence of temperature and rainfall changes are wide ranging and a variety of studies have described the possible impact of these changes on nearly all aspects of environment and society [17]. Nearly all research in the region confirms that climate change will have a direct effect on regional water resources [20-22]. Temperature analyses by for the period of 1948-2002 reported an increase of 0.013°C per year for the months of July and August and statistically significant warming trends were observed for the decades of 1961-1970 and 1991-2000. For the period of 1964-1994, Ben-Gai et al. [23] observed an increase in both minimum and maximum temperatures. Furthermore, there has been an increase in the number of hot and cool days per year, which implies an increase in temperature extremes. Between the years 1948-1977, August was the hottest month of the year; however, since then July has been observed to be the hottest month, a finding which implies the onset of earlier summers.
Evapotranspiration response to temperature and precipitation changes
Assumptions of climate change scenarios: Different climate change scenarios were applied for the study. The scenarios were formulated based on changing Temperature (T) and Precipitation (P); the other metrological data, soil data and crop data were kept without any changes. The assumed scenarios for the climate change used in the study are:
Temperature change: Increasing temperature for 1 and 2°C while keeping precipitation not changed was first assumption; as the trends of increasing in temperature are highly expected during the current century in the Mediterranean basin countries as well as the Palestinian territories.
Precipitation change: Despite that there is no clear liner trend for the precipitation change, but it is predicted to have decrease in precipitation in the Mediterranean basin countries, and this prediction was harmonized with the precipitation records in the Gaza Strip.
Therefore, and since the increasing in precipitation to a certain level in the Gaza Strip are likely desirable; the decrease in precipitation scenarios only was considered. The combination of the changing in temperature and precipitation resulted in different scenarios as described in the following Table 2.
| T | P | P Aver. | P -5% | P -10% |
| T Aver. | Scenario 0 | Scenario 3 | Scenario 6 | |
| T +1 | Scenario 1 | Scenario 4 | Scenario 7 | |
| T +2 | Scenario 2 | Scenario 5 | Scenario 8 | |
Table 2: The assumed climate change scenarios (temperature increase by 1 and 2 degrees of Celsius associated with 5 and 10% precipitation reduction).
Reference Evapotranspiration rate (Eto)- Cropwat model outputs: Reference Evapotranspiration (ETo) of the studied orchards in the Gaza Strip are listed in Table 3 for the different climatic scenarios; current situation, increase in temperature one degree, increase in temperature two degrees, increase in temperature one degree associated with decrease in rainfall by 5% and 10% and increase in temperature 2 degrees associated with rainfall reduction by 5% and 10%. The precipitation rate is not an essential factor for evapotranspiration rate, therefore the evapotranspiration rate is affected by the increase in temperature. Based on global prediction by the IPCC [18] a 10-30% decrease in annual precipitation is expected by the second half of the 21st century for this region. Bates et al. [17] predicted an approximate 20% decrease in precipitation for the Mediterranean region. Temporal climatic patterns are also likely to be affected, as changes in the region’s climate are expected to produce a truncated but more intense winter rainfall period followed by a longer, drier summer season, the consequences of which are numerous. Using a high resolution model simulated two future climatic scenarios for the region; both scenarios yielded a decrease in future precipitation. This decrease is predicted to occur mostly in the winter and spring seasons, along with an increase in evaporation rates. Therefore, even in areas where precipitation is predicted to increase under the Kitoh et al. 2008 model, such as the Gulf Coast Region, water resources will likely not increase because of the increased rates of evaporation. Normally the evapotranspiration was increased with the increased temperatures if other factors such as humidity, CO2 concentration, solar radiation and wind speed kept constant as proposed in the current research. Snyder et al. [24] reported that, as the oceans and other water bodies warm and evaporate more water into the atmosphere; global humidity is likely to increase. Thus, while climate change is likely to increase air temperature, the effect of higher humidity and CO2 concentration could partially offset the temperature effect on evapotranspiration.
| Temperature | T Ave. | T + 1 | T + 2 |
| Month | ETo (mm/month) | ||
| January | 73.2 | 75.9 | 78.9 |
| February | 79.8 | 82.8 | 85.8 |
| March | 98.7 | 102 | 105.6 |
| April | 124.5 | 128.4 | 132.3 |
| May | 137.1 | 141.3 | 145.5 |
| June | 151.2 | 155.7 | 159.9 |
| July | 164.4 | 169.2 | 173.7 |
| August | 167.7 | 172.5 | 177.3 |
| September | 149.1 | 153.3 | 157.8 |
| October | 121.8 | 125.7 | 129.6 |
| November | 95.1 | 98.4 | 101.4 |
| December | 80.7 | 83.4 | 86.4 |
| Total | 1443.3 | 1488,6 | 1534.2 |
Table 3: Reference evapotranspiration (ETo) respond to the temperature increase by 1 and 2oC on a monthly basis.
CropWat results for the different assumed expect climate change presents clear relation between irrigation water requirements and temperature variations, increase in temperature caused significant increase in the reference evapotranspiration rate. Changing temperature impacts on ETo could vary widely in the Gaza Strip with temperature change. The average actual ETo is 1443 mm, while in the case of increasing 1°C and 2°C, the evapotranspiration account for 1488 and 1534 mm/year. The increase in 1°C and 2°C leads to 3.2% and 6.3% in the evapotranspiration rate.
Without the effects of climate change, rising CO2 will cause an increase in crop Water-Use Efficiency (WUE). However, if temperatures rise, transpirational water use will increase, and WUE will decline. Higher temperatures, and especially less rainfall, would raise the irrigation requirements of crops [25] According to Anderson et al. [26], an evapotranspiration increase of 18.7% resulted from a 3°C rise in air temperature in California with an annual average precipitation of 640 mm and mean temperature about 15°C. While Goyal [27] reported that a 1% temperature increase could increase evapotranspiration by 12.69% in arid regions of Rajasthan, India, where the annual rainfalls varies from 100 to 400 mm and mean temperature varies by about 25°C.
Table 4 presents the irrigation requirements mm/year for the studied orchards in the Gaza Strip as a sequence of reference evapotranspiration increase. The table represents the CropWat model results for irrigation requirements under the real historical climatic data and the irrigation requirements under the different eight assumed climatic changes scenarios in addition to the actual situation presented in Table 2.
| trees | Irrigation Requirements (mm/year) | ||||||||
| T Ave. | T + 1 | T + 2 | T Ave. | T + 1 | T + 2 | T Ave. | T + 1 | T + 2 | |
| P Ave. | P Ave. | P Ave. | P – 5% | P – 5% | P – 10% | P – 10% | P – 10% | P – 10% | |
| Olive | 686 | 707 | 729 | 687 | 710 | 732 | 693 | 716 | 739 |
| Palm | 1022 | 1060 | 1100 | 1033 | 1071 | 1111 | 1055 | 1093 | 1133 |
| Grape | 584 | 606 | 627 | 590 | 611 | 633 | 602 | 623 | 645 |
| Citrus | 656 | 676 | 699 | 658 | 681 | 704 | 670 | 693 | 717 |
| Guava | 1036 | 1071 | 1106 | 1041 | 1075 | 1110 | 1049 | 1084 | 1118 |
Table 4: Average irrigation water requirements (mm/year) for the studied orchards for different scenarios.
There is an average predictable decrease in precipitation by 20% within the close future decades, therefore the impact of decreases in precipitation by only 5% and 10% were considered as a possible decrease in the next few years. The average responds of irrigation requirements to the precipitation decrease by 5% and 10% was by an average of 0.45% and 1.73% respectively. The overall increase of water requirements for Olive, Palm, Grape, Citrus and Guava trees considering the worst scenario (T increased by 2°C and precipitation reduction by 10%) are accounted for 7.7%, 10.9%, 10.4%, 9.3% and 7.9%, relative to the actual temperature and precipitation, respectively.
Agriculture constitutes 25% of the total export revenues, 9% of the GDP and employs around 20 % of the Palestinian labor force (www. pcbs.gov.ps). Agricultural production in the Palestinian Territories has already been affected by recent droughts and climate predictions suggest that these will become more pronounced over time. Thus, a great challenge for the Palestinian Authority in the coming decades will be the task of increasing food security (by domestic production and/ or imports) in conditions of increased water stress [28]. Production systems in marginal areas with respect to water face increased climatic vulnerability and risk under climate change, due to factors that include, for instance, degradation of land resources through soil erosion, overextraction of groundwater and associated salinization, and over-grazing of dry land. Water plays a crucial role in food production regionally and worldwide. On the one hand, more than 80% of global agricultural land is rain-fed; in these regions, crop productivity depends solely on sufficient precipitation to meet evaporative demand and associated soil moisture distribution. At the same time, during this century, climate change may further reduce water availability for global food production, as a result of projected mean changes in temperature and precipitation regimes, as well as due to projected increases in the frequency of extreme events, such as droughts and flooding [29]. Climate changes are expected to affect plant growth and agricultural production [15] as a consequence of the effect of temperature on plant phenology, and in turn crop cycle length, as well as of CO2 concentration on carbon assimilation and water use efficiency [30]. Nevertheless, the simulation of crop growth and water requirements is complicated by the high uncertainty both on the future variability of climatic parameters and on the combined effect of their variation on plant response.
Leaching requirements and farmers irrigation practices
Crop water requirements depend upon several climatic parameters, including rainfall, radiation, temperature, humidity and wind speed. Therefore, any change in climatic parameters due to global warming will also affect evapotranspiration and as a consequence will affect the irrigation water requirements [27]. The aridity of climate regulates the modern salt accumulation in hydromorphic landscapes: the higher the aridity, the stronger the accumulation of salts in the upper horizons of salt-affected soils. The aridization of the climate may have different effects on the degree of soil salinity and on the distribution of salts in the soil profiles [31].
More than 185 farmers cultivating orchards were surveyed in the study area, one of the main aims of the farmers’ survey was to measure the electrical conductivity (EC) of the used irrigation water throughout the survey using field portable EC device (HACH-HQ 40d field case), and to estimate the applied irrigation quantities. Unfortunately, farmers in the surveyed area have never measured the used quantities of irrigation water. Flow meters were not installed on the irrigation wells. Therefore data is collected about the pump capacity and irrigation scheduling applied by the farmers to calculate the irrigation water quantity that have been pumped for irrigating their orchards. For each orchards types, farmers were categorized depend on the used irrigation water EC value, then the average irrigation quantities applied by each farmers group were calculated. The processed data of applied irrigation quantities were compared with the recommended result of CropWat for each orchards type in addition to the recommended excess of leaching water to maintain the orchards productivity at the threshold value.
Since salinity control is critical to obtaining good yields for water in the moderate to high salinity range (>1.5 dS/m) which is the case in the most areas in the Gaza Strip, it is recommended to use the EC value for threshold yield potential [32]. Table 5 shows the studied orchards tolerance and yield potential as influenced by irrigation water salinity (ECw) or soil salinity (ECe). To maintain the highest productivity level at 100%; the threshold ECw values are 2.5, 2.7, 1.0, 1.1 and 1.7 dS/m for the olive, palm, grape, citrus and guava, respectively.
| Potential Yield | 100% | 90% | 75% | 50% | 0% | |||||
| ECe | ECw | ECe | ECw | ECe | ECw | ECe | ECw | ECe | ECw | |
| Olive | 3.75 | 2.5 | 6.3 | 4.2 | 10.2 | 6.8 | 16.8 | 11.2 | 28.5 | 19 |
| Palm | 4 | 2.7 | 6.8 | 4.5 | 11 | 7.3 | 18 | 12 | 32 | 21 |
| Grape | 1.5 | 1 | 2.5 | 1.7 | 4.1 | 2.7 | 6.7 | 4.5 | 12 | 7.9 |
| Citrus | 1.7 | 1.1 | 2.3 | 1.6 | 3.3 | 2.2 | 4.8 | 3.2 | 8 | 5.3 |
| Guava | 2.5 | 1.7 | 3.8 | 2.6 | 6 | 4 | 9.4 | 6.3 | 16 | 11 |
Table 5: Orchards tolerance and yield potential as influenced by irrigation water salinity (ECw) and soil salinity (ECe) source: FAO website, salinity problems.
After calculating the irrigation requirements for the studied orchards using the CropWat modeling software, the leaching requirements for different level of salinity had been calculated to maintain productivity at the level of threshold yield potential. Increase in EC values cased a significant increase in irrigation water requirements, the excess of irrigation water requirements was higher in the sensitive and the moderately sensitive orchards, while the increased irrigation water requirements was lower for the tolerance and the moderately tolerance orchards.
Olive orchards: The recommended irrigation quantity for the olive orchards depending on the CropWat results was 686 mm/year. Most of the surveyed farmers applied the recommended amount of irrigation water or apply excessive amount depending on the salinity levels of their water. Despite that olive orchards are known as tolerance trees, it is still required to add certain amount of leaching water in order to maintain the trees productivity. Generally, most of the olive orchards farmers didn’t reach the recommended amount of irrigation water including the required leaching quantities. The farmers who irrigate with water of ECw values less than 5 dS/m are in coincidence with the model results. High water use in comparison to the model results is noticed for farmer having irrigation water higher than 5 dS/m. As shown in Figure 2, the current practice showing that, the irrigation water is 1150 mm/year, while the model results (CropWat+LR) accounted for 1008 mm/year in case of ECw greater than 5 dS/m.
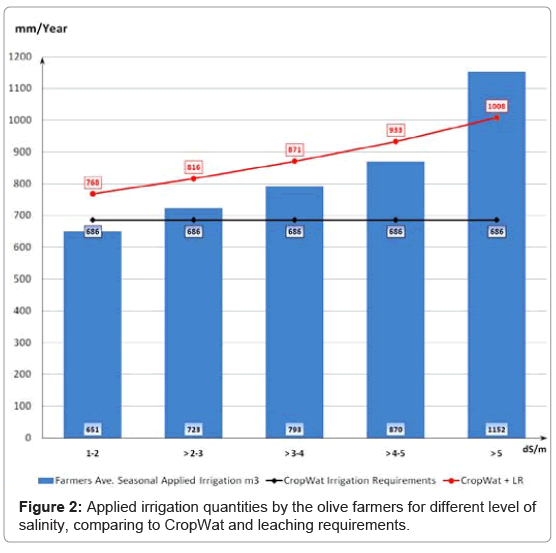
Figure 2: Applied irrigation quantities by the olive farmers for different level of salinity, comparing to CropWat and leaching requirements.
Palm trees: The recommended irrigation quantity for the palm trees depending on the CropWat results is 1060 mm/year. As shown in Figure 3 most of the surveyed farmers applied excessive amount of water. The current practices are 1536, 1666, 2040, 1853 and 2269 mm/year. While the CropWat model including leaching requirements (CropWat+LR) shows less values and account for 1172, 1251, 1325, 1410 and 1516 mm/year for irrigation water with ECw values 1-2, >2-3, >3-4, >4-5 and >5, respectively.
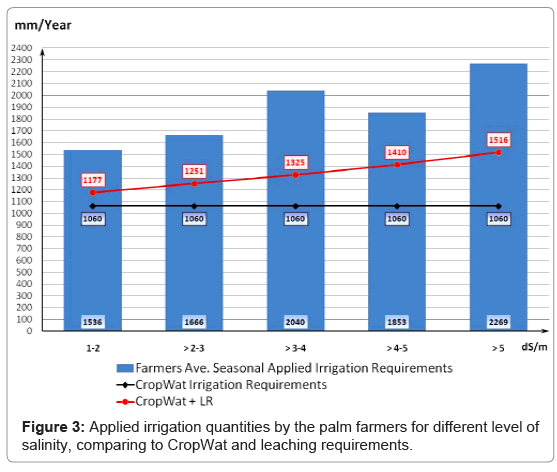
Figure 3: Applied irrigation quantities by the palm farmers for different level of salinity, comparing to CropWat and leaching requirements.
Grape farmers: Generally, grapes cultivated in two areas in the Gaza Strip, the first one is the southern west of Gaza city where farmers didn’t use to irrigate the grape frequently especially for the old trees, and exceptionally they irrigate it between one to three times in February up to April depending on the rain season. Consequently grape in Gaza city governorate is considered as rain-fed grape, and its irrigation requirements were neglected. The second area in the Gaza Strip where grape is cultivated widely is the eastern area of Khan Younis governorate, the grape in this area is extensively irrigated despite the extreme shortage of water in the area. The recommended irrigation quantities for the grapes in Khan Younis governorate depending on the CropWat results is 584 mm/year. As shown in Figure 4 most of the surveyed farmers applied excessive amount of water and measured to be 1551, 1776, 2184, 2151 and 2393 mm/year. While the model results including the leaching requirements account for 672, 794, 975, 1250 and 1752 mm/year for irrigated farms with ECw values; 1-2, >2-3, >3-4, >4-5 and >5, respectively.
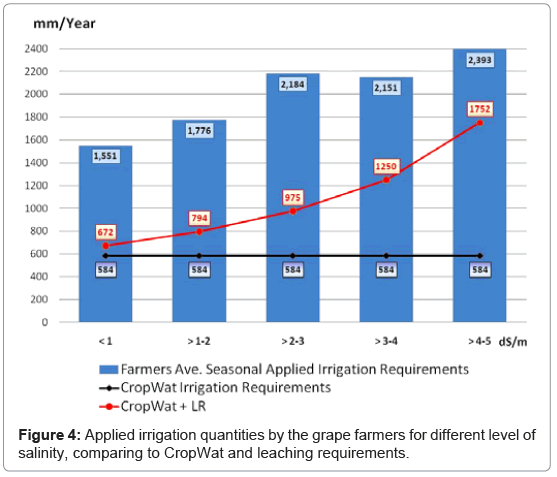
Figure 4: Applied irrigation quantities by the grape farmers for different level of salinity, comparing to CropWat and leaching requirements.
Citrus farmers: Citrus group are mainly cultivated in the Dair Al- Balah, Gaza and north Gaza governorates. The average recommended irrigation quantity for the citruses in Gaza and Dair Al-Balah governorates depending on the CropWat results is 657 mm/year. Figure 5 shows that most of the surveyed farmers applied less amount of water when the applied irrigation quantities compared to the CropWat results including the leaching requirements. The current practices are; 1135, 1143, 1244 and 1303, while the model results including leaching requirements (CropWat+LR) account for 1018, 1242, 1597 and 2234 for irrigation water ECw values; 1-2, >2-3, >3-4, >4-5 and >5, respectively.
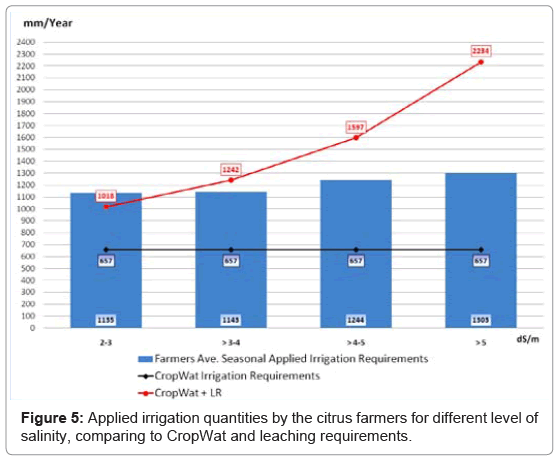
Figure 5: Applied irrigation quantities by the citrus farmers for different level of salinity, comparing to CropWat and leaching requirements.
Guava farmers: Guava orchards are mainly cultivated in the Dair Al-Balah and Khan Yuonis governorates. The average recommended irrigation quantities for the Guava trees depending on the CropWat results was 1040 mm/year.
Most of the surveyed farmers as shown in Figure 6 applied excessive amount of water except for the fields irrigated with water has ECw values less than 1 dS/m. Farmers current practices are 1166, 1800, 2309, 3825, 3548 and 5572, while the model results including the leaching requirements is account for 1113, 1196, 1300, 1414, 1560 and 1737 mm/year for irrigation water ECw values; 1-2, >2-3, >3-4, >4-5 and >5, respectively.
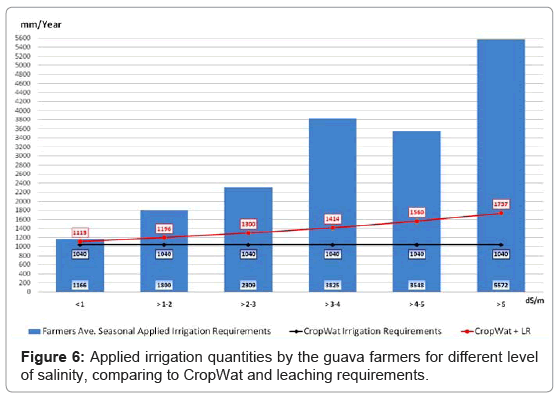
Figure 6: Applied irrigation quantities by the guava farmers for different level of salinity, comparing to CropWat and leaching requirements.
Particularly; most of the farmers in the west of Khan Yuonis governorate applied huge excessive amount of irrigation water, they tripled the required irrigation for the guava trees including the leaching requirements.
Conclusion
The results presented in the study are for certain trees, it provides a preliminary idea about the potential impact of climate change on agricultural water demand, taking into consideration that these results present the impact on six different trees only, which means that the deficit in agricultural water demand will become greater when considering the impact of climate change on all the irrigated agriculture.
There is an increase in the minimum temperatures by +0.79 and +0.94°C in the last decades, and there is an increase in the maximum temperatures by +0.29 and +0.26°C in the same period. Normally the evapotranspiration was increased with the increased temperatures; increasing of +1°C or +2°C cased an increase of the annual average evapotranspiration by 45 and 91mm, therefore the irrigation requirements were increased with an average of 3.28% and 6.68% for the total cultivated area of the studied orchards. In the worse scenario of increasing temperatures +2°C, and decreasing precipitation by 10%, the irrigation requirements will be increased by 8.69%.
Concerning salinity impact, the leaching requirements were calculated for the studied orchards. All leaching requirements exceed 15% when EC values are less than 2 dS/m. While the leaching requirements begin to increase rabidly after the EC value passed 3 dS/m in the moderately sensitive orchards like grape, citrus and guava, and it will increase steadily in the tolerant orchards like olives and palm. The impact of salinity increase on the irrigation requirements is much higher than the impact of climate change. As a matter of fact, water and soil salinity likely to be increased in parallel with the temperatures increase as a result of rising up the evapotranspiration, consequently irrigation demand will be increased dramatically.
References
- Billib M, Holzapfel EA, Fernandez-Cirelli A (2009) Sustainable Water Resources Management For Irrigated Agriculture In Latin America. Chilean J Agricul Resear 69: 3-5.
- Mimi ZA, Jamous SA (2010) Climate change and agricultural water demand: Impacts and adaptations. Afr J Environ Sci Technol 4: 183-191.
- Shomar B, Fakher SA, Yahya A (2010) Assessment of Groundwater Quality in the Gaza Strip, Palestine Using GIS Mapping. J Water Resour Protect 2: 93-114.
- Palestinian Water Authority (PWA) (2000, 2003, 2004) PWA publications Palestine.
- Qahman K, Larabi A, Ouazar D, Naji A, Cheng AHD (2009) Optimal Extraction of Groundwater in Gaza Coastal Aquifer. J Water Resour Protect 4: 249-259
- Palestinian Central Bureau of Statistics (PCBS) (2005, 2006, 2007, 2009 and 2010) PCBS Publications Palestine.
- Loáiciga HA, Pingel JT, Elizabeth GS (2012) Sea Water Intrusion by Sea-Level Rise: Scenarios for the 21st Century. Ground Water. Volume 50: 37-47.
- Al-Khatib M, Al-Najar H (2011) Hydro-geochemical characteristics of groundwater beneath the Gaza Strip. J Water Resour and Protect 3: 341-348.
- Rosa R, Marques A, Nunes ML (2012). Reviews in Aquaculture.Vol 4: 163-177.
- Moratiel R, Durán JM, Snyder RL (2010) Responses of reference evapotranspiration to changes in atmospheric humidity and air temperature in Spain. Climate research 44: 27-40.
- Mason, Michael, Mimi, Ziad, Mark Z (2010) Climate Change Adaptation Strategy and Programme of Action for the Palestinian Authority. Jerusalem 88.
- Palestinian Water Authority (2007) Rainfall Data in Gaza Strip. Ramallah PWA.
- El-Kadi A (2005) Global warming: a study of the Gaza temperature variations in the period 1976-1995. Islamic University Magazine 13: 1-19.
- Krichak SO, Alpert P, Bassat K, Kunin P (2007) The surface climatology of the eastern Mediterranean region obtained in a three member ensemble climate change simulation experiment. Adv Geosci 12: 67-80
- Schlenker W, Hanemann WM, Fisher AC, (2005). Water availability, degree days and the potential impact of climate change on irrigated agriculture in California. Climatic Change 81:19-38.
- Palestinian Central Bureau of Statistics and Ministry of Agriculture (2011). Agriculture Census 2010.
- Bates B, Kundzewicz ZW, Wu S, Palutikof J (2008) Climate change and water. Technical paper of the IPCC. Geneva 210.
- Intergovernmental Panel on Climate Change (2007) Climate Change and Water. Technical Paper IV Geneva: IPCC.
- Alpert P, Krichak SO, Shafir H, Haim D, Osetinsky I (2008) Climatic trends to extremes employing regional modeling and statistical interpretation over the E. Mediterranean. Global Planet Change 63: 163-170.
- Alpert P (2004) The water crisis in the E. Mediterranean – and relation to global warming.
- Ben-Gai T, Bitan A, Manes A, Alpert P (1998) Spatial and temporal changes in rainfall frequency distribution patterns in Israel. Theor Appl Climatol 61: 177-190.
- Pe’er G, Safriel UN (2000) Climate change: Israel national report under the United Nations framework convention on climate change: impact, vulnerability and adaptation. Israel Ministry of Environment.
- Ben-Gai T, Bitan A, Manes A, Alpert P (1994) Long-term changes in annual rainfall patterns in southern Israel. Theo Appl Climatol 49: 59–67.
- Snyder RL, Moratiel R, Song Z, Swelam A, Jomaa I, et al. (2011) Evapotranspiration response to climate change. Acta Hort.
- Allen LH (1999) Evapotranspiration Responses of Plants and Crops to Carbon Dioxide and Temperature. J Crop Product 2.
- Anderson J, Chung F, Anderson M, Brekke L (2008) Progress on incorporating climate change into management of California’s water resources. Clim Change 87: 91-108
- Goyal RK (2004) Sensitivity of evapotranspiration to global warming: a case study of arid zone of Rajasthan (India). Agric Water Manag 69: 1-11.
- Kafle HK, Bruins HJ (2009) Climatic trends in Israel 1970-2002: warmer and increasing aridity inland. Climatic Change 96: 63-77.
- Rosenzweig C, Tubiello FN, Goldberg R, Mills E, Bloomfield J (2002) Increased crop damage in the US from excess precipitation under climate change. Global Environ Chang 12: 197–202.
- Olesen JE, Bindi M, (2002) Consequences of climate change for European agricultural productivity, land use and policy. Eur J Agron 16: 239-262.
- Pankova Y, Konyushkova M, Luo G (2010). Effect of climate on soil salinity in subboreal deserts of Asia. 1-9.
- Rubino P, Stelluti M, Stellacci MA, Armenise E, Ciccarese A, et al. (2012) Yield response and optimal allocation of irrigation water under actual and simulated climate change scenarios in a southern Italy district. Italian J Agronomy.
Citation: Ashour EK, Al-Najar H (2012) The Impact of Climate Change and Soil Salinity in Irrigation Water Demand in the Gaza Strip. J Earth Sci Climate Change 3: 120. DOI: 10.4172/2157-7617.1000120
Copyright: ©2012 Ashour EK, et al. This is an open-access article distributed under the terms of the Creative Commons Attribution License, which permits unrestricted use, distribution, and reproduction in any medium, provided the original author and source are credited.
Select your language of interest to view the total content in your interested language
Share This Article
Recommended Journals
Open Access Journals
Article Tools
Article Usage
- Total views: 20733
- [From(publication date): 7-2012 - Dec 22, 2025]
- Breakdown by view type
- HTML page views: 15559
- PDF downloads: 5174