In Situ Evaluation of Physiological Activity and Mitochondrial Dysfunction via Novo Label-Free Measures Based on Fluctuation of Image Gray Values
Received: 25-Feb-2016 / Accepted Date: 14-Mar-2016 / Published Date: 21-Mar-2016 DOI: 10.4172/2155-9872.1000308
Abstract
Characteristics of spatiotemporal fluctuation of gray values at a single-pixel level within bright field, label free image of a cell are explored in a variety of physiological and mitochondrial dysfunction states. From these fluctuations, the gray level information entropy (GLIE) is calculated and its derivative measures such as standard deviation, autocorrelation and periodic aspect are analyzed. This is realized by a user-friendly combination of common bright field microscopy and a unique imaging dish, wherein cells are individually held untethered, each within a picoliter volume optical chamber in an array, which allows repeatable spatiotemporal observation before, during and after bio-manipulation in situ, at a single-cell resolution, while in a population. GLIE fluctuation measures were exploited to demonstrate the gradual dying process of serum-deprived cells. Furthermore, these measures were realized in the evaluation of cell response to Phorbol Myristic Acetate (PMA), triiodothyronine (T3) thyroid hormone and mild hypothermia, and three different mitochondrial inhibitors as well: rotenone, carbonyl cyanide m-chlorophenyl hydrazine (CCCP) and oligomycin. The GLIE fluctuation-based measures demonstrated the ability to (a) significantly distinguish cellular response to all six mediators, and (b) identify subgroups of cells according to their response to mild hypothermia. On the whole, employment of high contrast microscopy approaches, i.e., Phase Contrast (PC) and Differential Interference Contrast (DIC), for tracing cellular events via the spatiotemporal fluctuation measures, did not show noticeable advantages over simple Bright Field (BF) microscopy.
Keywords: Fourier transforms; Image analysis; Label-free; Cytometry; Mitochondrial dysfunction; Dissipated energy; UCPs
Introduction
Mitochondrion as a pluripotent organelle controls cell death as well as several aspects of cell survival, including physiological metabolism, stress responses and cell death. The involvement of mitochondria in both vital and lethal processes is crucial for the development and for the maintenance of adult tissue homeostasis [1].
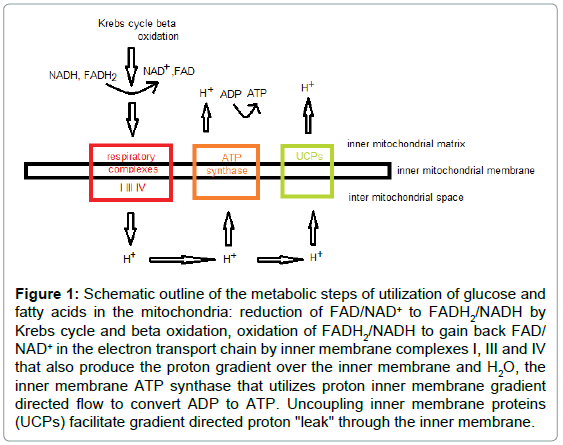
In eukaryotes, cellular metabolic regulation is largely dependent on mitochondria, which play an important role in energy homeostasis by metabolizing glucose and derivatives of free fatty acids and producing ATP and heat [2]. The major function of mitochondria is to convert energy to ATP through oxidative phosphorylation (OXPHOS) process, that depends on coupling between oxidation of NADH and FADH2 by respiratory complexes I, III, and IV, and phosphorylation of ADP to ATP. OXPHOS coupling is mediated by proton gradient over the inner mitochondrial membrane that is generated by the respiratory complexes electron transport chain [3]. Uncoupling mechanisms, which create "proton leak" over the inner mitochondrial membrane, facilitate mitochondrial heat production, and play a cardinal role in energy expenditure and temperature homeostasis in mammals [4,5]. Mitochondrial function and uncoupling phenomena are schematically presented in Figure 1.
Figure 1: Schematic outline of the metabolic steps of utilization of glucose and fatty acids in the mitochondria: reduction of FAD/NAD+ to FADH2/NADH by Krebs cycle and beta oxidation, oxidation of FADH2/NADH to gain back FAD/ NAD+ in the electron transport chain by inner membrane complexes I, III and IV that also produce the proton gradient over the inner membrane and H2O, the inner membrane ATP synthase that utilizes proton inner membrane gradient directed flow to convert ADP to ATP. Uncoupling inner membrane proteins (UCPs) facilitate gradient directed proton "leak" through the inner membrane.
In recent years the characterization of Uncoupling Proteins (UCPs) and their role in energy expenditure, thermoregulation and other physiologic conditions like neoplastic cell metabolism is under intensive investigation [4-9]. Mitochondrial dysfunction conditions are related to a wide area of clinical abnormalities: neurodegenerative diseases (like Alzheimer's disease, Parkinson's disease, amyotrophic lateral sclerosis, Huntington's disease) [10,11], aging [12], Autism [13], Chronic fatigue syndrome [14], cancer [15], skin diseases [16], insulin resistance [3] and more.
Mitochondrial dysfunction is usually referred to as the decreased ability to generate ATP by OXPHOS, but other less common mitochondrial functional abnormalities, like in reactive oxygen species generation and detoxification, in regulation of calcium, in biogenesis and transport of the organelles, are also included in the wide definition of mitochondrial dysfunction conditions [17].
For measuring mitochondrial activity in individual intact cells as a basis for mitochondrial dysfunction analysis, two main groups of parameters: potential and flow may be evaluated [17]:
Potential: mitochondrial inner membrane electrical potential is usually measured with fluorescence probes. That is the most common and relatively simple technique for monitoring mitochondrial function in intact cells at single-cell level. The most reliable and useful probes are: TMRM (tetramethylrhodamine methyl ester), TMRE (tetramethylrhodamine ethyl ester) and R123 (rhodamine 123) [17]. TMRE and R123 were found to inhibit respiration to some extent, while the use of TMRM probe at low concentration was not found to inhibit respiration [18].
Flow: evaluation of proton flow by measuring oxygen consumption rate (using Clark-type oxygen electrode and chamber, or oxygendependent fluorescence quenching) and ATP production.
These methods rely on fluorescence microscopy, oxygen monitoring and have known disadvantages, such as bleaching, interference of exogenous fluorophores with hosting cell physiology and a relatively complex set-up for oxygen monitoring in a single-cell microscopic measurement system. As a consequence, less interfering, label-free in vivo and in vitro cytometric methods for metabolic and mitochondrial functional evaluation gain more and more interest.
Non-invasive in vivo Magnetic Resonance Spectroscopy (MRS) became a powerful tool for mitochondrial functional investigations, though still lacking enough spatial and temporal resolution due to high complexity and long acquisition times [19,20]. A simpler cytometric tool that relies on pixel-based analysis of microscopic bright field computerized images affords definition of characteristic features of gray value distribution within an image and has been utilized as a labelfree cytometric tool.
Haralick's indices of gray-level co-occurrence matrix (GLCM) [21] have been evaluated for cellular senescence [22], apoptosis [23] and activation of lymphocytes [24] in post-fixated stained cells. Wiedemann et al. [25] applied information entropy indices of image gray level spatial distribution of flow cytometry cells for viability evaluation. Their experimental system for investigation of live non-stained cells, lack the ability for a single-cell resolution and time-resolved analysis of the information entropy data.
In our previous work [26] Bright Field (BF) microscopic image gray level information entropy indices of cells were mainly evaluated for their time-dependent fluctuations. New parameters were defined based on the temporal fluctuations of image gray level information entropy of cells that were held in an imaging-dish-based live cell array (ID-LCA), and were examined at single cell resolution. Gray level temporal fluctuation parameter results in live, as compared to dead cells, were significantly different – enabling accurate diagnosis of cell viability state and high sensitivity/specificity values.
On the basis of these unequivocal results obtained by testing extreme cellular physiologic conditions of life and death, we next wish to apply the use of image gray value spatial-temporal fluctuation analysis parameters to evaluate distinct metabolic conditions. In addition to Gray Level Information Entropy (GLIE) fluctuation parameters [26], Average Standard Deviation of Entropy (ASDE) and Average Autocorrelation (AA), new fluctuation parameters based on discrete Fourier transform (DFT) analysis of GLIE temporal changes will be used: Low Frequency Average Power (LFAP), High Frequency Average Power (HFAP), and Energy Expenditure Evaluation (EEE).
First we analyzed time-dependent results of gray level fluctuation parameters of gradually dying cells at single cell resolution, to reveal if the wide diversity of parameter values between live and dead cells that was observed in our previous work [26], could fit a time-dependent gradual change pattern that may be attributed to gradual metabolic deterioration.
Next, we evaluated gray level fluctuation parameter response to three hyper-activation cellular states induced by Phorbol Myristic Acetate (PMA), triiodothyronine (T3) thyroid hormone and mild hypothermia and three reduced metabolic states due to mitochondrial dysfunction induced by three different mitochondrial inhibitors of the ATP production process. Furthermore, within the framework of this study, the ability of two common transmission light microscopy: Differential Interference Contrast (DIC) microscopy, and Phase Contrast (PC), to improve observation based on the analysis of gray level fluctuation parameters, were comparatively examined in reference to Bright Field (BF) microscopy.
Materials and Methods
Materials
Complete Medium (medium): RPMI-1640, DMEM medium, heat-inactivated fetal calf serum (FCS), penicillin, streptomycin, glutamine, sodium pyruvate and HEPES and Trypsin-EDTA solution B were obtained from Biological Industries (Kibbutz Beit Haemek, Israel). Propidium Iodide (PI), Tetramethylrhodamine methyl ester perchlorate (TMRM), Phorbol myristate acetate (PMA), Carbonyl cyanide m-chlorophenyl hydrazone (CCCP), Oligomycin, Rotenone and Triiodothyronine (T3) were obtained from Sigma-Aldrich (St. Louis, MO, USA).
Cell lines: Human pro-monocytic U-937 cells (ECACC, UK) were maintained in RPMI-1640 medium supplemented with 10% FCS, 100 U/ml penicillin, 100 μg/ml streptomycin, 2% glutamine, 2% sodium pyruvate and 2% HEPES. Cells were maintained in completely humidified air with 5% CO2 at 37°C. Before use, exponentially growing cells were obtained, washed, and suspended in PBS at a concentration of 1.5-2.0 × 10⁶ cells/ml.
Petri dish-based LCA and related operations: A homemade imaging dish was created by embedding hexagonal honeycomb array of PicoWells (PWs) (20 μm diameter and 10 μm depth) on the 175 μm glass bottom of the Imaging Dish CG (175 ± 15 μm thickness, 18 mm diameter) (zell-kontakt GmbH, Nörten-Hardenberg, Germany) [27]. For cell loading, 40 μL of cell suspension (2.5 × 10⁶ cells/ml) in PBS or HEPES buffer, were loaded on top of the array and cells were allowed to settle by gravity for 5-10 min. Then, 500 μL of buffer was added gently to the medium exchange region around the array. The imaging dish was mounted on the microscope stage and measured.
Treatment of U-937 cells with rotenone, CCCP, oligomycin and T3: U-937 pro-monocyte cells were washed, suspended in HEPES buffer (0.1M HEPES, pH 7.4; 1.4M NaCl; 25mM CaCl2) and loaded on the array. TMRM (final concentration 50nM) was added to the cells within the PW array and fluorescence and bright field images were acquired. Excitation filter was 530-550 nm, dichroic mirror 570 nm long pass, and emission filter 590 nm. Upon completion of TMRM and fluctuation gray level parameter measurement in the cells, rotenone 0.2 μM, CCCP 50 μM, oligomycin 5 μg/ml or T3 3 μg/ml were added to the HEPES buffer and cells were incubated for 30 min at 37°C 5% CO2. At the end of incubation, TMRM and fluctuation gray level parameters were measured again in the same cells.
Treatment of U-937 cells with PMA: U-937 pro-monocyte cells were incubated in completely humidified air with 5% CO2 at 37°C for 24 h, in tissue culture flasks containing complete medium in the presence of 1 ng/ml phorbol myristic acetate (PMA) to induce differentiation into monocyte-macrophage-like cells.
Induction of gradual cell death: Gradual cell death was induced by serum deprivation. Cells were incubated for 48 h in incomplete RPMI- 1640 (without FCS), then washed, suspended in HEPES buffer (0.1M HEPES, pH 7.4; 1.4M NaCl; 25mM CaCl2) and loaded on the array for follow up at single-cell resolution. Cell viability and plasma membrane integrity were evaluated by staining with PI. PI (final concentration 2.5 μg/ml) was added to the cells within the PW array and incubated for 10 min in the dark at room temperature. Excitation filter was 470-490 nm, dichroic mirror 505 nm long pass, and emission filter 510-530 nm.
Measurement system
Microscope: Images were acquired using a motorized Olympus inverted IX81 microscope (Tokyo, Japan). The microscope is equipped with a sub-micron Marzhauser-Wetzlar motorized stage type SCANIM, with an Lstep controller; (Wetzlar-Steindorf, Germany) and a filter wheel, including fluorescence cube (excitation filters, dichroic mirrors, and emission filters, respectively) all filters were obtained from Chroma Technology Corporation (Brattleboro, VT). A ×100 oil objective NA=1.35 and ×40 objective NA=0.60 were used without oil immersion, since its density tends to fluctuate and consequently the intensity of light propagates through it as well [28]. Nevertheless, quality of the study was not mitigated with this approach, as tracking pixel-based fluctuation was the purpose, rather than image-analysisbased investigation. Furthermore, the data was binned later during image processing.
When using Phase contrast (PC) microscopy and Differential Interference Microscopy (DIC), ×40 NA=0.6 air objectives were used. A microscope halogen 12 V/100 W lamp was used as a light source with a control box which diminishes intense electrical noise and heat from the microscope frame.
Image/data acquisition: A 12-bit cooled, highly sensitive ORCA II C4742-98 camera (Hamamatsu, Japan) was used for image and data acquisition. Image acquisition time was 1 ms, in 16-bit TIF format, each having 1344 × 1024 pixels, and a physical dimension of 87 × 66.5 μm at ×100 magnification and 218 × 166 μm at ×40 magnification on the microscope working plane. Illumination of the sample was synchronized with acquisition time using a controllable electronic shutter. Each image was acquired 200 times successively at 0.5 second intervals.
Image processing: Acquired stacks of 200 16-bit TIF images were used for calculation of GLIE, using Matlab R2013a software (MathWorks Inc. Natick, MA, USA) and 12-bit images underwent simple conversion of binning 6 using Matlab software (12-bit image with 4096 possible gray values was converted to 682 possible gray value image by reducing six successive gray values to one new gray value).
Gray Level Information Entropy (GLIE) calculation formula used was:
 (1)
(1)
where Pi stands for the occurrence of specific gray level value i. ΣPi = 1 and N is the number of different gray values, both within the inspected field. For the sake of clarity, from here on, the expression Entropy will stand for GLIE.
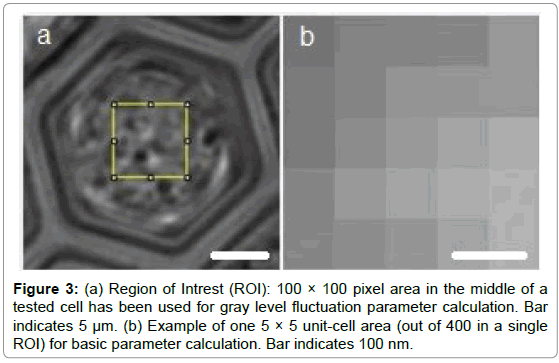
Practically speaking, in this study the spatiotemporal aspect of GLIE is of interest. To that end, a region of interest (ROI) consisting of 100 × 100 pixels at the center of the acquired PW image was defined for processing. Each field of view was acquired 200 times at 0.5 second intervals, and indexed by its serial time point (1 to 200), all together yielding the temporal aspect of GLIE within a ROI. Next, the spatial aspect of GLIE within the ROI was examined by dividing the 100 × 100 pixels of a ROI into 400 subgroups, each comprised of 5 × 5 pixels, from which the 25 pixel-based spatial GLIE (GLIE25) was calculated for each of the 200 time points. Hence, for each time point a GLIE25 map was compiled from 400 GLIE25 values, reflecting the spatial distribution aspect of GLIE within a ROI.
ROIs were chosen at the image center of a cell occupying a PW for investigation of cells within the PWs. From this spatiotemporal data, the following measures were calculated:
Space Averaged temporal Standard Deviation of Entropy (ASDE): Determined by calculating the temporal SD of 200 time serial GLIE25 values (SD25), yielding 400 values of SD25. Then, the average of these 400 SD25 values is defined as the ASDE value of a ROI.
Space Averaged Autocorrelation (AA): Consisting of two-step calculations.
First: calculation of A25, the time autocorrelation of 200 GLIE25 values utilizing the one-lag time unit autocorrelation (r) formula (MathWorks Inc. Natick, MA, USA):
 (2)
(2)
where, N is the total number of GLIE25 measurements, i.e., 200, performed on the same subgroup of 5 × 5 pixels, t is the serial number of a single GLIE25 measurement (one out of 200), xt is the GLIE25 value of the t measurement, xt+1 is the succeeding GLIE25 value, i.e., of the t+1 measurement and  is the average GLIE25 value taken over the 200 measurements.
Second: averaging these A25 time correlation values over the 400 unit cells within a ROI.
The power spectrum of GLIE was calculated by applying Discrete Fourier Transform (DFT) analysis on the time dependent GLIE discrete values, (using Matlab R2013a software, MathWorks Inc. Natick, MA, USA), from which the newly proposed measures, LFAP, HFAP and EEE were calculated as follows:
Low Frequency Average Power spectrum amplitude (LFAP): A newly proposed measure determined by calculating the average DFT power amplitudes of the frequency range ≤0.1 Hz (typical range of frequencies with periodic changes in live cells) of 200 time serial GLIE25 values (LFAP25), yielding 400 values of LFAP25. Then, the average of these 400 LFAP25 values is defined as the LFAP value of a ROI.
High Frequency Average Power spectrum amplitude (HFAP): A newly proposed measure determined by calculating the average DFT power amplitudes of the frequency range >0.5 Hz (typical range of frequencies with random changes in live cells) of 200 time serial GLIE25 values (HFAP25), yielding 400 values of HFAP25. Then, the average of these 400 HFAP25 values is defined as the HFAP value of a ROI.
Energy Expenditure Evaluation (EEE): A newly proposed measure determined by the summation of the entire spectrum frequencies multiplied by their corresponding powers  where k is the number of cycles in the DFT analysis, N is half the number of DFT analysis results (200/2 results) fk and Pk are the corresponding frequencies and powers of the k values.
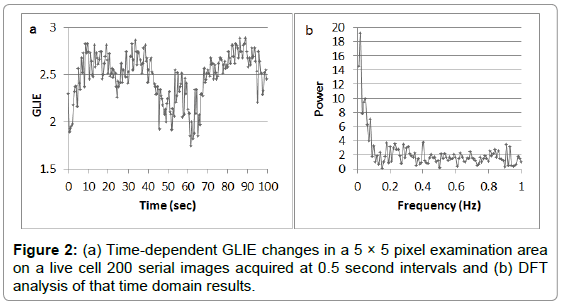
Correlations between the different GLIE fluctuation parameters: Figure 2 presents an example of the time-dependent GLIE changes in one 5 × 5 pixel unit cell area in a living cell and the corresponding DFT analysis.
LFAP and HFAP are derived directly from DFT analysis results. Correlation between them depends, (according to assumptions made in our previous work [26] which relate LFAP to physiological activity and HFAP to dissipated energy) on intracellular physiological efficiency that determines the ratio between physiological energetic activity and dissipated energy.
LFAP represents low frequency periodic GLIE changes, while HFAP represents high frequency random GLIE changes. High LFAP (periodic activity) will contribute to high autocorrelation values (AA values) that depend on the weight of periodic GLIE changes (LFAP) in relation to that of random GLIE changes (HFAP).
ASDE values depend on contributions from both periodic (LFAP) and random (HFAP) GLIE changes, though the amplitude of the periodic changes compared to the random changes of GLIE in live cells, is usually greater which usually makes this factor the dominant one to influence ASDE values.
TMRM fluorescence response evaluation: Mitochondrial uptake of TMRM is proportional to the inner membrane electrical potential with red shift of both absorption and emission fluorescence spectra. High mitochondrial membrane potential would increase the inhomogeneity of intracellular TMRM fluorescence thereby increasing the CV of intracellular fluorescence spatial distribution [29]. The complete cell area TMRM fluorescence intensities spatial distribution coefficient of variation  S.D.fTMRM stands for the standard deviation of spatial intracellular TMRM fluorescence intensities and <fTMRM> stands for the average spatial intracellular TMRM fluorescence intensity) was calculated to represent TMRM cellular response to depolarization of mitochondrial membrane potential.
Data analysis and statistics: The acquired data within ROIs was exported to Excel spreadsheets (Microsoft Inc., Redmond, Washington, USA) for graph and table presentation and statistical analysis. Significance of differences between groups was calculated using Anova single factor function or t-test for paired two samples, with statistical significance set at p<0.05.
Results and Discussion
Kinetic measurement of Gray level fluctuation parameters during cell death process
Complementary to our previous work [26] that indicated wide differences in gray level fluctuation parameter values between dead and live cells, we find it necessary to implement an upgraded approach reviewed above, to reveal whether the proposed parameters can follow the metabolic-physiologic gradual deterioration of dying cells and thereby be used to characterize the dying process. In order to clear this issue, serial time-lapse measurements of these parameters were carried out at single-cell resolution on gradually dying U-937 cells using a combination of the BF microscope and the ID-LCA (LCA based Imaging dish) substrate.
Ten U-937 cells were incubated for 48 hours in incomplete medium (without FCS), then washed, suspended in HEPES buffer, loaded on the array and individually measured every 30 minutes for both PI fluorescence (common marker of cell death) and fluctuation parameters. Between measurements, cells were held on the microscope stage within the LCA based imaging dish in HEPES buffer at 37°C awaiting the next measurement. The measurement area of 100 × 100 pixels in the center of a tested cell and example of 5 × 5 pixel unit cell area for parameter calculation are presented in Figure 3.
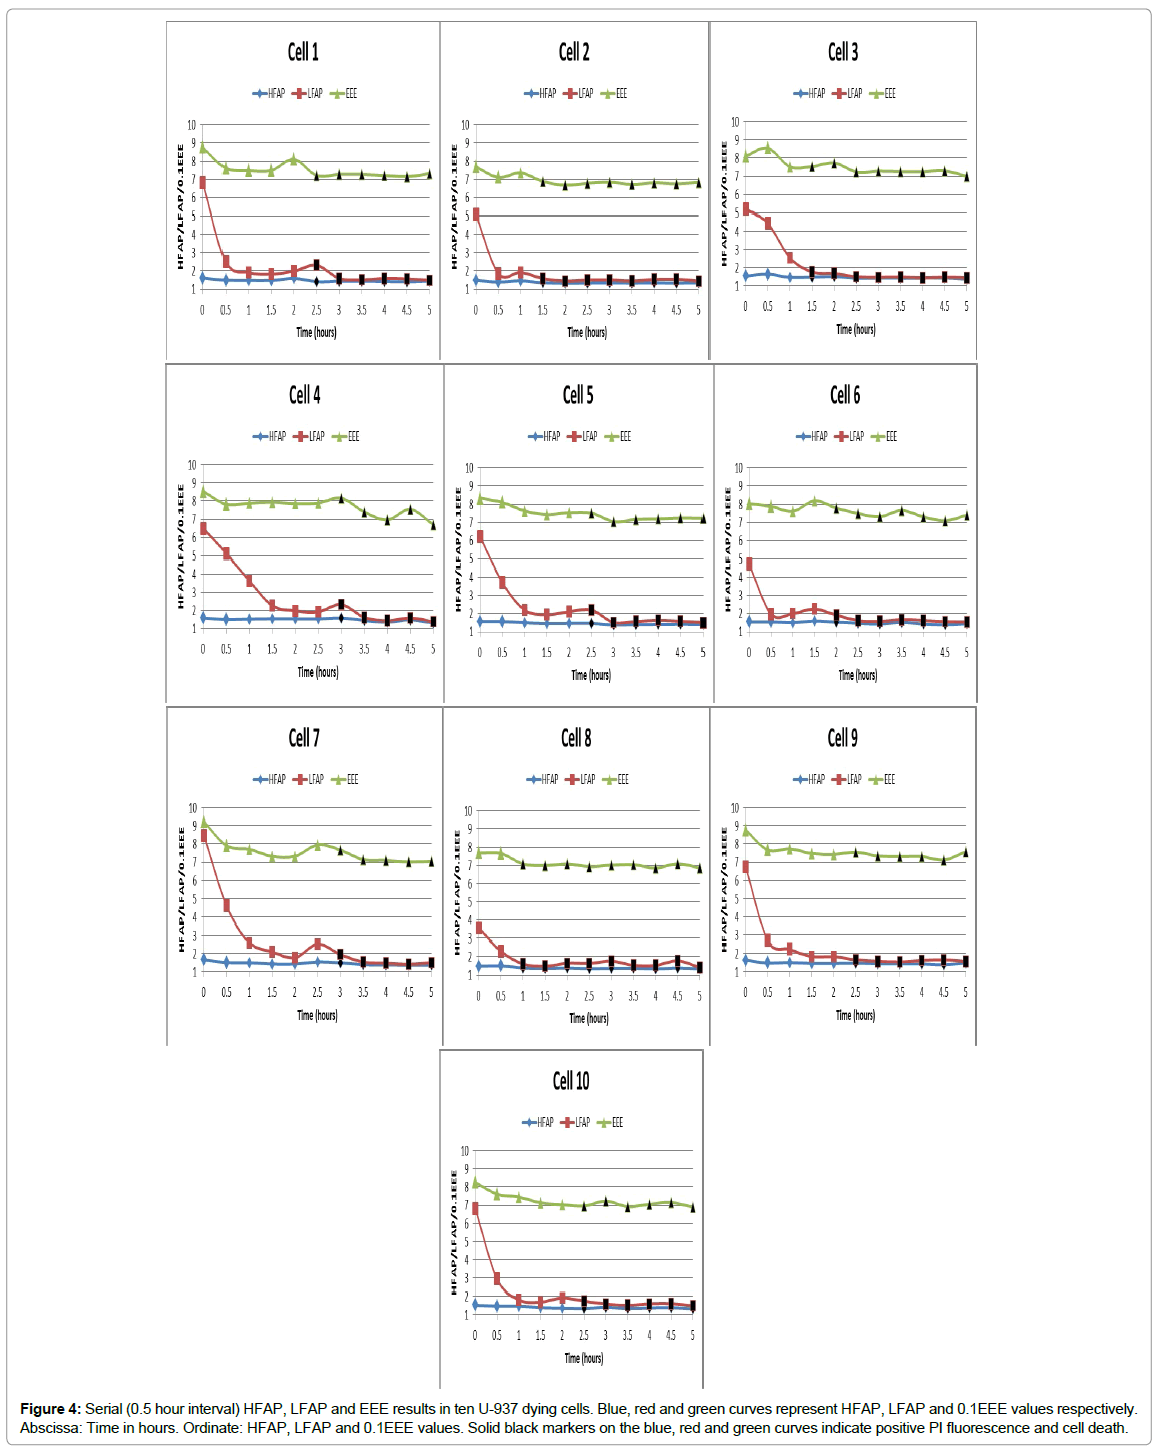
Results of 10 representative U-937 dying cell HFAP, LFAP and EEE parameters at 0.5 hour interval follow-ups are presented in Figure 4.
Figure 4: Serial (0.5 hour interval) HFAP, LFAP and EEE results in ten U-937 dying cells. Blue, red and green curves represent HFAP, LFAP and 0.1EEE values respectively. Abscissa: Time in hours. Ordinate: HFAP, LFAP and 0.1EEE values. Solid black markers on the blue, red and green curves indicate positive PI fluorescence and cell death.
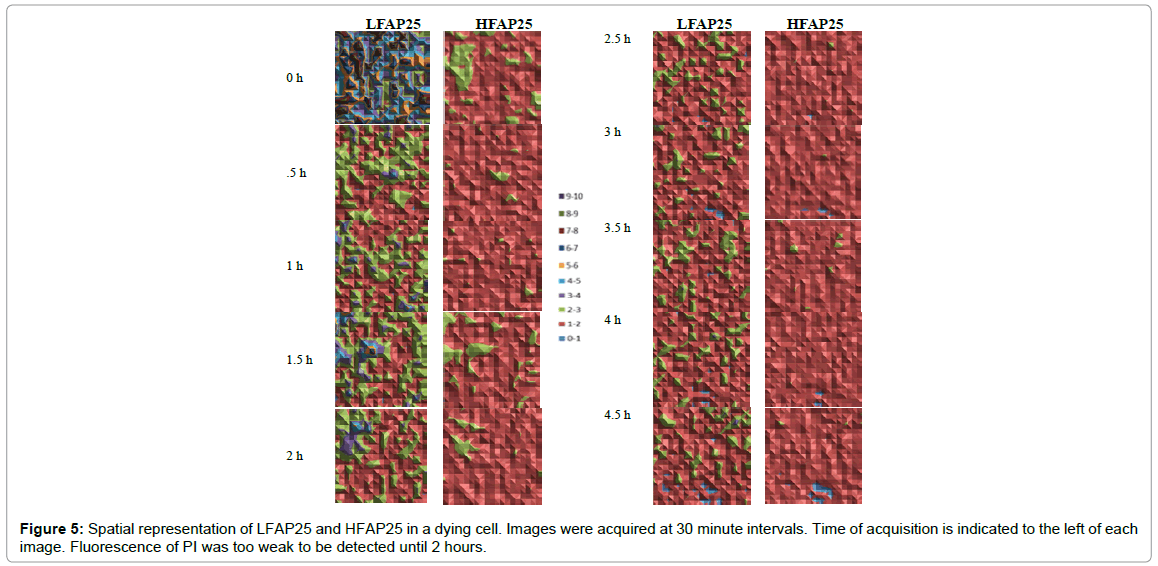
Displayed in Figure 5 is a typical dying cell’s (Cell 6 of the previously presented ten gradually dying cells) serial spatial results of 400 5 × 5 pixel spatial units of HFAP25 and LFAP25 parameters.
Table 1 compares the averge results of GLIE fluctuation parameters in the 10 gradually dying cells before death according to PI flourescence, to the average post-death results.
| Parameter | Live (PI negative) | Dead (PI positive) | P value |
|---|---|---|---|
| ASDE | 0.15±0.04 | 0.11±0.01 | <10-3 |
| AA | 0.25±0.22 | 0.03±0.03 | <10-3 |
| LFAP | 3.25±1.79 | 1.61±0.19 | <10-3 |
| HFAP | 1.52±0.07 | 1.42±0.06 | <10-3 |
| LFAP/HFAP | 2.12±0.10 | 1.14±1.11 | <10-3 |
| EEE | 78.0±4.74 | 71.82±2.90 | <10-3 |
Table 1: Average GLIE fluctuation arameters: ASDE, AA, LFAP, HFAP, ratio of LFAP to HFAP and EEE in the 10 gradually dying cells before death according to PI flourescence, compared to average GLIE fluctuation parameter values after PI determination of death.
Although time of cell death (PI positivity) within the measured cells varied from 1 h to 3 h (mean 2.2 ± 0.6 h), the average of all GLIE fluctuation parameters in PI negative cells was significanly different from that of dead (PI positive) cells (although differences in average values were not pronounced for every measure, P values that reflect the descriminating power of the parameters were still very low).
We conclude from Figures 4 and 5 and Table 1 results, that:
1. The decrease in AA, ASDE and LFAP appears significantly earlier than the PI fluorescence signal (Figures 4 and 5).
2. AA, ASDE, LFAP and HFAP are consistently low after determination of irreversible cell death (according to PI fluorescence) which reflects their reliability as indicators of cell death (Figures 4 and 5).
3. The difference between LFAP and HFAP values became consistently, significantly very small after cell death (Figures 4 and 5 and Table 1).
During the cell dying process, LFAP parameters decrease significantly—reaching values close to HFAP values, which have been experimentally found to be the lower natural limit (lower limit value) for LFAP value [26]. We follow our previous assumptions that the remarkable low frequency periodic changes demonstrated in DFT analysis of time dependent GLIE changes in living cells are reflections of periodic intracellular physiological activity, while the random high frequency powers of DFT analysis in these cells reflects the random physico-optic intracellular content dissipative fluctuations. Along the dying process, metabolic activity decreases, probably in correlation with the decline of the directed periodic physico-optic changes reflected by the periodic GLIE changes, and eventually, what remain after cell death are only the random thermal physico-optic fluctuations [30]. Dissipated energy reflected by HFAP values also decreases to a lesser extent along the dying process. HFAP, as a lower natural limit for LFAP values, determines the lower natural limit values for ASDE as well (ASDE consists of the combined contribution of HFAP random fluctuations and LFAP periodic fluctuations. If LFAP values reach HFAP values, ASDE values are determined solely by HFAP values which determine the possible lower values of ASDE as well).
Application of spatial-temporal fluctuation measures for detection of cell stimulators via PMA, T3 thyroid hormone and mild hypothermia stress
U-937 cell-response to three different metabolic mediators, each with defined metabolic activity, was evaluated and characterized by GLIE fluctuation parameters.
The following mediators were used:
• Phorbol Myristate Acetate (PMA) a Protein Kinase C (PKC) activator known to induce differentiation and proliferation of U-937 cells [31].
• Triiodothyronine (T3) thyroid hormone which is known to increase UCP activity, cellular energy expenditure and dissipated energy, accompanied by reduction in cellular energetic efficiency [32,33].
• Mild hypothermia, which is known to increase cellular energy expenditure and UCP activity [4,5].
U-937 cells were incubated in the presence of PMA for 24 hours (expected cellular morphological changes after PMA incubation were observed—data not shown) and with T3 thyroid hormone for 30 minutes. GLIE fluctuation parameter results pre- and post-treatment were compared.
In addition, mild hypothermia was induced by lowering cell environment temperature from 37°C to 27°C. GLIE fluctuation results in both temperature conditions were measured and analyzed. Gray level fluctuation parameters used were: ASDE, AA and DFT-based parameters: LFAP, HFAP and EEE.
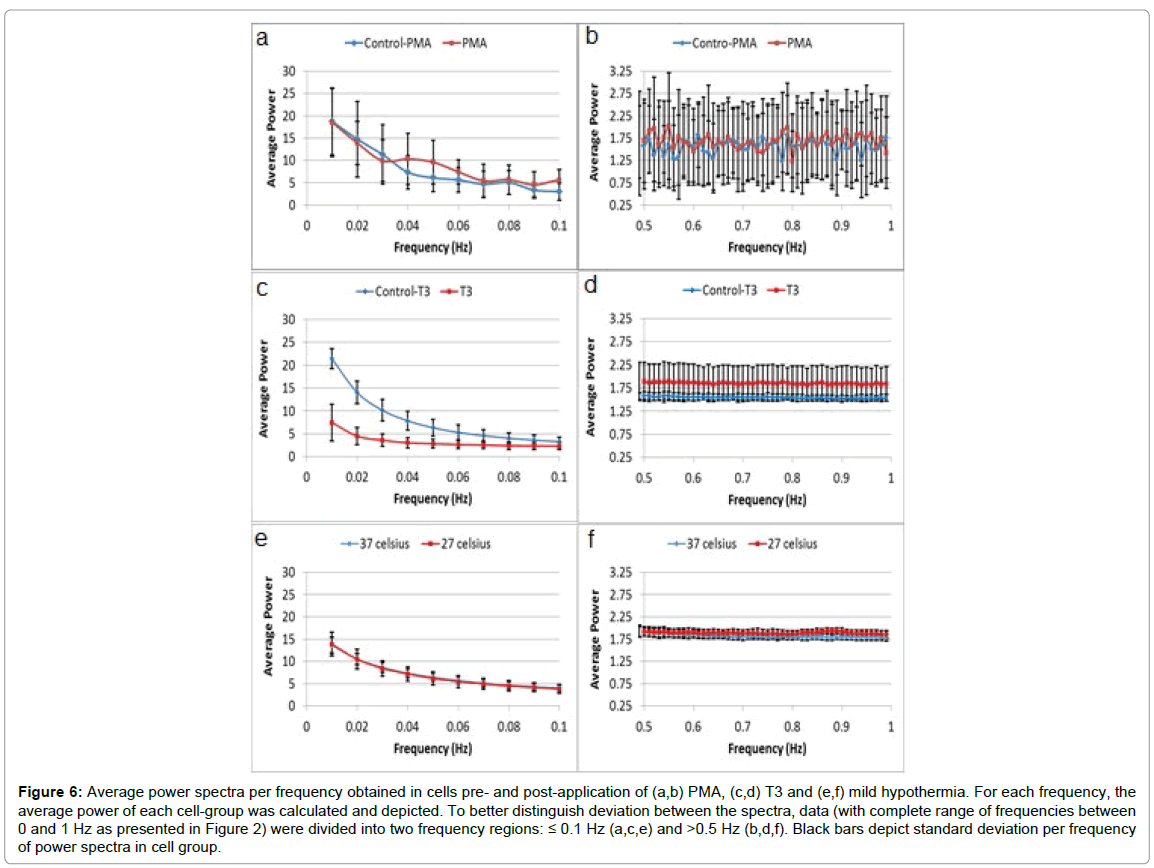
The average power spectra of DFT analysis of time dependent GLIE values (example of 200 time-dependent 0.5 second interval GLIE values in 5 × 5 pixel unit cell area and the corresponding DFT analysis, is presented in Figure 2) in each group of cells pre- and post- PMA, T3 or mild hypothermia stimulation are presented in Figure 6.
Figure 6: Average power spectra per frequency obtained in cells pre- and post-application of (a,b) PMA, (c,d) T3 and (e,f) mild hypothermia. For each frequency, the average power of each cell-group was calculated and depicted. To better distinguish deviation between the spectra, data (with complete range of frequencies between 0 and 1 Hz as presented in Figure 2) were divided into two frequency regions: ≤ 0.1 Hz (a,c,e) and >0.5 Hz (b,d,f). Black bars depict standard deviation per frequency of power spectra in cell group.
A close look at Figure 6 demonstrates that by employing DFT analysis upon GLIE results (except in the case of mild hypothermia, as reflected at the low frequency range, panel e), the various statuses of cells can be observed even in panel a where the “integral” over the frequencies formed on the red curve clearly yields bigger area than that obtained with the blue curve.
However, to emphasize this outcome, another aspect of the results observed in Figure 6 is provided in Table 2 (which also includes other GLIE fluctuation-based measures for further supplementing the analysis). It should be clarified that the measures LFAP and HFAP in Table 2 are the averages calculated over the entire cell population examined, following the definitions given in Methods, and though correlating, they differ from “average power” used in Figure 6 (for definition see Figure caption).
| Table 2a Parameter | Pre-PMA (N=36) | PMA (N=29) | P value |
|---|---|---|---|
| AA | 0.70±0.11 | 0.75±0.04 | 0.04 |
| ASDE | 0.27±0.04 | 0.29±0.02 | 0.004 |
| LFAP | 8.01±1.89 | 9.09±1.35 | 0.01 |
| HFAP | 1.57±0.16 | 1.68±0.20 | 0.01 |
| EEE | 84.0±7.83 | 93.8±10.58 | <10-3 |
| Table 2b Parameter | Pre-T3 (N=48) | T3 (N=38) | P value |
| AA | 0.74±0.07 | 0.22±0.14 | <10-3 |
| ASDE | 0.27±0.03 | 0.17±0.04 | <10-3 |
| LFAP | 8.06±1.45 | 3.37±1.16 | <10-3 |
| HFAP | 1.54±0.05 | 1.85±0.38 | <10-3 |
| EEE | 82.7±4.34 | 95.3±20.33 | <10-3 |
| Table 2c Parameter | Pre-hypo 37°C (N=38) | Mild hypo 27°C(N=38) | P value |
| AA | 0.61±0.06 | 0.56±0.11 | 0.01 |
| ASDE | 0.25±0.02 | 0.25±0.03 | 0.43 |
| LFAP | 7.04±0.73 | 6.88±1.34 | 0.22 |
| HFAP | 1.82±0.06 | 1.88±0.06 | <10-3 |
| EEE | 98.0±4.7 | 100.5±4.7 | 0.005 |
Table 2: Average and standard deviation (SD) of fluctuation parameters: AA, ASDE, Low Frequency Average Power (LFAP, f ≤ 0.1 Hz), High Frequency Average Power (HFAP, f>0.5 Hz), and Energy Expenditure Evaluation (EEE) values in normal U-937 cells and cells 24 hours post-incubation with PMA (Table 2a), normal U-937 cells and cells 30 minutes post-stimulation with T3 (Table 2b) and cells pre- and post- mild hypothermic stress (Table 2c). N-Number of cells in each group.
It is clear from results in Table 2 and Figure 6 that when stimulating U-937 cells with PMA, T3 thyroid hormone or mild hypothermia, a significant fluctuation parameter response occurs (mild differences in GLIE fluctuation parameter values between the three control groups are attributed to mild differences between the cell groups concerning cellular metabolic-physiologic condition as often seen when working with laboratory cell lines). PMA stimulation of the cells induced elevation of all GLIE fluctuation parameters. PMA activates PKC and induces differentiation of the cells, thereby increasing physiological metabolism with probably pronounced periodical physico-optic/GLIE changes reflected by elevated LFAP values. Physiological oscillations of the intracellular spatial concentration of signaling molecules were reported elsewhere [34] and specifically PKC translocations as well, in time scales of seconds (suitable for our LFAP parameter with f ≤ 0.1 Hz) [35,36]. HFAP values are also increased probably due to an elevation in dissipated energy production as a by-product of the stimulated metabolism. AA and ASDE values follow LFAP and HFAP changes.
T3 stimulation of the cells induced elevated HFAP and EEE values while reducing LFAP, AA and ASDE values (control application of the same concentration of T3 to the same medium without cells did not cause an increase in HFAP values, data not shown). T3 has known metabolic effects that include increase in energy expenditure, while metabolic efficiency is reduced due to pronounced mitochondrial and other organ uncoupling mechanism [32]. By increasing dissipation of energy, thyroid hormones have a cardinal role in controlling body heat in mammals. T3-mediated increased cellular energy expenditure and mitochondrial uncoupling is expected to elevate HFAP values, while the reduction in metabolic efficiency is expected to lower periodical GLIE changes and LFAP values thereby lowering AA and ASDE values as well. Due to the strong uncoupling and dissipation effect of T3, HFAP elevation is pronounced, as compared to HFAP elevation after PMA incubation (20% compared to 7% respectively).
Exposure of cells to mild hypothermic stress caused elevation of HFAP and EEE values and reduction of AA values with insignificant changes in the other GLIE fluctuation parameters. Hypothermia has been portrayed to elevate UCP activity in immune cells as well [4]. In such case, pronounced uncoupling, probably due to increased UCP2 activity, is expected to increase the total cellular energy expenditure and dissipated energy, and thereby increasing EEE and HFAP values while reducing the cellular energetic efficiency and AA values due to the increased uncoupling. Effective compensation of cellular metabolism in mild cases of hypothermia is expected to keep metabolically connected LFAP values insignificantly changed [37]. ASDE follows HFAP and LFAP values. In all these cases of metabolic stimulators applied to the cells, EEE values increased.
Gray level fluctuation parameter response to mitochondrial inhibitors: rotenone, CCCP and oligomycin
Next, we evaluate gray value information entropy (GLIE) fluctuation parameters in living U-937 cells following treatment with three levels of mitochondrial energy utilization inhibitions:
1. Inhibition of electron transport chain using rotenone,
2. Inhibition of inner membrane proton gradient creation using uncoupler CCCP, and
3. Inhibition of ATP synthase using oligomycin.
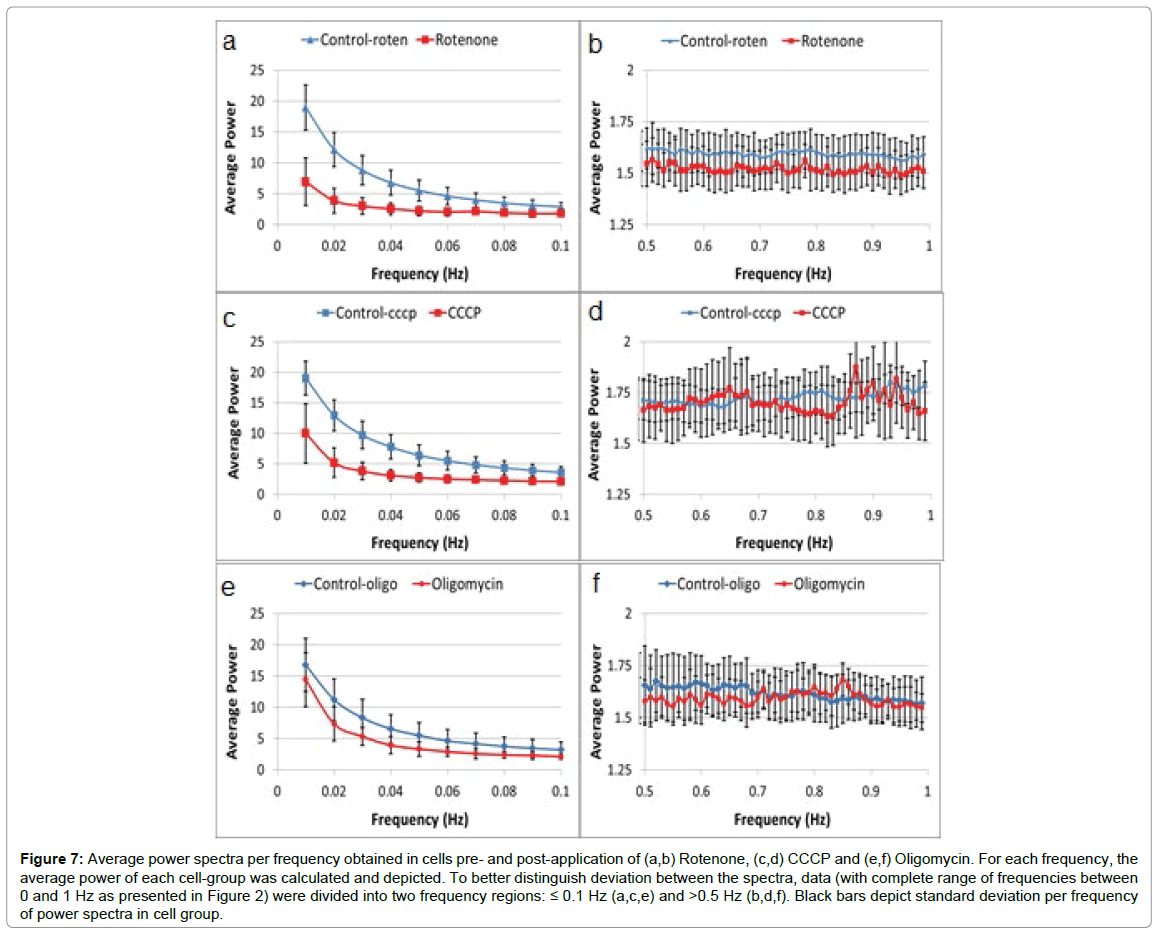
Results of gray value fluctuation parameters in the three groups of U-937 cells pre- and 30 minutes post-application of mitochondrial inhibitors: Rotenone, CCCP or Oligomycin (while maintained in HEPES buffer) are summarized in Figure 7 and Table 3. However, in long-term manipulation of cells, it is best to add glucose to the HEPES buffer, especially when using mitochondrial inhibitors. The average power spectra of the DFT analysis of time dependent GLIE values in each group of cells pre- and post- inhibitory mitochondrial drug application are presented in Figure 7.
Figure 7: Average power spectra per frequency obtained in cells pre- and post-application of (a,b) Rotenone, (c,d) CCCP and (e,f) Oligomycin. For each frequency, the average power of each cell-group was calculated and depicted. To better distinguish deviation between the spectra, data (with complete range of frequencies between 0 and 1 Hz as presented in Figure 2) were divided into two frequency regions: ≤ 0.1 Hz (a,c,e) and >0.5 Hz (b,d,f). Black bars depict standard deviation per frequency of power spectra in cell group.
| Table 3a Parameter | Pre-Rotenone (N=55) | Rotenone (N=55) | P value |
|---|---|---|---|
| TMRM | 0.24±0.09 | 0.07±0.04 | <10-3 |
| AA | 0.67±0.14 | 0.21±0.14 | <10-3 |
| ASDE | 0.25±0.03 | 0.15±0.03 | <10-3 |
| LFAP | 7.04±1.55 | 2.83±1.08 | <10-3 |
| HFAP | 1.59±0.08 | 1.52±0.08 | <10-3 |
| EEE | 83.9±4.3 | 77.5±4.47 | <10-3 |
| Table 3b Parameter | Pre-CCCP (N=54) | CCCP (N=33) | P value |
| TMRM | 0.17±0.08 | 0.01±0.003 | <10-3 |
| AA | 0.68±0.09 | 0.28±0.15 | <10-3 |
| ASDE | 0.27±0.03 | 0.17±0.03 | <10-3 |
| LFAP | 7.80±1.42 | 3.62±1.25 | <10-3 |
| HFAP | 1.72±0.06 | 1.70±0.13 | 0.23 |
| EEE | 91.9±4.49 | 86.7±7.32 | <10-3 |
| Table 3c Parameter | Pre-Oligomycin (N=24) | Oligomycin (N=24) | P value |
| TMRM | 0.14±0.06 | 0.08±0.04 | <10-3 |
| AA | 0.62±0.16 | 0.46±0.13 | <10-3 |
| ASDE | 0.24±0.05 | 0.19±0.03 | <10-3 |
| LFAP | 6.75±2 | 4.66±1.26 | <10-3 |
| HFAP | 1.63±0.13 | 1.59±0.07 | 0.04 |
| EEE | 86.0±8.46 | 82.1±4.29 | 0.01 |
Table 3: Average and standard deviation (SD) of TMRM fluorescence intensities, intracellular distribution CV and fluctuation parameters: AA, ASDE, Low Frequency Average Power (LFAP, f ≤ 0.1 Hz), High Frequency Average Power (HFAP, f>0.5Hz), and Energy Expenditure Evaluation (EEE) values in normal U-937 cells pre- and 30 minutes post- mitochondrial inhibitory factor application: Rotenone (Table 3a), CCCP (Table 3b) and Oligomycin (Table 3c). N- Number of cells in each group.
Another aspect of the results observed in Figure 7 is provided in Table 3 (which also includes other GLIE fluctuation-based measures for further supplementing the analysis). Control TMRM intracellular fluorescence intensity distribution coefficient of variation (CV) results pre- and post-treatment, are also presented.
Table 3 results show the unequivocal response of TMRM fluorescence and the cellular GLIE fluctuation parameters AA and ASDE to the mitochondrial dysfunction effects caused by the three different mitochondrial inhibitory compounds. All three compounds caused a significant decrease in cellular ASDE, AA and TMRM intracellular CV values. The label free GLIE fluctuation parameters demonstrated comparable change in their values in response to the mitochondrial inhibitory compounds to the fluorescence probe TMRM. As will be shown in the following results, label free GLIE fluctuation parameters have the benefit of enabling further characterizing of the inhibitory response compared to the lower specificity gained by investigation with TMRM probe alone. The unequivocal response of GLIE fluctuation parameters and TMRM to mitochondrial inhibitory drug application in this cell line with known typical high non-mitochondrial NADPH oxidase activity reveals, nevertheless, the significant role of mitochondrial metabolism in these cells.
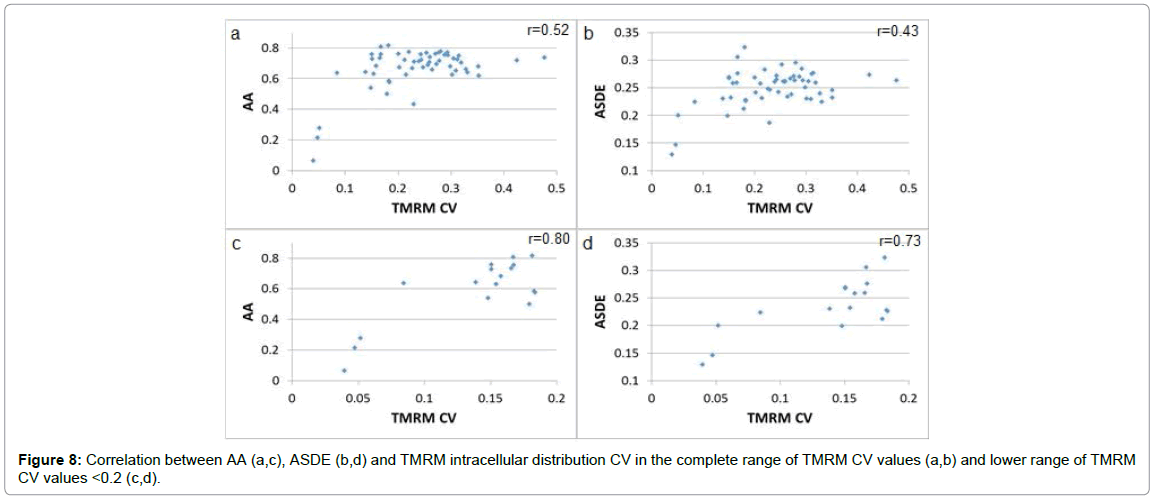
The relation at single-cell resolution between ASDE, AA and TMRM CV in normal U-937 cells reveals r correlation values of 0.43 and 0.52 between TMRM CV and ASDE and AA parameters respectively, in the full TMRM CV value range exceeding r correlation values of 0.73 and 0.80 respectively in the lower TMRM CV value range <0.2 (Figure 8). Due to the AA parameter value upper natural limit (1 is the maximum possible value of the autocorrelation function) a decrease in r correlation value in the higher AA value range is anticipated. There was no significant correlation between TMRM CV and LFAP or HFAP values. As mentioned before, LFAP values could be related to periodic physiological cellular activity and HFAP values could be related to random dissipative intracellular content fluctuations. There is no direct tight coupling between energy demand and energy expenditure of physiological cellular activity and mitochondrial efficiency and inner membrane potential due to intracellular ATP reservoirs and multiple factors that control mitochondrial efficiency and coupling. It is possible therefore, that energetic expenditure of physiological activity, LFAP and HFAP value would not be tightly correlated to mitochondrial efficiency and inner membrane potential. AA values which relate to the relative weight of periodic changes compared to random GLIE changes will better correlate to mitochondrial efficiency and inner membrane potential. Due to inter-parametric relations ASDE values are also elevated when AA values are high.
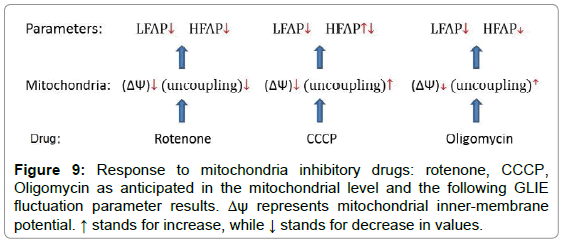
Looking at Table 3 and Figure 7 reveals a similar response of ASDE, AA and LFAP to rotenone, CCCP and oligomycin (decreased values). HFAP response is more diverse. While HFAP values decreased due to exposure of the cells to rotenone, HFAP values did not change after exposure to CCCP. Exposure to oligomycin caused a milder decrease in HFAP values. According to our assumption, GLIE random fluctuations in the high frequency power range could reflect random dissipative fluctuations of cell content. Following this assumption, mitochondrial inhibitory agents such as CCCP, that increase mitochondrial uncoupling, would cause elevation of mitochondrial dissipated energy production that would result in relatively high random content fluctuations and HFAP values. Mitochondrial inhibitory agents such as oligomycin that cause mitochondrial uncoupling to a lesser degree, could keep high HFAP values less prominently in comparison to CCCP. Mitochondrial inhibitory agents such as rotenone, that reduce energy utilization in the mitochondria by inhibition at the early stages of the process (electron transfer chain) would probably cause reduced mitochondrial uncoupling and lower HFAP values. Figure 9 summarized the response to mitochondrial inhibitory drugs at the mitochondrial level (inner-membrane potential and uncoupling) and at the DFT analysis parameter result level.
Reduction of EEE values in all three groups of cells following each mitochondrial inhibitory drug application could be explained by cellular reduction of energy expenditure due to the drug’s mitochondrial inhibitory action, in which case reduced LFAP values may be anticipated due to reduction of metabolism and periodic activity. Low AA and ASDE values are also anticipated following the low LFAP values.
Measuring gray value fluctuation parameters in the same cell prior to and following treatment
Gray value fluctuation parameter response to a potent mitochondrial inhibitor – rotenone in 36 U-937 cells at single-cell resolution was tested. Results summarized in Figure S1, indicate very pronounced and consistent response of all the cells to rotenone—such that render these parameters very reliable tools for observation and follow-up of this response and similar cellular events.
Gray value fluctuation parameter response in 38 U-937 cells to mild stress such as mild hypothermia in this case, was also tested at single-cell resolution. Results are summarized in Figure S2. Analysis of the results reveals, that different patterns of cell behavior in response to the mild stimulation could be identified, supporting possible recognition of subpopulations in the general cell group using the gray level fluctuation parameters.
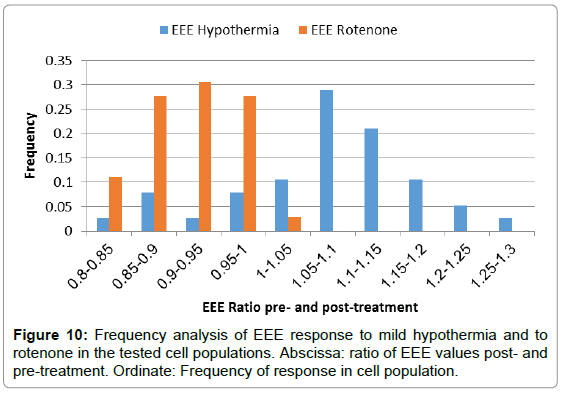
Figure 10 illustrates the two opposing responses to mild hypothermia in the cell population using EEE at single-cell resolution compared to the unidirectional response to rotenone in the rotenonetested cell population.
Identification of rotenone activity via fluctuation based parameters measured by means of BF, DIC and PC microscopy
It was intended to reveal if using higher contrast microscopy approaches, i.e., PC (Phase Contrast) or DIC (Differential Interference Contrast) might yield added value upon simple BF (Bright Field) in tracing cellular events via the spatiotemporal fluctuation measures discussed above. For this comparative study, cellular response to rotenone was chosen and results are presented in Table S1 of the Supplementary Information.
As can be seen, in relation to performance of the regular BF approach, PC did not enhance discrimination between cellular statuses, i.e., pre- versus post-rotenone treatment. DIC microscopy however, seems to have improved discrimination via the measure AA between pre- and post-treatment with rotenone, but did not change discrimination via the measures ASDE and LFAP. Furthermore, DIC was found to deteriorate the performance of the HFAP measure.
Referring to these representative outcomes, though limited to one specific model, one may deduce that in general, use of PC and DIC does not improve fluctuate measure outcome when produced by BF microscopy, a subject which will be discussed in detail in future works.
It seems from all the above results that there exists a specific relationship between metabolic-energetic states and GLIE fluctuation parameters: dissipation energy relates to HFAP values, physiologic periodic activity relates to LFAP values, total cellular energy expenditure relates to EEE values and energetic efficiency relates to AA values.
Conclusion
Applying the proposed gray level fluctuation based measures in single cell resolution reveals very highly consistent parameter response with major metabolic effectors (Figure S1). However, with mild cellular stimulation, single-cell resolution observation reveals sub-populations of the general cell groups.
Using high-contrast microscopy-based methods: PC and DIC did not contribute significantly to the performance of GLIE fluctuation parameters in response to mitochondrial inhibitory rotenone application. The cell death process was effectively demonstrated using GLIE fluctuation parameters especially DFT derived ones along its crucial steps: probably still reversible metabolic deterioration, membrane disintegration (cell positive PI fluorescence) with irreversible cell death and cell dismantling.
Although gray level fluctuation parameters are not specific in their nature, it has been demonstrated in these experiments that pre-determined physiological conditions known for their special metabolic effects on cellular energy expenditure, energetic efficiency and uncoupling-dissipated energy, could be effectively differentiated and followed using these parameters, especially autocorrelation and the new DFT-derived ones: HFAP, LFAP and EEE. Different mitochondrial inhibitory drug effects could be differentiated according to HFAP response, while cellular stimulation effects of differentiation, T3 thermoregulation, and mild hypothermia could also be easily differentiated utilizing different combined responses of AA, HFAP and LFAP to the specific stimulation.
Prior works in this field have mainly concentrated on the analyis of spatial gray level fluctuations. But by putting emphasis on the temporal aspect of gray level fluctuations, one could use DFT and autocorrelation analysis to gain real-time insight into cellular energy correlative measures. Hence, the proposed method may have a wide range of practical applications that could exploit the unique insight into cellular energy expenditure, energetic efficiency, dissipated energy and physiologic periodic activity. For instance, malignant transformation, neurodegenerative diseases and insulin resistance, are all known to correlate with metabolic energetic changes and would possibly be better explored and monitored with the non-interfering, probe-free, fluctuation-based gray value analysis proposed and demostrated in this study.
Gray level fluctuation parameters in these experiments are derived from 200 × 400 basic GLIE results per cell. The parameters that we used in this work are only a small fraction of a wide range of possible parameters (such as higher moments of the spatial-temporal distributions, decay of autocorrelation, more DFT analysis parameters, etc.) that could be utilized from the large basic data set of each cell and may be effectivly used to gain more specificity and sensitivity for evaluation of cellular physiological-metabolic processes.
Acknowledgements
This study was endowed by the Bequest of Moshe-Shimon and Judith Weisbrodt.
References
- Nunnari J, Suomalainen A (2012) Mitochondria: in sickness and in health. Cell 148: 1145-1159.
- Galluzzi L, Kepp O, Trojel-Hansen C, Kroemer G (2012) Mitochondrial control of cellular life, stress, and death. Circ Res 111: 1198-1207.
- Kim JA, Wei Y, Sowers JR (2008) Role of mitochondrial dysfunction in insulin resistance. Circ Res 102: 401-414.
- Solmonson A, Mills EM (2016) Uncoupling Proteins and the Molecular Mechanisms of Thyroid Thermogenesis. Endocrinology 157: 455-462.
- Adams SH (2000) Uncoupling protein homologs: emerging views of physiological function. J Nutr 130: 711-714.
- Derdak Z, Mark NM, Beldi G, Robson SC, Wands JR, et al. (2008) The mitochondrial uncoupling protein-2 promotes chemoresistance in cancer cells. Cancer Res 68: 2813-2819.
- Samudio I, Fiegl M, Andreeff M (2009) Mitochondrial uncoupling and the Warburg effect: molecular basis for the reprogramming of cancer cell metabolism. Cancer research 69: 2163-2166.
- Baffy G, Derdak Z, Robson SC (2011) Mitochondrial recoupling: a novel therapeutic strategy for cancer? Br J Cancer 105: 469-474.
- Dalla Pozza E, Fiorini C, Dando I, Menegazzi M, Sgarbossa A, et al. (2012) Role of mitochondrial uncoupling protein 2 in cancer cell resistance to gemcitabine. Biochim Biophys Acta 1823: 1856-1863.
- Lin MT, Beal MF (2006) Mitochondrial dysfunction and oxidative stress in neurodegenerative diseases. Nature 443: 787-795.
- Gibson GE, Starkov A, Blass JP, Ratan RR, Beal MF (2010) Cause and consequence: mitochondrial dysfunction initiates and propagates neuronal dysfunction, neuronal death and behavioral abnormalities in age-associated neurodegenerative diseases. Biochim Biophys Acta 1802: 122-134.
- Wiley CD, Velarde MC, Lecot P, Liu S, Sarnoski EA, et al. (2016) Mitochondrial Dysfunction Induces Senescence with a Distinct Secretory Phenotype. Cell Metab 23: 303-314.
- Giulivi C, Zhang YF, Omanska-Klusek A, Ross-Inta C, Wong S, et al. (2010) Mitochondrial dysfunction in autism. JAMA 304: 2389-2396.
- Myhill S, Booth NE, McLaren-Howard J (2009) Chronic fatigue syndrome and mitochondrial dysfunction. Int J Clin Exp Med 2: 1-16.
- Pelicano H, Zhang W, Liu J, Hammoudi N, Dai J, et al. (2014) Mitochondrial dysfunction in some triple-negative breast cancer cell lines: role of mTOR pathway and therapeutic potential. Breast Cancer Res 16: 434.
- Feichtinger RG, Sperl W, Bauer JW, Kofler B (2014) Mitochondrial dysfunction: a neglected component of skin diseases. Exp Dermatol 23: 607-614.
- Brand MD, Nicholls DG (2011) Assessing mitochondrial dysfunction in cells. Biochem J 435: 297-312.
- Scaduto RC, Grotyohann LW (1999) Measurement of mitochondrial membrane potential using fluorescent rhodamine derivatives. Biophys J 76: 469-477.
- Hoult DI, Busby SJ, Gadian DG, Radda GK, Richards RE, et al. (1974) Observation of tissue metabolites using 31P nuclear magnetic resonance. Nature 252: 285-287.
- Dobbins RL, Malloy CR (2003) Measuring in-vivo metabolism using nuclear magnetic resonance. Curr Opin Clin Nutr Metab Care 6: 501-509.
- Haralick RM, Shanmugam K, Dinstein I (1973) Textural features for image classification. IEEE Transactions on Systems, Man and Cybernetics 6: 610-621.
- Pantic I, Pantic S, Paunovic J (2012) Aging increases nuclear chromatin entropy of erythroid precursor cells in mice spleen hematopoietic tissue. Microsc Microanal 18: 1054-1059.
- Pantic I, Pantic S, Basta-Jovanovic G (2012) Gray level co-occurrence matrix texture analysis of germinal center light zone lymphocyte nuclei: physiology viewpoint with focus on apoptosis. Microsc Microanal 18.03: 470-475.
- Pantic I, Pantic S (2012) Germinal center texture entropy as possible indicator of humoral immune response: Immunophysiology viewpoint. Mol Imaging Biol 14: 534-540.
- Wiedemann P, Guez JS, Wiegemann HB, Egner F, Quintana JC (2011) In situ microscopic cytometry enables noninvasive viability assessment of animal cells by measuring entropy states. Biotechnol Bioeng 108: 2884-2893.
- Wohl I, Zurgil N, Hakuk Y, Sobolev M, Galmidi M, et al. (2015) In situ label-free static cytometry by monitoring spatiotemporal fluctuations of image gray values. J Biomed Opt 20: 105013.
- Ravid-Hermesh O, Zurgil N, Shafran Y, Sobolev M, Galmidi M (2014) Real-time quantification of protein expression and translocation at individual cell resolution using imaging-dish-based live cell array. Anal Bioanal Chem 406: 7085-7101.
- Derrida B (2007) Non-equilibrium steady states: fluctuations and large deviations of the density and of the current. Journal of Statistical Mechanics: Theory and Experiment 2007: P07023.
- Perry SW, Norman JP, Barbieri J, Brown EB, Gelbard HA (2011) Mitochondrial membrane potential probes and the proton gradient: a practical usage guide. Biotechniques 50: 98-115.
- Schrödinger E (1962) What is Life? The Physical Aspect of the Living Cell. The University Press, Cambridge.
- Daigneault M, Preston JA, Marriott HM, Whyte MK, Dockrell DH (2010) The identification of markers of macrophage differentiation in PMA-stimulated THP-1 cells and monocyte-derived macrophages. PLoS One 5: e8668.
- Vaitkus JA, Farrar JS, Celi FS (2015) Thyroid Hormone Mediated Modulation of Energy Expenditure. Int J Mol Sci 16: 16158-16175.
- Lombardi A, Moreno M, de Lange P, Iossa S, Busiello RA (2015) Regulation of skeletal muscle mitochondrial activity by thyroid hormones: focus on the “old” triiodothyronine and the “emerging” 3, 5-diiodothyronine. Front Physiol 6: 237.
- Paszek P, Jackson DA, White MR (2010) Oscillatory control of signalling molecules. Curr Opin Genet Dev 20: 670-676.
- Oancea E, Meyer T (1998) Protein kinase C as a molecular machine for decoding calcium and diacylglycerol signals. Cell 95: 307-318.
- Codazzi F, Teruel MN, Meyer T (2001) Control of astrocyte Ca(2+) oscillations and waves by oscillating translocation and activation of protein kinase C. Curr Biol 11: 1089-1097.
- Neutelings T, Lambert CA, Nusgens BV, Colige AC (2013) Effects of mild cold shock (25°C) followed by warming up at 37°C on the cellular stress response. PLoS One 8: e69687.
Citation: Wohl I, Zurgil N, Hakuk Y, Sobolev M, Deutsch M (2016) In Situ Evaluation of Physiological Activity and Mitochondrial Dysfunction via Novo Label- Free Measures Based on Fluctuation of Image Gray Values. J Anal Bioanal Tech 7:308. Doi: 10.4172/2155-9872.1000308
Copyright: © 2016 Wohl I, et al. This is an open-access article distributed under the terms of the Creative Commons Attribution License, which permits unrestricted use, distribution, and reproduction in any medium, provided the original author and source are credited.
Share This Article
Open Access Journals
Article Tools
Article Usage
- Total views: 11199
- [From(publication date): 4-2016 - Apr 27, 2024]
- Breakdown by view type
- HTML page views: 10493
- PDF downloads: 706

