Research Article Open Access
Biodegradation of Malachite Green by Klebsiella Terrigenaptcc 1650: The Critical Parameters Were Optimized Using Taguchi Optimization Method
| Ramezani S1*, Pourbabaee AA2 and Javaheri Daneshmand H3 | |
| 1Department of Chemistry, Tarbiat Moallem University, Tehran, Iran | |
| 2Department of Soil science, Biotech Lab, Tehran University, Tehran, Iran | |
| 3Department of Microbiology, Faculty of Science, Islamic Azad University, Qom Branch, Qom, Iran | |
| Corresponding Author : | Ramezani S Department of chemistry Tarbiat Moallem University Karaj, Iran E-mail: soleyman.ramezani@tmu.ac.ir |
| Received October 17, 2012; Accepted November 28, 2012; Published November 30, 2012 | |
| Citation: Pourbabaee AA, Ramezani S, Javaheri Daneshmand H (2013) Biodegradation of Malachite Green by Klebsiella Terrigenaptcc 1650: The Critical Parameters Were Optimized Using Taguchi Optimization Method. J Bioremed Biodeg 4:175. doi: 10.4172/2155-6199.1000175 | |
| Copyright: © 2013 Pourbabaee AA, et al. This is an open-a ccess article distributed under the terms of the Creative Commons Attribution License, which permits unrestricted use, distribution, and reproduction in any medium, provided the original author and source are credited. | |
Related article at Pubmed Pubmed  Scholar Google Scholar Google |
|
Visit for more related articles at Journal of Bioremediation & Biodegradation
Abstract
In the work ahead, the microbial degradation of Malachite Green (MG) was investigated by the bacterium
Klebsiella. At first, the Taguchi Optimizing Method (TOM) was used to optimize the experimental conditions. 16 introduced states were tested by the L-16 array type of the software and each case was repeated three times for calculating signal/noise (S/N) ratio. Based on S/N ratio, it was found that, the best experimental conditions will be at the dye concentration of (25 ppm), temperature (30°C), pH (~6), carbon source (Lactose) and nitrogen source (Ammonium nitrate). After reviewing the obtained results of Taguchi software, were found that, initial dye concentration and nitrogen source are most and less effective in the MG degradation experiments respectively. For experimental study, the MSM (Mineral Salt Medium) with phosphate buffers (for pH of 6, 6.6 and 7), Tris tampons (for pH of 6.7, 8 and 4.8) and acetic acid/sodium acetate tampons (for pH of 5 and 6.5) were used. For chemical analysis, dichloromethane was used as organic solvent. Eventually, UV-Visible absorption spectrum, HPLC and FTIR analysis confirmed completely degradation of MG by the bacterium Klebsiella.
| Keywords |
| Malachite green; Klebsiella strain; Microbial biodegradation; Taguchi optimizing method |
| Introduction |
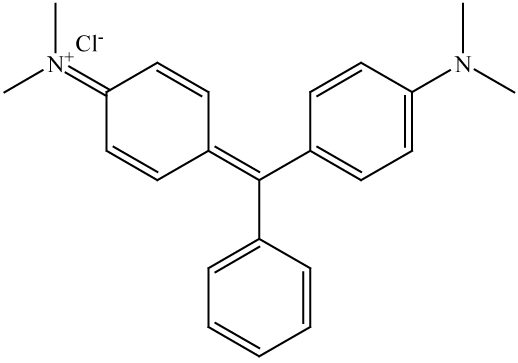
| Synthetic dyes are extensively used as important chemical compounds in many industrial processes like leather, textile, paper, printing, food, pharmaceutical, and cosmetic industries. Undoubtedly, thousand tons of organic dyes are produced annually worldwide that more of them are interred into the environment as waste water during the construction’s processes [1]. Most of these synthetic dyes are toxic and potentially carcinogenic and mutagenic. Among that, the MG (Figure 1) dye is highly toxic to mammalian cells in concentrations less than 0.1 μg/ml [2,3]. It also enhanced liver tumor formation in rats and caused reproductive abnormalities in rabbits and fish. Furthermore, MG can be absorbed by the body cells and can be converted to other forms such as Leuco-malachite green and Carbinol that is also more toxic to human’s health. The researchers showed that, this form of the MG (Leuco-malachite green) is more toxic than MG and to remain longer in our cells [4]. Nevertheless, MG is a tri-phenylmethane industrial dye which has been used extensively for dyeing silk, wool, jute, leather, ceramic and cotton [5], on account of widespread industrially application of the MG due to its relatively low cost, ready availability, and efficiency. Therefore, potential human exposure to MG could result either from the consumption of treated fish, or from working in the dye and aquaculture industries. So, the Food and Drug Administration (FDA) nominated the MG as a priority chemical for carcinogenicity testing by the National Toxicology Program [5]. Therefore, as expected, removal of synthetic dyes, especially MG from human environment and an aquatic ecosystem seems to be absolutely necessary. |
| Several physicochemical methods such as adsorption, chemical precipitation, photolysis, chemical oxidation and reduction, electrochemical treatment, have been used for the removal of dyes from wastewater effluent [6-9]. However, implementation of physical/ chemical methods have the innate disadvantages of being economically unfeasible (as they require more energy and chemicals), being unable to completely remove the recalcitrant synthetic dyes and/or their organic metabolites, generating a significant amount of sludge that may cause secondary pollution problems, and involving complicated procedures. However, microbial or enzymatic decolorization and degradation is an eco-friendly, pure (producing less sludge), yielding end products that are non-toxic or have complete mineralization and cost-competitive alternative to chemical decomposition process that could help reduce water consumption compared to physicochemical treatment methods [10]. |
| Taguchi methodology when the numbers of the process parameters increases, to optimize environmental conditions of the experiments have to be carried out a large number of experiments. Undoubtedly, this can be costly, tedious, time-consuming and less accurate. To overcome this problem, the Taguchi method uses a special design of orthogonal arrays to study the entire process parameter space with only a small number of experiments. Using an orthogonal array to design the experiment could help the designers to study the influence of multiple controllable factors on the average of quality characteristics and the variations in a fast and economic way, while using a signal-to-noise ratio to analyze the experimental data which could help the designers of the product or the manufacturer to easily find out the optimal parametric combinations. This overturning strategy of Taguchi’s method will not only keep a product’s external specifications at a potential level but also significantly enhance its reliability, manufacturability, and broad-sense value. To date, Taguchi’s method has been one of the two most effective tools for improving quality, with the other being ISO-9000 [11,12]. So, in the present study an attempt has been made to comprehend the different variable parameters involved in degradation of MG by the Klebsiella strain and impact of each parameter on the overall reaction during the degradation process. Hereby, the present study has focussed on the successful degradation of MG by the bacterium Klebsiella. Also, various experimental conditions for decolorization have been studied and optimized using L-16 array type of the TOM. |
| Materials and Methods |
| Chemical materials and dyes |
| Reagent grade chemicals and distilled water were used for preparing all aqueous solutions at 25°C. All mediums and dyes used in the present work were obtained from Merck or Himedia. The compounds used to produce synthetic medium and all the mineral salts and acids, also, all of the used sugars such as glucose, sucrose, starch, lactose, maltose, D-mannitol, D-mannose and raffinose, were purchased from Merck. Furthermore, the bacterial strain has been isolated from Kashan, Qom and Saveh-Iran soil samples. |
| Instrumentation |
| UV–Vis absorption spectra were recorded with a UV– Visspectrometer (Jenwey, model 6505, Germany). IR spectra were recorded on a Fourier transform infrared spectrometer (model WQF-510, USA-CHINA). All chromatograms were recorded by high performance liquid chromatography with UV detector (HPLC, KNAUER, GERMANY). Also Top Round Refrigerated centrifuge (KOKUSAN, model H200 NR, JAPAN) and light microscopy (NIKON, JAPAN) were used wherever it has been required. |
| Type of the organism and culture |
| The strain Klebsiella terrigena used in this study was obtained from the Persian Type Culture Collection (PTCC) in Iran. It was maintained on nutrient agar slants at 4°C. The pure culture of K. terrigena was grown in 250 mL Erlenmeyer flask, containing 100 mL nutrient broth at 27°C for 24 h at static anoxic condition. |
| In order to study degradation of MG by the K. terrigena, at first, the MSM medium was prepared as following composition (g/L): NaH2PO4 (0.235), MgSO4.7H2O (0.07), CaCl2 (0.014), FeCl3. 6H2O, (0.001) and yeast extract (5.0), glucose was used as carbon source (10) and ammonium nitrate was used as nitrogen source (5.0). Then, after pH adjustment at 7 using NaOH (2.0 M), the medium was autoclaved at 105°C and 1 atm for 40 min. In the following, the MG dye with final concentration of 5 ppm beside Klebsiella bacteria (5% v/v) were added to the Erlenmeyer flask containing MSM medium. Eventually, the results were analyzed after 24 to72 hours by UV-Vis spectroscopy, IR spectroscopy and HPLC. |
| Degradation experiments |
| The degradation process of the MG by K. terrigena was surveyed in following three stages. At first, after autoclavation of the nutrient broth medium, a loopful of bacteria grown on nutrient agar was inoculated in 250 mL Erlenmeyer flask containing 100 mL nutrient broth and incubated at 37°C for 24 h. After 24 h of incubation, all dyes were added at concentration of 25-100 mg/L and appropriate amount of the culture media was withdrawn at different time intervals. Aliquot was centrifuged at 1000 rpm for 10 minutes by refrigerated centrifuge to separate the bacterial cell mass, clear supernatant which was used to measure the decolorization at the absorbance maxima of the respective dyes. Abiotic control (without bacteria inoculation) was always included. Meanwhile, 5% inoculum of optical density (OD) 0.35 (λmax=620 nm) grown in nutrient broth for 24 h was used for inoculation of semi-synthetic medium. Finally, the percentage decolorization was calculated using the following equation: |
| Confirmation of the Klebsiella strain (biochemical tests) |
| To ensure from the type of the bacteria used in this study, the Klebsiella strain was confirmed by various biochemical tests such as catalase, oxidase and tryptophanase tests. There with, the Voges- Proskauer (VP), citrate and some supplementary tests were applied successfully in verification of the Klebsiella strain. All results obtained from biochemical experiment sand comparison with biochemical test in the Bergey Manual of Systematic (Bacteriology) reference book for Klebsiella strain, confirmed that the used strain in this study probably belongs to K. terrigena species [13-17]. |
| Taguchi design of experiments |
| In the work ahead, Taguchi method for optimization of the parameters was followed [18]. The selection of the factors is based on the most critical parameters that can strongly affect the progression of the chemical processes. The design of the experiments was done using five different factors such as pH (A), Temperature (B), Dye Concentration (C), Carbon Source (D) and Nitrogen Source (E) which are mutually exclusive (Table 1). It should be noted that, added amount of the Carbon and Nitrogen sources to the MSM culture media was 10 and 5 g/L respectively. In order to achieve the MSM media with different range of pH from 5 to 8, the acetic acid/sodium acetate (for 5.0 and 5.6), phosphate (for 6.0, 6.6 and 7) and Tris (for 7.6, 8.0 and 8.4) buffers were used. The four parametric levels were selected so that a reasonable range of parameter variations are included. |
| After selecting the effective parameters in 4 different levels, the L-16 orthogonal array of TOM was used to set up the experiments (Table 2). The different parameters involved in designing desired degradation time and the degradation efficiency. Admitted by, the maximum degradation percent in the shortest possible time would be desirable. |
| Results and Discussion |
| Effect of initial bacterial biomass |
| In the present study, to observe the effect of initial bacterial biomass on the MG degradation, estimation of the optimum Klebsiella biomass on the removal of the 50 mg/l MG was evaluated by different inoculums size (0.1-0.5 OD) during various contact times. The obtained results showed that the dye removal increased significantly along with an increase in the biomass concentration until it reached the value of 100% for the biomass which was adjusted at 0.35 OD at 600 nm. Therefore, the 0.35 OD is the best for truly degradation of the MG by Klebsiella strain with high efficiency. |
| Taguchi design and optimization |
| The parametric comprehension for MG biodegradation by the K. terrigena strain and an attempt to quantitatively study the impact of individual parameter in prominent degradation of MG has led to the exploitation of statistical support system such as Taguchi Design. This design of experiment has got a completely controlled task of selecting the best parameters for MG degradation (desired degradation percent at the short possible time). Taguchi method uses the S/N ratio to measure the quality characteristic deviating from the desired value. The S/N ratios are different according to the type of characteristic. In the case that bigger characteristics are better, the S/N ratio is defined as [11]. |
 (2) (2) |
| Where yi is the characteristic property, n is the replication number of the experiment. The unit of S/N ratio is decibel (dB),which is frequently used in communication engineering. S/N ratio for decolorization of the solution containing MG calculated using Eq. 2. |
| In this study, five four-level process parameters, i.e. pH(A), Temperature(B), Dye concentration(C), Carbon source(D) and Nitrogen source(E) were evaluated by L-16 array type of TOM. The interaction effects of the process parameters become significant. After fulfillment of the experiments proposed by L-16 orthogonal array in triplicate under the various conditions listed in the orthogonal table (Table 2) and calculation of the relevant degradation percent and means, the obtained results were entered in the Qualitek-4 software. Considering bigger S/N ratio is better as criteria for determining the degradation percent. The Software defined and introduced optimum experimental conditions in terms of physical conditions (pH, Temperature, Initial Dye Concentration, Carbon Source and Nitrogen Source) with a statistical estimation based on the mean of S/N ratio (bigger S/N ratio is better) (Table 3). In the optimum conditions by three time repetition of the experiment, tried the final obtained results (% MG degradation) to be in the range determined by the software (99.998 ± 0.51). The obtained results showed an acceptable confidence interval of 90%. |
| In the following, to better comprehend the relative effect of the different critical experimental parameters on the biodegradation of the MG was obtained by analyzation of variance, which is called by the term Analysis of Variance (ANOVA). The relative importance of the experimental parameters with respect to the biodegradation was investigated to determine more accurately the optimum combinations of the critical parameters by using ANOVA. The results of ANOVA for the Degradation outputs are presented in table 4. |
| According to this analysis, Initial Dye Concentration and nitrogen source factors have more and less effect on the results of the done experiments respectively. Statistically, F-test provides a decision at some confidence level as to whether these estimates are significantly different [19,20]. A larger F-value indicates that the variation of the process parameter makes a big change on the performance. Percent contribution indicates the relative ability of a factor to reduce variation. For a factor with a high percent contribution, a small variation will have a great influence on the performance. |
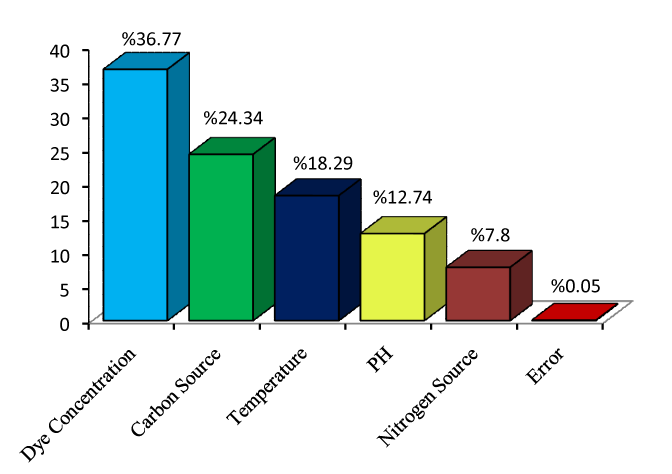
| Eventually, the relative influence of factors and their interactions resulted from the bar graph (Figure 2) derived from ANOVA analysis indicate that, dye concentration (%36.77), carbon source (%24.34), temperature (%18.29), pH (%12.74) and nitrogen source (%7.80) respectively have the greatest effect on the done experiment results. |
| Average effects of the experimental parameters on degradation |
| Average effects of pH and Temperature: The medium pH is also an important factor with regard to decolorization. The pH has a major effect on the efficiency of dye decolorization, and the optimal pH for dye removal is often between 6.0 and 10.0 [10]. The curve of average pH effect obtained by TOM showed that, the pH of 6 (level 2) is the most effective among this factor’s levels. After that, the level four (pH=8) and then level three (pH=7), are in the next rank of importance. There was no effect on the experiment results at the pH of 5, indicating the bacteria couldn’t grow at this pH. Furthermore, temperature is a factor of paramount importance for all processes associated with microbial vitality, including the remediation of water and soil. Also, the average temperature effects curve confirmed that, the effects of temperature on the degradation process are as follow: level 2 (30°C)> level 3 (35°C)> level 4 (40°C)> level 1 (25°C). |
| Average effects of initial dye concentration: The decolorization of MG was studied at the various increasing concentration of dye i.e. from 25, 50, 75 and 100 mg/L and the curve of average effect of dye concentration obtained by TOM showed in the figure 3. Experimentally, it was found that, a dye concentration of 25 ppm (Level 1) has the greatest effect among the other levels of this factor based on the obtained amount of OD (degradation 100%) during the 72 h incubation. Dye concentration of 50 (level 2) and 75 ppm (level 3) were in the next rank, in these concentrations of dye, only 40-50% degradation was observed during 72 h incubation. But the remarkable thing was that, in the initial dye concentration of 100 ppm (level 4) not only after 72 h incubation the degradation value of dye was 0%, but also with continued incubation for 7 days no change was observed in the initial dye concentration, indicating toxicity of MG at the higher dye concentration, that lead to death of the bacteria. Meantime, all of the above processes were followed by UV-Vis spectroscopy at the MG maximum wavelength (620 nm). |
| Effects of carbon and nitrogen source on degradation: Azo dyes are deficient in carbon sources, and the biodegradation of dyes without any supplement of carbon or nitrogen sources is very difficult [10]. Hereby, effect of carbon and nitrogen sources on decolorization of MG progress was studied in this section. The results showed that, the maximum performance of degradation (100%) is obtained using the Lactose (level 4) as carbon source. And then, starch, sucrose and glucose, were in the next ranks respectively. Also, 100% degradation was obtained using NH4NO3 (level 3) as nitrogen source during 72 h incubation. Hereby, effects of other nitrogen sources to degradation of MG are as follows: (NH4)2SO4 (level 4), Yeast extracts (level 1), Peptone (level 2). Therefore, the best performance of the degradation will be observed at simultaneous presence of the lactose and ammonium nitrate as carbon and nitrogen source respectively. |
| Analytical methods |
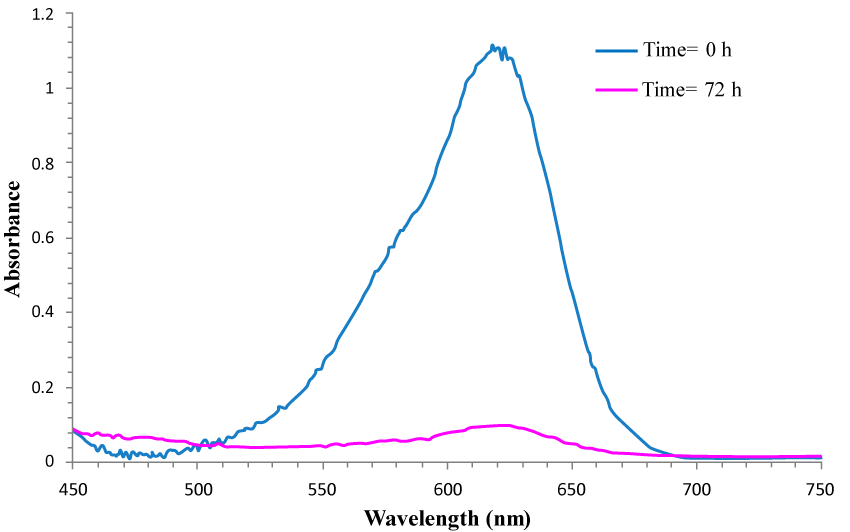
| In the present study, In order to follow the bacterial dye decolorization process, some various analytical techniques such as UV-Vis spectroscopy, FT-IR spectroscopy and HPLC were truly used. UV–Vis spectroscopy is the primary and popular technique to determine dye decolorization [10]. As can be obviously seen from figure 4, the disappearance of the sharp peak at the maximum wavelength of MG (λmax=620 nm) is observed after decolorization of the azo dye (MG), indicating that after 72 h incubation, all of the dye in the medium has been degraded by the bacteria K. terrigena (100% degradation). |
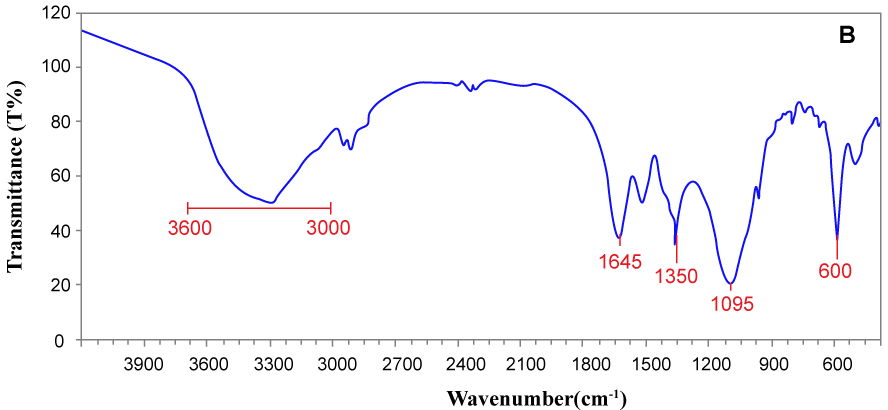
| Also, fourier transform infrared spectroscopy (FT-IR) is widely used as a proper technique for investigation of dye degradation experiments. In dye degradation studies, FT-IR spectrum enables the determination of both the type and strength of interactions that occur within azo dyes containing different functional groups after biodegradation by bacteria, and thus it acts as a valuable analytical tool [10]. On account of this, in addition to analytical methods mentioned above, the FT-IR spectroscopy in the mid-IR region of 400-4000 cm-1 was truly used to investigate the biodegradation process and the results were shown in figure 5a and figure 5b. The samples were mixed with spectroscopically pure KBr and the analyses were carried out. As can be obviously seen from table 5, FT-IR spectra of control MG showed the specific peaks in fingerprint region (500 to 1500 cm-1) for the monosubstituted and para-disubstituted benzene rings which is supporting to the peak at 1585 cm-1 for the C=C stretching of the benzene rings. Also, the peak at 1130 cm-1 is for aromatic C–N stretching vibrations. At 2870 cm-1 showed C–H asymmetric stretching and free -NH2 group showed amide antisymmetric stretching vibration at 3425 cm-1. The peak at 725 cm-1 indicates symmetric out of plane bending of the ring hydrogens. The peaks at 1435, 1350, and 800 cm-1 were observed for -CH2 scissoring, -CH3 asymmetric bend, and-NH2 wag. The sharp peak at 725 cm-1 corresponds to concerted rocking of all of the -CH2’s. Furthermore, The FT-IR spectra of extracted product showed peak at 1350 cm-1 for -C-N-stretch with supporting peak at 1095 cm-1 and wide peak around 3000-3600 cm-1 for N-H stretch represents the formation of primary and secondary amines. A peak at1645 cm-1 for C=C and peak at 1350 cm-1 for -CH2 scissoring bend shifted. Eventually, the sharp peak at 600 cm-1 for disubstituted benzene derivatives indicates aromatic nature of amines. |
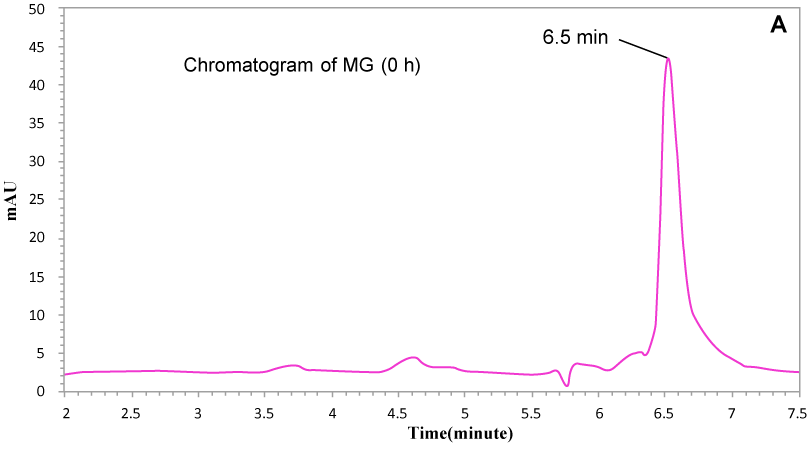
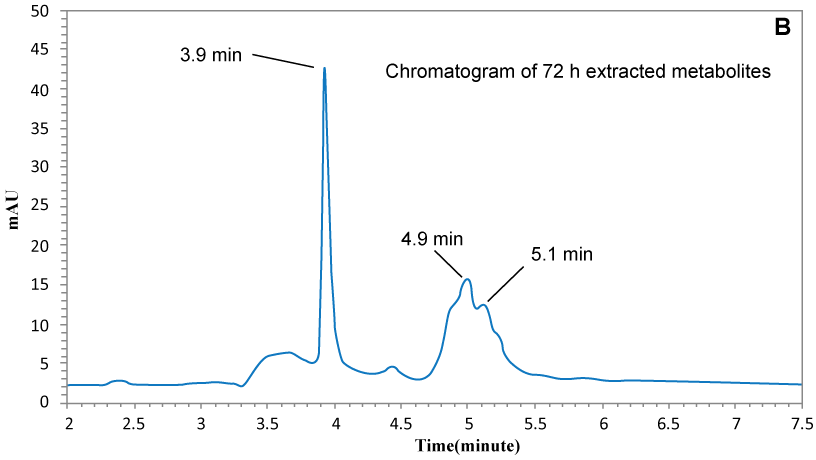
| Moreover, HPLC chromatogram of extracted sample after complete decolorization (Figure 6a and Figure 6b) confirmed the degradation of MG into metabolites. Control MG (not degraded dye) showed retention time (Rt) at almost 6.5 minutes and metabolites were observed at 3.9, 4.9 and 5.1 minutes and no peaks were observed at 6.5 min, indicating that all of the MG was completely removed from the medium and converted to metabolites by K. terrigena. |
| Comparative study |
| In this section, the highlighted good and bad characteristics of the present study were compared with previously reported biodegradation methods of the MG as follow: a) in term of methodology, using the TOM for optimization of the experimental conditions is one of the main advantages of the present work. This idea not only allows the researchers to design the experiments in low cost and low time, but also will give the highest efficiency that will be truly comparable with the methods with similar objectives. b) Because of the similar dye degradation products of the previous works with the present study based on similar IR spectra, it is concluded that, the proposed MG degradation method in the present study will put down the MG toxicity as good as previously reported methods. c) The MG dye will be completely degraded by the Klebsiella bacterium (100% degradation), but unfortunately, biodegradation of the MG by K. terrigena at the optimum conditions consume too much time (72 h) for completion of the degradation in compare with other reported methods. The additional comparison was shown in table 5. |
| Conclusion |
| The present study illustrates biodegradation of the inherently toxic Malachite Green dye into non-toxic compounds by Klebsiella strain bacterium at the optimum experimental conditions proposed by Taguchi statistical method. The obtained results showed that, 100% degradation of the mentioned dye can be achieved at the optimized critical conditions of pH6 (level 2), Temperature 30°C (level 2), Initial Dye Concentration 25 ppm (level 1), Carbon Source Lactose (level 4) and Nitrogen Source NH4NO3 (level 3) within 72 h. Based on the ANOVA, Initial Dye Concentration and Nitrogen Source parameters respectively, have the maximum and minimum impact on the degradation efficiency. UV-Vis spectroscopy, FT-IR spectroscopy and HPLC were truly used to follow the degradation process that all of them confirmed successfully degradation of the MG during 72 h. Meanwhile, results of this study was compared with the recently reported similar studies using various microorganism to degrade the MG dye indicating excellence of the present work in more aspects. |
References
|
Tables and Figures at a glance
| Table 1 | Table 2 | Table 3 | Table 4 | Table 5 |
Figures at a glance
 |
 |
 |
 |
| Figure 1 | Figure 2 | Figure 3 | Figure 4 |
 |
 |
 |
 |
| Figure 5a | Figure 5b | Figure 6a | Figure 6b |
Relevant Topics
- Anaerobic Biodegradation
- Biodegradable Balloons
- Biodegradable Confetti
- Biodegradable Diapers
- Biodegradable Plastics
- Biodegradable Sunscreen
- Biodegradation
- Bioremediation Bacteria
- Bioremediation Oil Spills
- Bioremediation Plants
- Bioremediation Products
- Ex Situ Bioremediation
- Heavy Metal Bioremediation
- In Situ Bioremediation
- Mycoremediation
- Non Biodegradable
- Phytoremediation
- Sewage Water Treatment
- Soil Bioremediation
- Types of Upwelling
- Waste Degredation
- Xenobiotics
Recommended Journals
Article Tools
Article Usage
- Total views: 15264
- [From(publication date):
January-2013 - Dec 20, 2025] - Breakdown by view type
- HTML page views : 10491
- PDF downloads : 4773
