Cost Emission of Pm10 on Human Health Due to the Solid Waste Disposal Scenarios, Case Study; Tehran, Iran
Received: 12-May-2013 / Accepted Date: 17-Jun-2013 / Published Date: 22-Jun-2013 DOI: 10.4172/2157-7617.1000139
Abstract
Nowadays, due to increasing the waste generation around the world assessing the adverse effects such as environmental issues is becoming a matter of focus. Moreover, solid waste management systems are known as one of main PM10 sources. However, various disposal methods have interesting relations with the PM10 production. In this study, different scenarios of solid waste management for municipal waste of Tehran are selected to assess the effects of PM10 on the human health in the nearby region (radius of 50 km). Hence, based on the life cycle assessment of the generated waste the production amounts of PM10 for four chosen scenarios are calculated. In the next step, with the application of Riskpoll model the cost damage of 12 illnesses are evaluated. Finally, due to the results scenario four with the combination of 70% composting plus 22% incineration and land filling (8% plus the residues) leads to the less damage cost on human health rather than the other scenarios. In addition, mortality YOLL, Chronic Bronchitis and restricted activity days have the major proportion of adverse effects in the 12 evaluated illnesses.
Keywords: Municipal solid waste; PM10; Emission cost; IWM; Riskpoll; Tehran
9624Introduction
There are many studies proved the adverse effects of Particulate Matter (PM) on the human health such as [1-3]. Moreover, major sources of these contaminates are large combustion installations, cement factories, road traffics and waste disposal facilities [4-8]. Hence, due to increasing solid waste generation in developing and third world countries, the volume of land filled wastes are increasing day by day which can lead to produce significant amounts of PM10.
In general, air pollutants can cause enormous social-economic and environmental losses. For instance, the emission costs on human health due to the air pollutants in America was fluctuated between 55 and 670 million Dollars from 1990 to 1991, which was calculated by the America’s damage estimation function [9]. Moreover, in 1992 the annual value of a human life is appraised at 3 million Dollars in America, which is known as statistical value of life whilst in Italy the cost of mortality is estimated at 16443.8 million Dollars [10].
In addition, in New Zealand every year, air pollution from all sources was estimated to cause more than 1,600 premature deaths, 930 hospitalizations and 2.6 million restricted activity days in urban areas [11]. However, in New Zealand the drawbacks of these pollution are estimated roughly $1.62 billion per year. It should be noted that, PM10 emissions are main pollutants and known as the main reason of these costs.
Therefore, to address these problems many progresses in the analysis of environmental damage costs are conducted. For instance, a statistical modeling and optimization framework for establishing high-resolution PM10 emission inventory was studied in China [12] Moreover, biomass-derived liquid cooking fuels for household use in rural areas was studied in China, however the results showed replacing the biomass-derived liquid fuels leads to enormous reduction in rural mortality imputable to air pollution, with even greater health profits collaborated with non-fatal endpoints.
Moreover, there are other studies which evaluate the external costs of energy are conducted in Europe and US in recent years such as ExternE and ORNL/RFF researches [13-16]. In addition, some researches such as Pope measured the chronic effects of air pollution on mortality YOLL (Years of Life Lost) leading to major changes in the methodology [17].
Thus, within ExternE a bottom-up methodology known as Impact- Pathway-Approach, has been developed and applied to assess impact and damage cost of a pollutant, tracing the passage of the pollutant from where it is emitted to the affected receptors (population, crops, forests, buildings, etc.) [13-15,18]. Also, there are some studies that applied Externe methodology with LCA methodology such as a study that identifies the best recovery strategies from both an environmental and an economic point of view using integration of Life Cycle Assessment (LCA), ExternE and comprehensive analysis [19].
The quantification of damage costs has many important applications, such as guiding environmental regulations (for example, determining the optimal level of the limit for the emission of a pollutant), estimating the socially optimal level of a pollution tax, identifying technologies with the lowest social cost, evaluating the benefits of improving the pollution abatement of an existing installation such as a waste incinerator, optimizing the dispatching of power plants or "Green accounting", i.e. including corrections for environmental damage in the traditional accounts of Gross National Product (GNP).
Tehran as the capital city of Iran has more than eight million inhabitants leading to 7500 tons/day waste generation. As indicated in Figure 1, Aradkuh disposal center (Kahrizak Landfill) is the currently used to dispose all solid waste in Tehran [20]. The amount and composition of Tehran waste collected and managed in Aradkoud is given in Table 1. In addition, the Life Cycle Assessment (LCA) methodology is considered to evaluate the rate of PM10 production due to various waste disposal scenarios. There are a few studies which were conducted the LCA of solid waste in Iran such as Lavan solid waste management [21].
| Waste type | Mass (%) | Volume (%) | Mass (ton/day) |
|---|---|---|---|
| wet waste | 67.8 | 26.4 | 5085 |
| bread | 1 | 2.7 | 75 |
| Soft plastic | 2.2 | 14.8 | 165 |
| hard plastic | 0.6 | 4 | 45 |
| PET | 0.7 | 9.7 | 52.5 |
| plastic bags | 6.2 | 16.8 | 465 |
| paper | 4.4 | 4 | 330 |
| paper(card board) | 3.7 | 5.1 | 277.5 |
| ferrous metals | 1.6 | 1.1 | 120 |
| non-ferrous metals | 0.2 | 0.1 | 15 |
| fabric (textile) | 3.4 | 9.4 | 255 |
| glass | 2.4 | 2.2 | 180 |
| wood | 1.7 | 1.5 | 127.5 |
| tiers | 0.7 | 0.6 | 52.5 |
| leather | 0.6 | 0.4 | 45 |
| dust & rubble | 1.3 | 0.6 | 97.5 |
| special waste (health care waste) | 1.6 | 0.7 | 120 |
| Total | 100 | 100 | 7507.5 |
Table 1: MSW components and characteristics in Aradkuh Center.
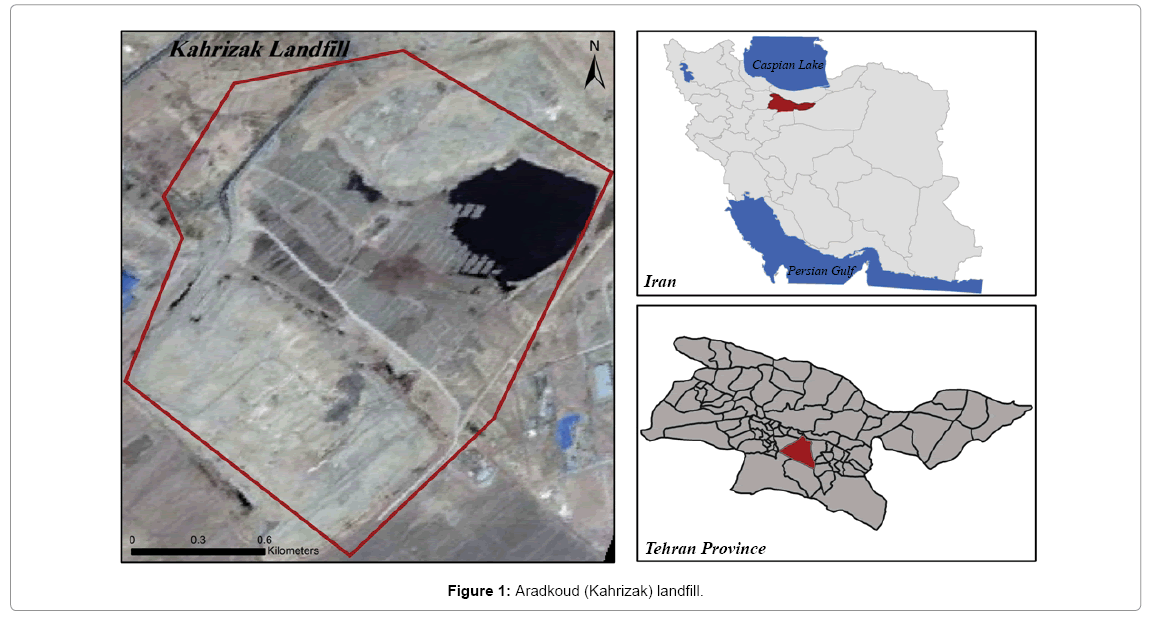
Figure 1: Aradkoud (Kahrizak) landfill.
In this study various impacts of the PM10 on human’s health including Mortality YOLL [22], chronic Bronchitis [23], restricted activity days [24], respiratory hospitalization [25], Chronic cough, children [26], elderly congestive heart failure, adult asthmatics cough [27], Bronchodilator use (adult asthmatics) [27], Lower respiratory symptoms (adult asthmatics) [27], Bronchodilator use (children asthmatics) [28], children asthmatics cough [29] and Lower respiratory symptoms (children asthmatics) [28] are assessed for different solid waste management scenarios.
This study aims to evaluate the emission costs of the PM10 air pollutants for the Tehran’s solid wastes disposal facility in Aradkoud center based on the Life Cycle Assessment and ExternE methodologies on human’s health.
Methodology
In the first step, four scenarios are presented according to the combinations of various solid waste management methods including composting, incineration and land filling with respect to regional conditions. The details of the scenarios and the waste allocated data are given in Figure 2 and Table 2. As can be seen, land filling, composting and incineration are chosen as the waste management processes. The land filling is considered without leachate and gas collection system. The total organic wastes are sent to the composting facilities whereas papers, woods, leathers, plastics and textile wastes are gathered to burn in the incineration plant.
| scenario | Compost (%) | Incineration (%) | Landfill (%) | Residue compost (%) | Residue incineration (%) | Final landfill (%) |
|---|---|---|---|---|---|---|
| a | b | c | d | e | ||
| 1 | 0 | 0 | 100 | 0 | 0 | 100 |
| 2 | 35 | 0 | 65 | 7 | 0 | 72 |
| 3 | 70 | 0 | 30 | 14 | 0 | 44 |
| 4 | 70 | 22 | 7 | 14 | 7 | 28 |
Table 2: Disposal solid waste scenarios.
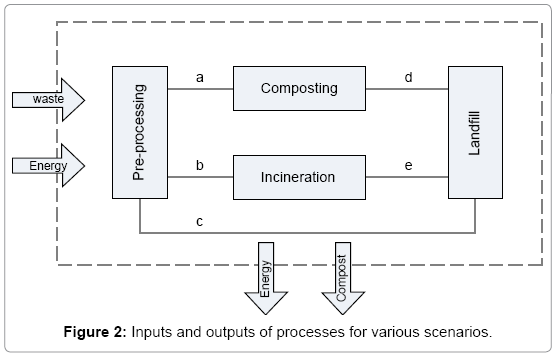
Figure 2: Inputs and outputs of processes for various scenarios.
Secondly, the amount of PM10 for each scenario (Figure 3) due to the life cycle of the wastes with the application of Integrated Waste Management (IWM) modeling software is calculated using ISO- 14040 and ISO-14044 standards methods [30,31]. In the next step, the economic values of the emissions on human health are calculated with the use of Riskpoll (Version 1.051, August 2004) modeling software which is an integrated risk assessment program for calculating health and environmental impacts and costs.
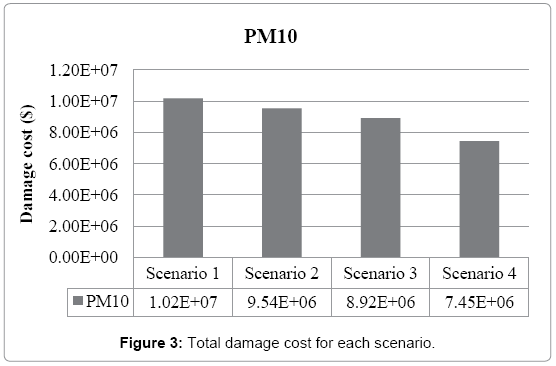
Figure 3: Total damage cost for each scenario.
For this study the functional unit due to the LCA methodology was chosen as the average amount of municipal generated waste of Tehran per day. Therefore, the daily waste generation of Tehran (7500 ton/day in 2011) is considered as the input of the system.
In addition, health impacts of air pollution are calculated using an impact pathways analysis, which traces the fate of a pollutant in the environment from point of emission into the air, to environmental dispersion and eventual receptor uptake. Health impacts such as loss of life expectancy (mortality YOLL) and various morbidity diseases (e.g., asthma attacks, chronic bronchitis and hospital visits) are considered as the main calculation in this model. However, quantification of the impacts and damage costs in the Riskpoll software follows the methodology developed by the ExternE Project of the European Commission and the multimedia impact assessment is based on the transfer factors published by the US Environmental Protection Agency.
Some local data are used in Riskpoll model, which are given in Table 3. These data were gathered from the nearest weather station to the Kahrizak center.
| Meteorological and location data | |
| 35.52 | Source Longitude (deg) |
| 51.56 | Source Latitude (deg) |
| 291.4 | Mean Air Temperature (°K) |
| 7.5 | Mean Local Wind Speed (m/s) |
| 10 m | Anemometer’s Height |
| 50 | Radius of Local Domain (km) |
| 50 | Regional Receptor Density (person/km) |
| 1273.9 | Local Receptor Density (person/km2) |
Table 3: Characterizations of Aradkouh used in Riskpoll model.
It should be mentioned that the inputs of IWM model are considered according to the Table 1 and their details, which they are not presented here. Moreover, Riskpoll model is also calibrated for the Tehran regional conditions and the results are based on the functional unit, which was chosen as the average amount of municipal generated waste of Tehran per day. Thus, the cost values are for a day.
For the countries that have not damages’ costs such as Iran, we use the damage costs data from other countries (Europe Union’s data based on the EXTERNE project was chosen to use) and calibrated with the following formula:
Unit cost in country=Unit cost in EU * (PPPGNP country/ PPPGNPEU) (1)
where PPPGNP is Purchasing Power Per capita equivalent to Gross National Product in dollar terms. With respect to central bank of Iran, PPPGNP for Iran is $13053 and according to the World Bank stats for Europe Union (EU) PPPGNP is $31607 in 2011[32]. So, the unit cost in Iran is 0.413 than the EU. So, the unit cost of damage in Iran can be obtained from multiplying 0.413 to the EU’s unit of damage.
Results and Discussion
As seen in Table 4, scenario one produces the more PM10 rather than the other three scenarios, which leads to the higher damage costs too. However, scenario four produces the least PM10, which leads to the least adverse impacts on human health. In addition a relative connection is founded among the PM10 amount, allocated waste to landfill or composting plant. However, the damage costs of all 12 illnesses are assessed and demonstrated in Table 5. The details are discussed below.
| Scenario 1 | Scenario 2 | Scenario 3 | Scenario 4 | |
|---|---|---|---|---|
| PM10 (Kg/day) | 2045.7995 | 1920.0977 | 1794.396 | 1499.299 |
| Damage Cost ($/day) | 1.02E+07 | 9.54E+06 | 8.92E+06 | 7.45E+06 |
Table 4: The pollutants’ production for each scenario (kg/day per functional unit).
| Scenario 1 | Scenario 2 | |||||
|---|---|---|---|---|---|---|
| Exposure Response Function | Damage Cost | Lower Cost | Upper Cost | Damage Cost | Lower Cost | Upper Cost |
| Mortality YOLL | 6.11E+06 | 1.53E+06 | 2.45E+07 | 5.74E+06 | 1.43E+06 | 2.29E+07 |
| Chronic Bronchitis | 2.79E+06 | 9.30E+05 | 8.37E+06 | 2.62E+06 | 8.73E+05 | 7.86E+06 |
| Restricted activity days | 9.16E+05 | 3.05E+05 | 2.75E+06 | 8.59E+05 | 2.86E+05 | 2.58E+06 |
| Respiratory hospitalization | 3.76E+03 | 1.25E+03 | 1.13E+04 | 3.53E+03 | 1.18E+03 | 1.06E+04 |
| Chronic cough, children | 4.17E+04 | 1.39E+04 | 1.25E+05 | 3.92E+04 | 1.31E+04 | 1.18E+05 |
| Congestive heart failure, elderly | 3.55E+03 | 1.18E+03 | 1.07E+04 | 3.33E+03 | 1.11E+03 | 9.99E+03 |
| Cough, adult asthmatics | 1.72E+05 | 5.74E+04 | 5.16E+05 | 1.62E+05 | 5.38E+04 | 4.84E+05 |
| Bronchodilator use, adult asthmatics | 7.66E+04 | 2.55E+04 | 2.30E+05 | 7.19E+04 | 2.40E+04 | 2.16E+05 |
| Lower respiratory symptoms, adult asthmatics | 5.71E+03 | 1.90E+03 | 1.71E+04 | 5.36E+03 | 1.79E+03 | 1.61E+04 |
| Cough, children asthmatics | 3.54E+04 | 1.18E+04 | 1.06E+05 | 3.32E+04 | 1.11E+04 | 9.97E+04 |
| Bronchodilator use, children asthmatics | 9.12E+03 | 3.04E+03 | 2.74E+04 | 8.56E+03 | 2.85E+03 | 2.57E+04 |
| Lower respiratory symptoms, children asthmatics | 2.42E+03 | 8.06E+02 | 7.26E+03 | 2.27E+03 | 7.56E+02 | 6.81E+03 |
| Total | 1.02E+07 | 2.88E+06 | 3.66E+07 | 9.54E+06 | 2.70E+06 | 3.44E+07 |
Table 5: Damage cost of PM10 for each scenario 1 and 2.
The amount of PM10, which would be produced in scenario one, two, three and four are 2025, 1920, 1794 and 1499 kg per day, respectively. These amounts are estimated due to the life cycle assessment of the various allocated waste to different disposal systems in each scenario. However, it should be mentioned that these production amounts are consider in the time period of material production till it is be disposed as a waste. Therefore, there is a lack of information in the intensity of the PM10 production in this time period and also the region. So, the total amounts are assumed to be produced as a constant ratio in the studied region.
With respect to the Riskpoll’s results the amounts of damage costs of PM10 on human health are calculated which are shown in Table 4. Scenario one causes the most damage cost stands at 10.2 million dollars per day whereas scenario four causes the least at 7.45 million dollars per day.
The damage costs of each illness are given in Table 5. Costs are described in lower, upper and the average (named as damage cost) costs. However, the lower and upper costs are calculated based on the 68% confidence interval. As can be seen, mortality YOLL has the most proportion of damage costs rather than the other illnesses in all scenarios. After that, Chronic Bronchitis stands as the second damage cost. Moreover, the third significant costs are caused due to the restricted activity days. The damage costs of these three main illnesses for each scenario are illustrated in Figure 4. However, the other nine illnesses are demonstrated in Tables 5 and 6.
| Scenario 3 | Scenario 4 | |||||
|---|---|---|---|---|---|---|
| Exposure Response Function | Damage Cost | Lower Cost | Upper Cost | Damage Cost | Lower Cost | Upper Cost |
| Mortality YOLL | 5.36E+06 | 1.34E+06 | 2.14E+07 | 4.48E+06 | 1.12E+06 | 1.79E+07 |
| Chronic Bronchitis | 2.45E+06 | 8.16E+05 | 7.34E+06 | 2.04E+06 | 6.82E+05 | 6.13E+06 |
| Restricted activity days | 8.03E+05 | 2.68E+05 | 2.41E+06 | 6.71E+05 | 2.24E+05 | 2.01E+06 |
| Respiratory hospitalization | 3.30E+03 | 1.10E+03 | 9.89E+03 | 2.76E+03 | 9.18E+02 | 8.26E+03 |
| Chronic cough, children | 3.66E+04 | 1.22E+04 | 1.10E+05 | 3.06E+04 | 1.02E+04 | 9.17E+04 |
| Congestive heart failure, elderly | 3.11E+03 | 1.04E+03 | 9.34E+03 | 2.60E+03 | 8.67E+02 | 7.80E+03 |
| Cough, adult asthmatics | 1.51E+05 | 5.03E+04 | 4.53E+05 | 1.26E+05 | 4.20E+04 | 3.78E+05 |
| Bronchodilator use, adult asthmatics | 6.72E+04 | 2.24E+04 | 2.02E+05 | 5.61E+04 | 1.87E+04 | 1.68E+05 |
| Lower respiratory symptoms, adult asthmatics | 5.01E+03 | 1.67E+03 | 1.50E+04 | 4.18E+03 | 1.39E+03 | 1.26E+04 |
| Cough, children asthmatics | 3.11E+04 | 1.04E+04 | 9.32E+04 | 2.59E+04 | 8.65E+03 | 7.78E+04 |
| Bronchodilator use, children asthmatics | 8.00E+03 | 2.67E+03 | 2.40E+04 | 6.68E+03 | 2.23E+03 | 2.01E+04 |
| Lower respiratory symptoms, children asthmatics | 2.12E+03 | 7.07E+02 | 6.36E+03 | 1.77E+03 | 5.91E+02 | 5.32E+03 |
| Total | 8.92E+06 | 2.53E+06 | 3.21E+07 | 7.45E+06 | 2.11E+06 | 2.68E+07 |
Table 6: Damage cost of PM10 for each scenario 3 and 4.
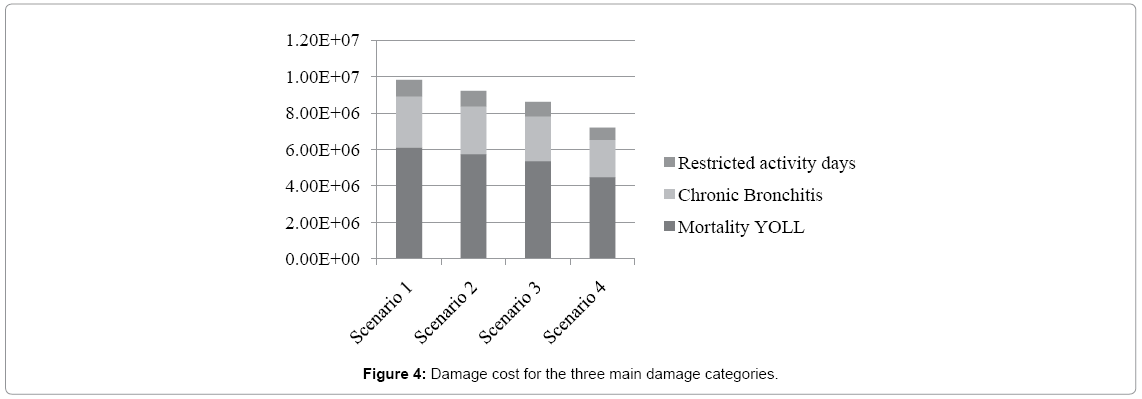
Figure 4: Damage cost for the three main damage categories.
Another issue that can be concluded from the results is the relative of PM10 and its damage costs on human health with the proportion of composting and land filling in the proposed scenarios. Firstly, from comparing scenario two and three, it can be concluded that increasing the amount of composted waste would decline the PM10 production in the system which would decrease the damage costs on human health, consequently. Secondly, according to the scenarios three and four, adding the incineration to the solid waste management system decrease the PM10 production and also decrease the adverse effects on human health too. The main reason of reducing the proportion of land filling causes a decrease in the production of PM10 is the transportation and covering process. Furthermore, in the composting process remarkable amount of water is added to fix the moisture, which decreases the probability of PM10 production. Moreover, usually burning waste in the incinerators is conducted under strict supervision and monitoring. Using Filters and controlling the outlet of the stacks decline the amounts of PM10 production. Although, composting and incineration methods produce less amounts of PM10 rather than land filling, in almost all solid waste management scenarios land filling as the final disposal is essential. Most of the disposal systems such as recycling, incineration or composting have residues, which need to be land filled.
To sum up, based on the results scenarios four (composting plus incineration and land filling) is chosen as the most proper solid waste management scenario in Tehran. However, this scenario leads to less PM10 production in the environment and also causes less damage costs on human health rather than the other three mentioned scenarios.
Discussion
This study aims to calculate the ratio of PM10 generation due to the various solid waste disposal methods and also the cost emission of the related impacts on human health are assessed. Four different scenarios of municipal solid waste management systems are compared. With respect to the results, scenario one (land filling) showed the most adverse effects and damage cost on the human health whereas scenario four (incineration plus composting and land filling) has less costs rather than the others. Moreover, increasing the proportion allocated waste to composting and incineration showed a significant decrease in the PM10 production and the consequence damage costs. On the other hand, the increase of land filling led to raise the amounts of PM10 production and also the followed damage costs.
Author highly recommended scenario four to be used in Tehran to decrease the adverse effects of PM10 and improve the air quality in the nearby region. Studying other pollutants such as SOx and NOx which are usually absorbed to PM10 is suggested for future research.
References
- Novi CD (2013) The indirect effect of fine particulate matter on health through individuals' life-style. J Socio Econ 44: 27-36.
- Morman SA, Plumlee GS (2013) The role of airborne mineral dusts in human disease. Aeolian Research 9: 203-212.
- Koh DH, Kim TW, Jang S, Ryu HW (2013) Dust exposure and the risk of cancer in cement industry workers in Korea. Am J Ind Med 56: 276-281.
- Torretta V, Rada EC, Panaitescu V, Apostol T (2012) Some considerations on particulate generated by traffic. UPB Sci Bull, Series D 74: 241-248.
- Othman M, Latif MT (2013) Dust and gas emissions from small-scale peat combustion. Aerosol and Air Quality Research 13: 1045-1059.
- Ciuta S, Schiavon M, Chist A, Ragazzi M, Rada EC, et al. (2012) Role of feedstock transport in the balance of primary PM emissions in two case-studies: RMSW incineration vs. sintering plant. UPB Sci Bull, Series D 74: 211-218.
- Ionescu G, Zardi D, Tirler W, Rada EC, Ragazzi M (2012) A critical analysis of emissions and atmospheric dispersion of pollutants from plants for the treatment of residual municipal solid waste. UPB Sci Bull, Series D 74: 227-240.
- Ragazzi M, Tirler W, Angelucci G, Zardi D, Rada EC (2013) Management of atmospheric pollutants from waste incineration processes: the case of Bozen. Waste Manag Res 31: 235-240.
- Chestnut LG, Rowe RD (1990) Preservation Values for Visibility Protection at the National Parks Research Triangle Park. Economic Analysis Branch, Office of Air Quality Planning and Standards, U.S. Environmental Protection Agency, Research Triangle Park, NC, USA.
- Borger BD, Wouters S (1998) Transport externalities and optimal pricing and supply decisions in urban transportation: a simulation analysis for Belgium. Reg Sci Urban Econ 28: 163-197.
- Kuschel G, Mahon K (2010) A Review and Update of HAPINZ for the Auckland Region. Internal Report 2010/004 prepared for the Auckland Regional Council.
- Cheng S, Zhou Y, Li J, Lang J, Wang H (2012) A new statistical modeling and optimization framework for establishing high-resolution PM10 emission inventory–I. Stepwise regression model development and application. Atmos Environ 60: 613-622.
- ExternE: Externalities of Energy (Vol. 1-10), Directorate- General XII, Science Research and Development. European Commission, Luxembourg.
- ORNL/RFF (1994) External Costs and Benefits of Fuel Cycles. Oak Ridge National Laboratory and Resources for the Future. Oak Ridge, TN, USA.
- Rowe RD, Lang CM, Chestnut LG, Latimer D, Rae D, et al. (1995) The New York Electricity Externality Study. Oceana Publications, Dobbs Ferry, New York, USA.
- Pope CA, Thun MJ, Namboodiri MM, Dockery DW, Evans JS, et al. (1995) Particulate air pollution as a predictor of mortality in a prospective study of U.S. adults. Am J Respir Crit Care Med 151: 669-674.
- Friedrich R (2011) The "ExternE" methodology for assessing the eco-efficiency of technologies. J Ind Ecol 15: 668-671.
- Pietrapertosa F, Cosmi C, Macchiato M, Salvia M, Cuomo V (2009) Life Cycle Assessment, ExternE and Comprehensive Analysis for an integrated evaluation of the environmental impact of anthropogenic activities. Renew Sust Energ Rev 13: 1039-1048.
- Abduli MA, Naghib A, Yonesi M, Akbari A (2011) Life cycle assessment (LCA) of solid waste management strategies in Tehran: landfill and composting plus landfill. Environ Monit Assess 178: 487-498.
- Fallah FS, Vahidi H, Pazoki M, limodehi FA, Aslemand A, et al. (2013) Investigation of Solid Waste Disposal Alternatives in Lavan Island Using Life Cycle Assessment Approach. Int J Environ Res 7: 155-164.
- Pope CA, Burnett RT, Thun MJ, Calle EE, Krewski D, et al. (2002) Lung cancer, cardiopulmonary mortality, and long-term exposure to fine particulate air pollution. JAMA 287: 1132-1141.
- Abbey DE, Lebowitz MD, Mills PK, Petersen FF, Beeson WL, et al. (1995) Long-term ambient concentrations of particulates and oxidants and development of chronic disease in a cohort of nonsmoking California residents. Inhal Toxicol 7: 19-34.
- Ostro BD (1987) Air Pollution and Morbidity revisited: a Specification Test. J Environ Econ Manage 14: 87-98.
- Dab W, Medina S, Quénel P, Le Moullec Y, Le Tertre A, et al. (1996) Short term respiratory health effects of ambient air pollution: results of the APHEA project in Paris. J Epidemiol Community Health 50 Suppl 1: s42-s46.
- Dockery DW, Pope CA (1994) Acute respiratory effects of particulate air pollution. Annu Rev Public Health 15: 107-132.
- Dusseldorp A, Kruize H, Brunekreef B, Hofschreuder P, de Meer G, et al. (1995) Associations of PM10 and airborne iron with respiratory health of adults living near a steel factory. Am J Respir Crit Care Med 152: 1932-1939.
- Roemer W, Hoek G, Brunekreef B (1993) Effect of ambient winter air pollution on respiratory health of children with chronic respiratory symptoms. Am Rev Respir Dis 147: 118-124.
- Pope CA, Dockery DW (1992) Acute health effects of PM10 pollution on symptomatic and asymptomatic children. Am Rev Respir Dis 145: 1123-1128.
- ISO-14040 (2006) Environmental management-Life cycle assessment-Principles and framework. International Organization for Standardization, Geneva, Switzerland.
- ISO-14044 (2006) Environmental management- Life cycle assessment-Requirements and guidelines. International Organization for Standardization, Geneva, Switzerland.
Citation: Hoveidi H, Aslemand A, Vahidi H, Limodehi FA (2013) Cost Emission of Pm10 on Human Health Due to the Solid Waste Disposal Scenarios, Case Study; Tehran, Iran. J Earth Sci Climate Change 4: 139. DOI: 10.4172/2157-7617.1000139
Copyright: ©2013 Hoveidi H, etal. This is an open-access article distributed under the terms of the Creative Commons Attribution License, which permits unrestricted use, distribution, and reproduction in any medium, provided the original author and source are credited.
Select your language of interest to view the total content in your interested language
Share This Article
Recommended Journals
Open Access Journals
Article Tools
Article Usage
- Total views: 15331
- [From(publication date): 7-2013 - Nov 10, 2025]
- Breakdown by view type
- HTML page views: 10457
- PDF downloads: 4874