Research Article Open Access
Determination of Glipizide, Glibenlamide and Glimeperide in a Tablet Dosage Form in the Presence of Metformin Hydrochloride by Ion Pair –Reversed Phase Liquid Chromatographic Technique
B. Udaykumar Rao and Anna Pratima Nikalje*Y.B. Chavan College of Pharmacy, Dr. Rafi q Zakaria Campus, Rauza Bagh, Aurangabad, M.S. India
- *Corresponding Author:
- Anna Pratima Nikalje
Y.B. Chavan College of Pharmacy
Dr. Rafiq Zakaria Campus, Rauza Bagh
Aurangabad, M.S. India
Tel/Fax: 91-0240- 2381129
E-mail: ana@k.st
Received date: October 10, 2010; Accepted date: November 03, 2010; Published date: November 05, 2010
Citation: Rao BU, Nikalje AP (2010) Determination of Glipizide, Glibenlamide and Glimeperide in a Tablet Dosage Form in the Presence of Metformin Hydrochloride by Ion Pair –Reversed Phase Liquid Chromatographic Technique. J Anal Bioanal Tech 1:105. doi: 10.4172/2155-9872.1000105
Copyright: © 2010 Rao BU, et al. This is an open-access article distributed under the terms of the Creative Commons Attribution License, which permits unrestricted use, distribution and reproduction in any medium, provided the original author and source are credited.
Visit for more related articles at Journal of Analytical & Bioanalytical Techniques
Abstract
The present work describes the development and validation of an isocratic HPLC method for the stability indicating assay of Glipizide (GPZ), Glibenclamide (GBD) and Glimeperide (GMD) in the presence of Metformin hydrochloride (MET) in pharmaceutical dosage forms using ion pair-reversed phase liquid chromatographic Technique. The ion pairing agent used was tetrabutyl ammonium hydrogen sulphate (TBHS). The TBHS 0.030 molar solution in water with pH 6.0 used as buffer. The composition of buffer with acetonitrile used was 50:50 (v/v) on reversed phase column bonded with octadecyl silane. The wave length used was 225 nm. The resolution between the closest peaks Glimeperide and Glibenclamide was more than 1.5 and all the three drugs gives a linear response (r2>0.999). The method used for all the three substances were found selective, precise, accurate and robust. The method can be used for quality control assay of the bulk and in finished dosage form as single component and combine with Metformin hydrochloride. The purpose of the method to study individually the stability of Glipizide, Glibenclamide and Glimeperide in the presence of Metformin hydrochloride as any such method is not reported so far.
Keywords
Ion pair, Reversed phase, UV detection
Introduction
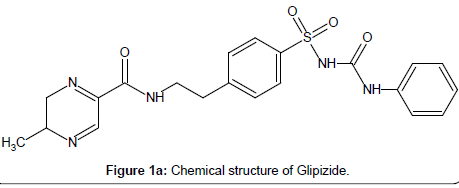
Glipizide chemically known as (1-cyclohexyl-3-[[4-[2-[[5- methylpyrazin-2-yl) carbonyl]-amino]ethyl] phenyl] sulphonyl] urea (Figure 1a), Glibenclamide chemically known as (1-[[4-[2-[5 chloro-2 methoxybenzoyl) amino]ethyl] phenyl] sulphonyl]-3-cyclohexylurea (Figure 1b) and Glimepiride chemically known as (1-[ [4-[2-(3-ethyl-4- methyl-2-oxo-3-pyrroline-1-carboxamide)-ethyl] phenyl] sulphonyl]-3- trans-(4-methylcyclohexyl) urea (Figure 1c) is used as an antidiabetic agent as a single dose or with Metformin hydrochloride in patients with Type 2 diabetes mellitus. The Type 2 diabetes mellitus is a progressive disorder and although oral monotherapy is often initially successful, it is associated with a secondary failure rate, which contributes to the development of long-term diabetes complications resulting from persistent hypoglycemia. The accumulated evidence suggests that combination therapy using oral anti diabetic agents with different mechanisms of action may be associated with fewer side effects than higher dose monotherapy and may achieve similar or better glycemic control [1].
Literature survey reveals that a number of analytical methods have been developed for the quantitative determination of Glipizide, Glibenclamide and Glimeperide in biological fluids [2-6], in pharmaceutical dosage form [7-16]; using HPLC- Mass spectrometry [17] and using HPLC-Evaporative spray detector and Mass spectrometry [18]. All the above reported methods can be used for routine quality control analysis of GPZ, GBD and GMD either in biological fluids or in pharmaceutical dosage form. The GPZ, GBD and GMD are mostly prescribed with MET in extended release tablet form. None of the above method was described stability indicating of these components in the presence Metformin Hydrochloride. The present work illustrates development of simple, rapid, precise and stability indicating ion pair reversed phase liquid chromatographic techique for quantitation of above sulfonyl urea in the presence of Metformin Hydrochloride. All the degraded products are separated and not interfering with principal peak of GPZ, GBD and GMD. The method can be applied for stability study of GPZ, GBD and GMD in combination with Metformin hydrochloride.
Experimental
Materials and reagents
A sample of Glipizide, Glibenclamide, Glimeperide and Metformin hydrochloride of assigned purity 99.4%, 99.6%, 99.5% and 99.8% of pharmaceutical grade was received from USV Ltd-India, Sun pharmaceuticals Ltd. - India and Biocon Pharmaceuticals Ltd.-India. Glide tablet of strength Glipizid 5mg, Glynase MF tablet of strength 500mg metformin hydrochloride and Glipizide 5mg, Daonil tablet of strength Glibenclamide 5mg, Glucored forte tablet of strength 500mg metformin hydrochloride and Glibeclamide 5mg, Glyrex-4 tablet of strength Glimeperide 4mg, Glycomet GP-2 tablet of strength 500mg metformin hydrochloride and Glimeperide 2mg, all are procured from the market. Tetrabutyl ammonium hydrogen sulphate of analytical grade purchased from Merck-Mumbai (India). HPLC grade acetonitrile was purchased from Qualigens–Mumbai (India). High purity water was prepared by Millipore milli Q plus purification system.
HPLC instrumentation and condition
The HPLC system consisted of Shimadzu LC- 2010CHT with quaternary gradient pumps attached with UV and PDA detector. The chromatographic separations were performed microbondapak C-18 column, 300mm×3.9mm, 10µ column maintained at 25°C using column oven, eluted with mobile phase at the flow rate of 1.0ml/min.The mobile phase consisted of a mixture of 0.03 molar TBAHS in water adjusted the pH to 6.0 with 1N sodium hydroxide and acetonitrile (50:50v/v), filtered through 0.45µm nylon filter and degassed in ultrasonic bath prior to use. Diluent used was mixture of methanol and acetonitrile 50:50 v/v. Measurements were made with injection volume 10µl and ultraviolet (UV) detection at 225nm. The output signal was integrated using LC-solution soft ware.
Standard and sample preparation
The standard stock solutions 1000µg/ml each of GPZ, GBD and GMD were prepared separately by dissolving working standards in diluent and diluted to desired volume with same diluents. Standard calibration solution of GPZ, GBD and GMD having the concentration in the range of 100µg/ml to 300µg/ml were prepared by diluting stock solution with diluent.
Analysis of dosage form
Twenty tablets separately were weighed, their mean weight determined and crushed in mortar. An amount of powdered mass equivalent to 10mg of Glipizide, Glibenclamide and Glimeperide were transferred into a 50ml volumetric flask separately containing 25ml diluent, mechanically shaken for 10 min, ultrsoniccated for 5 min and then diluted to volume with diluent and filtered. The first 10ml of the filtrate was rejected and the subsequent was used.
Results
Method development
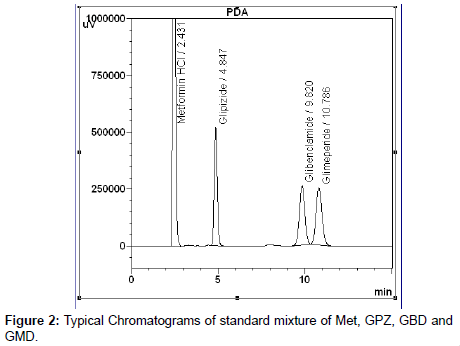
The primary target in developing this LC method is to achieve good separation between Metfomin hydrochloride from GPZ, GBD and GMD and thereby estimating the content of above drug by single analytical method. Separation between Metformin Hydrochloride and sulfonyl urea was observed using various other mobile phases and different organic modifier. But degraded product of sulfonyl urea and Met interfering with GPZ, GBD and GMD peak. After choosing an ion pairing agent tetrabutyl ammonium hydrogen sulphate of 0.03 molar aqueous solution adjusted with pH 6.0 and acetonitrile in 1: 1 ratio, it was found that the Metformin hydrochloride separates without retaining in the column and all other sulphonyl urea and degradants separates well in the given chromatographic condition. Finally mobile phase consisted of said composition adopted, which produces good resolution, reasonable retention and acceptable peak shape for all the three drugs GPZ, GBD and GMD. The tablet matrix was also determined to see if any interference from them existed. No significant peaks from matrix were observed in chromatogram, indicating no interference from the formulation matrix. The validation was carried out for Glipizide, Glibenclamide and Glimeperide separately in combination with Metformin Hydrochloride. A typical chromatogram of standard mixture of MET, GPZ, GBD and GMD as shown in Figure 2.
Degradation studies
Forced degradation of GPZ, GBD and GMD tablet sample in combination with Metformin hydrochloride carried out under different stress condition (Heat, light, hydrogen-peroxide, acid and base) were prepared for further evaluation of the selectivity of the proposed LC method. The selectivity was studied only for GPZ, GBD and GMD and not for Metformin Hydrochloride as this was not retaining in the column. For preparing acid and base induced degradation product 5ml of 0.1M HCl and 0.1M NaoH were separately added to 10mg each of GPZ, GBD and GMD equivalent tablet powder of combined tablet and exposed to 80°C for 6 h. The degraded samples were then neutralized and placed it in 50ml volumetric flask and prepared as described in the sample preparation.
For preparing hydrogen peroxide induced degradation product 0.5ml hydrogen peroxide (30%v/v) was added to 10mg each of GPZ, GBD and GMD equivalent tablet powder and exposed to 80°C for 6h. The degraded sample was placed it in 50 ml volumetric flask and prepared as described in the sample preparation. The forced degradation in acidic, basic and oxidation media performed in the dark in order to avoid the possible effect of light. For preparing dry heat degradation product 10mg each of GPZ, GBD and GMD equivalent tablet powder and stored at 80°C for 6h under dry heat condition in the dark and then cooled to room temperature. The degraded sample solution was prepared as described in the sample preparation.
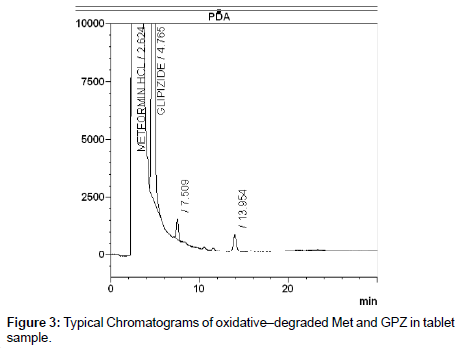
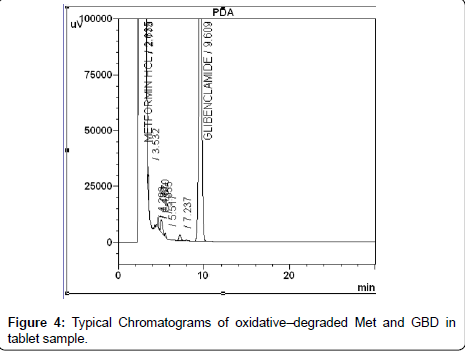
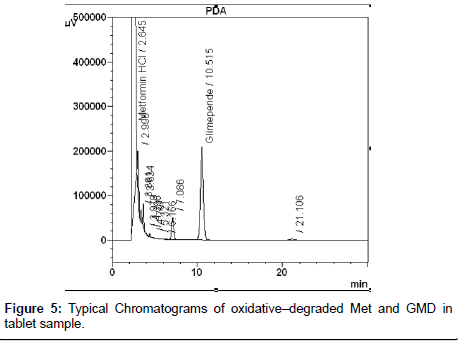
The photochemical stability of the drugs were also studied by exposing the tablet powder 1,200 K lux of visible light and 200 W h m-2 of UV light by using photo stability chamber, preceded the same as indicated for dry heat degradation. The resulting solutions were used as the degraded sample solution and determined under described chromatographic condition. Typical chromatograms of all degraded tablet samples were shown in Figure 3, Figure 4 and Figure 5. The degraded samples were compared to a tablet sample without degradation. The spectral homogeneity (Peak purity) 200-400nm was determined in the forced degraded samples. The threshold was set at ≥0.990. The peak purity, peak threshold and percent degradation (Table 1) for 10mg each of GPZ, GBD and GMD were demonstrated that the proposed LC method was able to separate each drug from degradants generated during forced degradation studies from both Metformin hydrochloride and Sulfonyl urea.
| Stress condition | Peak Purity | Single point threshold | % degraded (both Metformin and sulfonylurea) | ||||||
| GPZ | GBD | GMD | GPZ | GBD | GMD | GPZ | GBD | GMD | |
| Light | 1.0000 | 1.0000 | 1.0000 | 0.9999 | 0.9999 | 0.9999 | Nil | Nil | Nil |
| Heat | 1.0000 | 1.0000 | 1.0000 | 0.9999 | 0.9999 | 0.9999 | Nil | Nil | Nil |
| Acid | 1.0000 | 1.0000 | 1.0000 | 0.9999 | 0.9999 | 0.9999 | 0.71 | 1.94 | 0.05 |
| Base | 1.0000 | 1.0000 | 1.0000 | 0.9999 | 0.9999 | 0.9999 | 0.51 | 0.50 | 1.67 |
| Oxidation | 1.0000 | 1.0000 | 1.0000 | 0.9999 | 0.9999 | 0.9999 | 25.86 | 38.0 | 27.0 |
Table 1: Results of Forced degradation study of GPZ, GBD and GMD.
Linearity
The linearity of the response of drugs were verified at five concentration level ranging from 100µg/ml to 300µg/ml GPZ, GBD and GMD tablets. The calibration curve was constructed by plotting mean area response A against concentration C of each drug. The regression equations obtained for the three drugs were A= 59216C + 46753 (r2=0.9991, n=5) for Glipizide, A=52384C+71723 (r2=0.9998, n=5) for Glibenclamide and A= 57474C -55218 (r2=0.9991, n=5) for Glimeperide respectively. The result shows that an excellent correlation existed between peak area and concentration of each drug within the concentration range tested.
Limit of quantitation
The limit of quantitation (LOQ) was defined as the lowest concentration that can be determined with acceptable accuracy and precision, which can be established at a signal to noise ratio of 10. LOQ of each drug was experimentally verified by six injections of each drug at its LOQ concentration. The LOQ of Glipizide, Glibenclamide and Glimeperide were found to be 0.1, 0.12 and 0.12µg/ml respectively. The limt of detection (LOD) was defined as the lowest concentration that can be detected and established at a signal to noise ratio of 3. The LOD of Glipizide, Glibenclamide and Glimeperide were found to be 0.06, 0.08 and 0.08µg/ml respectively.
Precision
Method repeatability (intra-day precision) was evaluated by assaying six samples, prepared as described in the sample preparation. The mean % assay and percentage R.S.D. for assay values of Glipizide were found to be 99.3% and 0.26%, for Glibenclamide were 99.6% and 0.26% and for Glimiperide were found to be 99.6% and 0.26% and which is well within the acceptance criteria i.e. assay value should be between 97.0 and 103.0% and R.S.D. should be not more than 2.0%. The intermediate precision (inter-day precision) was performed by assaying six samples prepared by different analyst, different HPLC system and different HPLC column in different days as described in the sample preparation. The mean% assay and percentage R.S.D. for assay values for Glipizide were 99.5% and 0.60%, for Glibenclamide were found to be 99.3% and 0.38 % and for Glimeperide were found to be 99.6% and 0.59% respectively which is well within the acceptance criteria.
Accuracy
Accuracy was determined by applying the developed method to synthetic mixtures of excipients to which known amounts of each drug corresponding to 80, 100 and 120% of label claim had been added. The accuracy was then calculated as the percentage of analyte recovered from the formulation matrix. Mean recoveries (Mean±S.D) for GPZ, GBD and GMD were 98.58±1.17%, 99.51±2.13% and 99.38±2.64% respectively. The obtained result suggested that the accuracy of the developed method for the determination of the GPZ, GBD and GMD in combination with Metformin hydrochloride.
Robustness
The robustness of the method was determined by analyzing same sample at standard operating conditions and also by changing analytical conditions such as mobile phase composition, temperature, pH and flow rate. In all the deliberate varied chromatographic condition carried out i.e. organic phase composition, column temperature, pH and flow rate in mobile phase the system suitability parameter and % assay for the GPZ, GBD and GMD from the six replicate injections of test solution was found to be within the acceptable limits. The robustness of the method was established as the percentage deviation from the mean assay value obtained from precision study is less than ±2%. Table 2 represents the robustness of the method.
| Set Name | Initial precision (RSD%) |
Tailing factor (≤ 1.5). |
% purity | ||||||
| GPZ | GBD | GMD | GPZ | GBD | GMD | GPZ | GBD | GMD | |
| Standard condition | 0.57 | 0.38 | 0.59 | 1.15 | 1.07 | 1.13 | 99.5 | 99.3 | 99.6 |
| Flow rate 0.9ml/in | 0.39 | 0.47 | 0.62 | 1.21 | 1.08 | 1.14 | 98.8 | 99.2 | 99.1 |
| Flow rate 1.1ml/min | 0.76 | 1.42 | 0.83 | 1.22 | 1.06 | 1.16 | 98.2 | 99.5 | 99.0 |
| Mobile phase organic composition + 10% Acetonitrile | 0.46 | 0.72 | 0.82 | 1.09 | 1.03 | 1.06 | 99.2 | 99.6 | 100 |
| Mobile phase organic composition - 10% Acetonitrile | 0.61 | 1.15 | 0.61 | 1.18 | 1.01 | 1.17 | 99.5 | 99.8 | 99.0 |
| Column temperature +5oC | 0.22 | 0.32 | 0.53 | 1.06 | 1.01 | 1.03 | 99.4 | 99.5 | 98.8 |
| Column temperature -5oC | 0.22 | 0.52 | 0.15 | 1.08 | 1.01 | 1.03 | 99.0 | 99.3 | 99.6 |
| pH 5.8 | 0.24 | 0.56 | 0.82 | 1.12 | 1.04 | 1.08 | 99.4 | 99.7 | 99.5 |
| pH 6.2 | 0.87 | 0.98 | 1.44 | 1.10 | 1.02 | 1.05 | 100.3 | 98.6 | 99.9 |
Table 2: Results of robustness study of GPZ, GBD and GMD.
Assay of formulation
The validated LC method was applied to the determination of Glipizide, Glibenclamide and Glimeperide tablets as single component and combination with Metformin hydrochloride. Two batches each were assayed and results are shown in Table 3 indicating that the amount of each drug in the tablet samples met with requirements (90-110% of the tablet claim).
|
Marketed tablet |
Drug |
% Amount found±SD |
% RSD |
|
Glynase MF |
Glipizide 5mg with Metformin HCl 500mg |
98.7±0.26% |
0.27 |
|
98.5±0.38% |
0.39 |
||
|
Glucored Forte |
Glibenclamide 5mg with Metformin HCl 500mg |
98.8±0.56% |
0.57 |
|
98.4±0.42% |
0.43 |
||
|
Glycomet GP-2 |
Glimeperide 2mg with Metformin HCl 500mg |
98.9±0.38% |
0.39 |
|
98.7±0.45% |
0.46 |
||
|
Glide |
Glipizide 5mg |
99.4±0.56% |
0.56 |
|
99.5±0.58% |
0.58 |
||
|
Daonil |
Glibenclamide 5mg |
99.4±0.40% |
0.40 |
|
99.2±0.30% |
0.31 |
||
|
Glyrex |
Glimeperide 4mg |
99.7±0.60% |
0.60 |
|
99.5±0.50% |
0.50 |
Table 3: Results of GPZ, GBD and GMD in marketed product.
Solution stability and mobile phase stability
The R.S.D. of assay of GPZ, GBD and GMD during solution stability and mobile phase stability experiments was within 1%. The solution stability and mobile phase stability experiments data confirms that sample solutions and mobile phase used during assay determination was stable up to 48 h.
Conclusion
An isocratic ion pair reversed phase liquid chromatographic method has been developed and validated for the determination of GPZ, GBD and GMD as bulk drug and in pharmaceutical dosage form as single component and in combination with Metformin hydrochloride. This chromatographic assay fulfilled all the requirements to be identified as reliable and feasible method, including accuracy, recovery and precision data. It is highly accurate, precise and selective. The analytical procedure and its chromatographic run time is less than 12min. Therefore the HPLC method can be used as routine sample analysis and for stability study of all the three components GPZ, GBD and GMD in combination with Metformin hydrochloride.
Acknowledgement
The authors wish to thank the Chairman Maulana Azad Education Trust, Principal Maqdoom Faruqui, Maulana Azad research center for encouragement. We are greatful to M/S USV Ltd, Sun pharmaceuticals Ltd and Biocon Pharmaceuticals Ltd. for providing gift samples.
References
- Riddle M (2000) Combining sulfonylurea and other oral agents. Am J Med 180: 15-22.
- Aburuz S, Millership J, McElnay J (2005) The development and validation of liquid chromatography method for the simultaneous determination of metformin and glipizide, gliclazide, glibenclamide or glimeperide in plasma. J Chromatogr B Analyt Technol Biomed Life Sci 817: 277-286.
- Lakshmi K S, Rajesh T, Sharma S (2009) Determination of pioglitazone and glimeperide in pharmaceutical formulations and Rat plasma by RP-LC. Int J PharmTech 1: 496-499.
- Abdel-Hamid ME, Suleiman MS, el-Sayed YM, Najib NM, Hasan MM (2009) A rapid high performance liquid chromatography assay of glibenclamide in serum. J clin pharm ther 14: 181-188.
- Rajendran SD, Philip BK, Gopinath R, Suresh B (2007) RPHPLC method for the estimation of glibenclamide in human serum. Indian J Pharm Sci 69: 796- 799.
- Venkatesh P, Harisudhan T, Choudhury H, Mullangi R, Nuggehalli S (2006) Simultaneous estimation of six anti diabetic drugs-glibenclamide, gliclazide, glipizide, pioglitazone, repaglinide and rosiglitazone. Development of Novel HPLC method for use in the analysis of pharmaceutical formulation and its application to human plasma assay. Biomed Chromatogr 20: 1043-1048.
- Jing Yao, Ya-Qin Shi, Zhuo-Rong Li, Shao-Hong Jin (2005) Development of a RP-HPLC method for screening potentially counterfeit anti- diabetic drugs. J Chromatogr B Analyt Technol Biomed Life Sci B 853: 254-259.
- Vasudevan M, Ravi J, Ravisankar S, Suresh Vasudevan B (2001) Ion– pair liquid chromatography technique for the estimation of metformin in its multicomponent dosage forms. J Pharm Biomed Anal 25: 77-84.
- Khan M A, Sinha S, Vartak S, Bharatiya A, kumar S(2005) LC determination of glimeperide and its related impurities. J Pharm Biomed Anal 39: 928-943.
- Wanjari DB, Gaikwad NJ (2005) Reversed phase HPLC method for determination of glimepiride in tablet dosage form. J Pharm Sci 67: 253-255.
- Lad NR, Bhoir S, Bhoir I C, Sundaresan M (2003) Concurrent assay of metformin and glimeperide in tablets using RP-HPLC with wavelength programming. J Pharm Sci 65: 650-653.
- Sami EL, Deeb U, Schepers U, Watzig H (2006) Fast HPLC method for the determination of glimeperide, glibenclamide and related substances using monolithic column and flow program. J Sep Sci 29: 1571-1577.
- Sane RT, Menon SN, Inamdar S, Mote M, Gundi G (2004) Simultaneous determination of pioglitazone and glimeperide by high performance liquid chromatography. Chromatographia 59: 7-8.
- Yaru S, Niu L,Wang D, Hu Y, Hou D (2003) Direct separation and quantitative determination of glimepride isomers by high performance liquid chromatography. Journal of Separation Science 26: 1595-1597.
- Chaturvedi PK, Sharma R (2008) Development and validation of an RP-HPLC method for simultaneous analysis of a three component tablet formulation containing metformin hydrochloride, pioglitazone and glibenclamide. Acta Chromatographica 20: 451-461.
- Khan IU, Aslam F (2009) Determination of glimeperide in pharmaceutical formulations using HPLC and fi rst derivative spectrophotometric method. J of Analytical chemistry 64: 171-175.
- Ho EN, Yiu KC, Wan TS, Stewart BD, Watkins KL (2004) Detection of anti diabetics in equin plasma and urine by liquid chromatography –Tandem mass spectrometry. J Chromatogr B Analyt Technol Biomed Life Sci 811: 65-73.
- Hohyun K, Young K (2004) Determination of glimeperide in human plasma by liquid chromatography-electrospray ionization tandem mass spectrometry. Bull Korean Chemical Society 25: 109-115.
Relevant Topics
Recommended Journals
Article Tools
Article Usage
- Total views: 17868
- [From(publication date):
November-2010 - Nov 20, 2025] - Breakdown by view type
- HTML page views : 12998
- PDF downloads : 4870

