Research Article Open Access
Evaluation of Water Quality Index For Drinking Purposes In The Case ofDamodar River, Jharkhand and West Bengal Region, India
| Diptangshu Mukherjee, Lata Dora S and Tiwary RK* | |
| CSIR-Central Institute of Mining & Fuel Research, Council of Scientific & Industrial Research, Barwa Road, Dhanbad-826015, Jharkhand, India | |
| Corresponding Author : | Tiwary R.K CSIR-Central Institute of Mining & Fuel Research Council of Scientific & Industrial Research Barwa road, Dhanbad-826015, Jharkhand, India Tel: 09431122957 E-mail: tiwaryrk.cimfr@yahoo.com |
| Received June 04, 2012; Accepted July 12, 2012; Published July 16, 2012 | |
| Citation: Mukherjee D, Lata Dora S, Tiwary RK (2012) Evaluation of Water Quality Index For Drinking Purposes In The Case of Damodar River, Jharkhand and West Bengal Region, India. J Bioremed Biodeg 3:161. doi:10.4172/2155-6199.1000161 | |
| Copyright: © 2012 Mukherjee D, et al. This is an open-a ccess article distributed under the terms of the Creative Commons Attribution License, which permits unrestricted use, distribution, and reproduction in any medium, provided the original author and source are credited. | |
Related article at Pubmed Pubmed  Scholar Google Scholar Google |
|
Visit for more related articles at Journal of Bioremediation & Biodegradation
Abstract
Damodar River is one of the most important fresh water source in Jharkhand and West Bengal. Its water is used for drinking by the growing population and also used in allied Industries situated down the stretch. The water quality is being reducing day by day due to heavy input of sewage and wastes from industrial effluents, cattle stock breeding, irrigation and human activities etc. Therefore, an attempt has been made to assess the quality of water in relation to know the pollution load in terms of biological and various physicochemical properties by evaluation of Quality Index (QI). This technique is very useful tool for quick assessment of any water system. The evaluation of five QI parameters has been taken: pH, TDS (total dissolved solid), BOD5 (biochemical oxygen demand), DO (Dissolved Oxygen) and MPN (Most Probable Number).
The study shows that the river water is not potable at maximum sampling stations and are highly fecal contaminated. According to the desirable limit, maximum locations are also not even suitable for taking bath. An attempt has also been made to show how QI is increasing (corresponding to low grade water) with the increasing population. BOD5, MPN are interrelated, shown in correlation matrix. Therefore routinely monitoring of the river water becomes essential.
| Keywords |
| Drinking water; Potable; Population; MPN; QI; Matrix |
| Abbreviations |
| BOD5: Biochemical Oxygen Demand, Estimated after 5 days of incubation; °c: Degree Celsius; DO: Dissolve Oxygen; D/s: Downstream; MPN: Most Probable Number; qi: Quality retting; QI: Quality Index; SIi: Sub index; TSS: Total Suspended Solid; TDS: Total Dissolve Solid; U/s: Upstream; Wi: Unit Weight |
| Introduction |
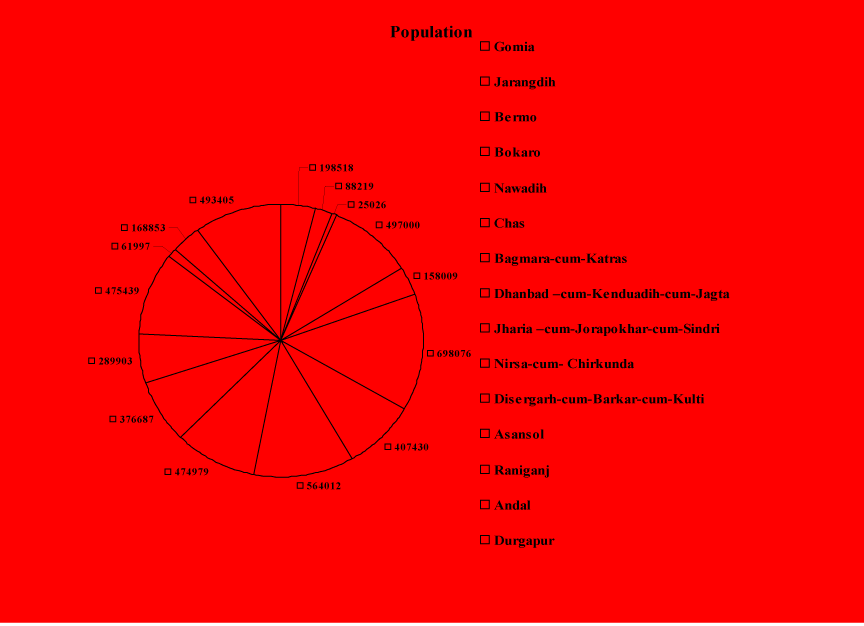
| Damodar river basin is a repository of various mineral resources and therefore comprises of industrial activities. Large population to the Damodar river basin has arrisen due to coal mining and coal based industrial activities which aggravated the pollution load on the river, the lifeline of the region. Development of industries in this area have exerted a great impact on the environment of the basin. Population of towns situated at the river bank is shown in Figure 1 as a pie chart. |
| Previously different physicochemical studies have been undertaken to assess the water quality of Damodar River [1], but detailed study on biological characteristics with reference to MPN has been very negligible. Thus biological characteristics of Damodar river water has taken as MPN analysis to get an idea about drinking water quality standard. This study focuses on QI by different physicochemical and biological parameters. |
| Presence of coliform bacteria in river water shows bacterial contamination, which is mainly due to the addition of untreated sewage. Consumption of this water can cause many water borne diseases [2]. Coliforms, including Escherichia coli are members of the family Enterobacteriaceae and they make upto 10% (approx) of the intestinal organisms of human and others animals. When such indicator microorganisms are not found in a specific volume such as 100 ml of water, the water is considered to be fit to drink or potable. They are facultatively anaerobic, gram negative, rod shaped, non spore forming bacteria and they ferment lactose and produce gas within 48 hrs at 35oC [3]. The presence of coliform bacteria in water is the evidence of fecal pollution of human or animal origin. The presence of indicator bacteria means that sewage or animal manure is present that may cause problem for the river water bodies and ecosystem, such as lowering the Dissolved Oxygen (DO) levels due to decomposition of fecal matter [4]. Dissolved oxygen (DO) is the measurement of oxygen which is dissolved in water bodies. It is consumed by bacteria when high amount of organic matter is present to the water bodies. Biochemical Oxygen Demand (BOD) is very important parameter for the measure of organic pollutants in waterbodies. A low BOD indicates good water quality and higher value indicates polluted water. |
| Several reports on Damodar River water quality assessment by using physicochemical and biological parameters have been published elsewhere, but QI discussed in this article is the most important tool to represent and getting an idea about the quality of water for drinking purpose for concerned citizens and is evaluated by taking quality rating scale. The 300 point index can be divided into several ranges corresponding to the general descriptive terms shown in (table 1). Higher value of QI corresponds to polluted water and lower index indicates better water quality. The assessment shows that there is no excellent water quality in the study area. According to WHO, about 80% of disease in human beings are mainly caused by water [5]. Therefore, regular monitoring of the quality of river water is essential before use. |
| Study Area |
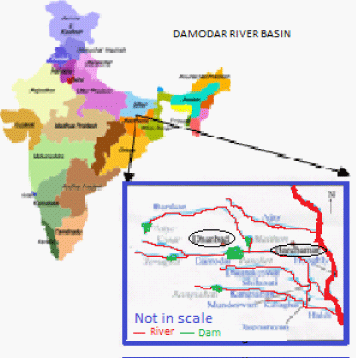
| It is a sub basin and a part of Ganges river system. The basin lies between latitude 220 45’ N and 290 30’ N and 840 45’ E to 880 30’ E longitude. The Damodar is principal river of the Damodar river basin. Damodar river basin on behalf of it. Drainage pattern of the Damodar river basin is shown in the Figure 2. The main tributaries of the Damodar are Garga, Konar, Bokaro, Jamunia, Katri, Barakar and small streamlets like Noonia and Tamla join the river. The stretch between Tenughat Dam to Durgapur barrage have been chosen for study, and is divided into two stretchs, Stretch I and stretch II. Eighteen sampling stations in the main stream of the river were selected for the study. The sampling stations with its code (D1- D18) in stretch I and II are shown in Figures 3 and 4. |
| Methodology |
| Samples were collected by standard sampling methods (APHA, 98) [6] during premonsoon (Feb-Mar, 09). The Most Probable Number (MPN) is an important technique for estimation of microbial population in water. Human fecal matter reachs to the river water by sewage discharges and the water is getting contamination. Therefore, MPN analysis is necessary as the microbiological point of view. The standard microbiological technique for MPN analysis involves three successive tests: Presumptive (Multiple tube fermentation method) Confirmed and Complete test. In this study presumptive test has been performed by three test tube experiments. Different physicochemical characteristic of water such as pH, Dissolved oxygen (DO), Biochemical Oxygen Demand (BOD5) were also analyzed. |
| Samples for estimating dissolved oxygen and biochemical oxygen demand were collected separately in BOD bottle followed by APHA (American Public and Health Association) technique. QI is calculated by considering five physicochemical and biological parameters using ICMR and ISI standards. Parameters, unit and methods used for analysis are given in Table 2. |
| Results and Discussion |
| Physicochemical and biological parameters of water quality of Damodar river have been carried out and overall observation is presented in (Table 3). The water was found colorless at maximum sampling stations but slightly blackish water was found in D11 station due to the discharges of coal washery effluent. High fly ash containing sediment was also found in the river edge at D4 location. |
| Physicochemical & biological characteristics of damodar river |
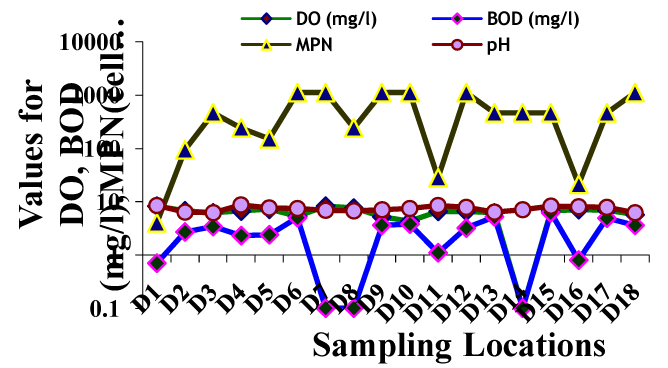
| River is a dynamic systen. pH is the very vital parameter for river ecosystem or any waterbodies. pH greater than 8.5 causes bitter taste of water or soda like taste. Eye irritation and exacerbation of skin disorder is also caused when pH is greater than 11 [7]. Highest pH was found in D4 location. A pH 6.4 and 6.2 was measured at D2 and D3 locations. Highest temperature was found in D/s DTPS, due to the discharging of hot boiler water from Durgapur Thermal Power Station. But in respect to other stations, Tenughat Dam water is cold, about 23°C. Highest DO value of Damodar River was observed at D1 sampling point because the water flows through the rocky surfaces and therefore high aeration was taking place. Others criteria like aquatic plants, decomposition are also responsible for increase in dissolved oxygen concentration. On the other hand D10 and D6 were observed to contain lower dissolved oxygen level in comparison to other stations. Water flow rate is low at D10 (Downstream Mohalbani ghat) and at D6 (Damodar river downstream to Garga nalla) and is highly microbial contaminated which consumes the dissolved oxygen. Maximum sampling station of Damodar river showed DO value to be greater than 6 mg/l. |
| The BOD5 value varies from 0.7-6.2 mg/l of Damodar river. Garga nalla is one of the most polluted tributary of Damodar river, which contains maximum sewage water coming from residential complexes. Downstream to Garga nalla (D6) has high BOD5 value (5 mg/l). Lowest BOD5 was found at D1 (Tenughat). |
| Highest number of coliform is found at the sampling site D6 which is the D/s of T2 (Garga nalla) and lowest coliforn was observed at D1 (Tenughat). Maximum sampling stations were highly contaminated with coliform bacteria except few stations like D1, D2, D5, D11, D8, D4 and D16. These stations have lower MPN index in respect to other locations. According to bathing class standard [8] maximum stations are also not suitable for taking bath, except the stations like D1, D2, D4, D5, D8, D11 and D16. |
| TSS and TDS is an indicator of overall water quality. TSS means suspended solid and TDS means inorganic salt and organic matter in water or water bodies. It has been observed that highest TSS and TDS were found in Durgapore barrage (D18). A graphical representation of MPN with respect to pH, DO and BOD is shown in Figure 5. |
| QI |
| Quality index is an important tool for getting an idea about the quality of water for drinking purpose. One of the most effective ways to communicate information regarding water quality trends to policy makers and the general public or citizens is with indices [9]. Five physicochemical and biological parameters viz. pH, TDS, BOD, DO and MPN have been taken for calculating quality index. The quality index does not shows exact degree of pollution, rather it is used to assess water quality trends for the management purpose. [10]. Recommended water quality criteria [5,10-12] for drinking purpose is given in (Table 2). |
| For calculating Quality Index (QI) [5] at first each of the five parameters were assigned a weight (wi) according to the relative importance in the overall water quality for drinking purpose (Table 4). Next, unit weight (Wi) was calculated by the following equation (i). |
 (i) (i) |
| Then, quality rating (qi) for each parameters was determined by dividing its concentration in each sample by respective Indian standard followed by BIS (Bureau of Indian Standard) and the result was multiplied by 100, mentioned in equation (ii). |
| qi = (Ci / Si) X 100 (ii) |
| Where, |
| Ci = Concentration of each parameter in each water sample (Table 3) and |
| Si = Indian drinking water standard for each parameter (Table 2). |
| For QI analysis, sub index SIi was first determined for each parameter by multiplying its unit weight (Wi) with quality retting (qi), equation (iii). |
| SIi = Wi . qi (iii) |
| Then quality index is calculated by the following no (iv) equation. |
| QI = Σ SIi (iv) |
| QI for Tenughat Dam is given in (Table 4) according to above mentioned procedure. |
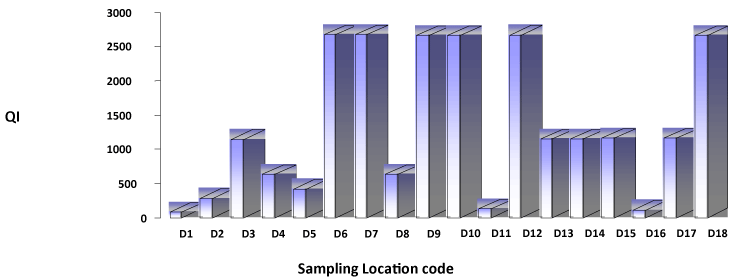
| Quality Index (QI) for remaining seventeen sampling stations was also calculated by same equation. The Water quality classification according to quality index is shown in (table 1) and Figure 6 reflects the graphical variation. |
| Quality Index (QI) revealed that there was no “A” grade water quality but only good water quality found at Tenughat Dam. Poor water was found in location D11 (Domgarh Ghat). Damodar River U/s Konar river sampling station has very poor water that is “D” grade. Remaining 84% of the study area water was highly polluted, adequate treatment is necessary before human Consumption. |
| Another most important parameter for river quality analysis is population. Larger population requires huge water to complete their regular lifecycle; as a consequence huge amount of waste water is generated. This untreated waste water contains highly fecal coliform and is directly goes to the river water bodies and gets polluted day by day. Though previously discussed in introduction that decreasing water quality of Damodar river is also dependable upon industrial effluents [1,13,14], an attempt has been made to show the population factor. |
| Comparison (Figures 1 and 6) shows that the population and QI are directly proportional that means larger population produce huge sewage which is discharged into the river and increasing the river pollution load. In Jharkhand D6, D7, D9, and D10 & in West Bengal Durgapur Barrage (D18) has higher QI value (polluted water). The reason is large population on the river bank. |
| Matrix |
| Water quality parameters have also been studied using simple correlation matrix and results are shown in tabular form in (Table 5). BOD5 and MPN are the highly interrelated among themselves. This interrelationship indicated that the increased values of fecal contamination in river increased the BOD5 level. |
| Conclusion |
| The results from the data analysis shows that the river water is not potable (fit to drink). Maximum sampling stations are contaminated with high fecal coliform bacteria. Water treatment is very necessary for the use of river water for drinking purpose. According to the desirable limit, maximum locations are also not suitable for taking bath. People may be affected by various skin or intestinal disease by taking bath in the river or by consuming without any treatment. Minimum BOD5, MPN value was observed in Tenughat dam. Water is slightly acidic and basic in various sampling station. |
| The sites where low MPN and BOD5 values are found are D2, D5, D11 and D16. Highest coliform and BOD5 was found in D6 station which is very critical zone of the river. This spot is neither suitable for drinking nor for bathing or for any other purpose without any treatment. After QI analysis, we found that only Tenughat Dam (D1) has good water quality but no excellent grade water quality was observed in the studied area. Fourteen sampling stations on Damodar river were of E grade which means the water is not suitable for drinking or not drinkable. QI reveals that decreasing the water quality of the river is due to MPN parameter, which interferes too much while calculating the index. |
| Water quality analysis revealed that Damodar river water is getting polluted from various sources like domestic sewage (due to the high population) or industrial effluents and garbage disposal in the river or by other anthropogenic activity. |
References
|
Tables and Figures at a glance
| Table 1 | Table 2 | Table 3 | Table 4 | Table 5 |
Figures at a glance
 |
 |
 |
| Figure 1 | Figure 2 | Figure 3 |
 |
 |
 |
| Figure 4 | Figure 5 | Figure 6 |
Relevant Topics
- Anaerobic Biodegradation
- Biodegradable Balloons
- Biodegradable Confetti
- Biodegradable Diapers
- Biodegradable Plastics
- Biodegradable Sunscreen
- Biodegradation
- Bioremediation Bacteria
- Bioremediation Oil Spills
- Bioremediation Plants
- Bioremediation Products
- Ex Situ Bioremediation
- Heavy Metal Bioremediation
- In Situ Bioremediation
- Mycoremediation
- Non Biodegradable
- Phytoremediation
- Sewage Water Treatment
- Soil Bioremediation
- Types of Upwelling
- Waste Degredation
- Xenobiotics
Recommended Journals
Article Tools
Article Usage
- Total views: 21054
- [From(publication date):
September-2012 - Nov 24, 2025] - Breakdown by view type
- HTML page views : 15835
- PDF downloads : 5219
