Research Article Open Access
Implementation of response surface methodology for phenol degradation using Pseudomonas putida (NCIM 2102)
| V.Sridevi1*, M.V.V.Chandana Lakshmi1, A.V.N. Swamy2 and M. Narasimha Rao3 | |
| 1Centre for Biotechnology, Department of Chemical Engineering, Andhra University, Visakhapatnam-03, Andhra Pradesh, India | |
| 2Department of Biotechnology, J.N.T.U, Pulivendula, Anantapur Dist. Andhra Pradesh, India | |
| 3Al-Ameer College of Engineering and Information Technology, College of Engineering, Gudilova, Anandapuram, Visakhapatnam, Andhra Pradesh, India | |
| Corresponding Author : | Dr. V. Sridevi Associate Professor, Centre for Biotechnology Department of Chemical Engineering, Andhra University Visakhapatnam-03, Andhra Pradesh, India E-mail: vellurusridevi@yahoo.co.in |
| Received March 29, 2011; Accepted June 21, 2011; Published June 22, 2011 | |
| Citation: Sridevi V, Lakshmi MVVC, Swamy AVN, Rao MN (2011) Implementation of response surface methodology for phenol degradation using Pseudomonas putida (NCIM 2102). J Bioremed Biodegrad 2:121. doi:10.4172/2155-6199.1000121 | |
| Copyright: © 2011 Sridevi V. This is an open-access article distributed under the terms of the Creative Commons Attribution License, which permits unrestricted use, distribution, and reproduction in any medium, provided the original author and source are credited. | |
Related article at Pubmed Pubmed  Scholar Google Scholar Google |
|
Visit for more related articles at Journal of Bioremediation & Biodegradation
Abstract
Phenol, a major pollutant in several industrial wastewaters is often used as a model compound for studies on biodegradation. Experiments were performed as a function of glucose (0.4-1.6 g/l), ammonium sulfate (0.5- 2.0 g/l) and concentration of metal ion, Mn2+ (0.01-0.04 g/l) by Pseudomonas putida (NCIM 2102), at constant phenol concentration 0.100 gL-1. Optimization of these three process parameters for phenol degradation was studied. Statistically designed experiments using response surface methodology (RSM) was used to get more information about the significant effects and the interactions between the three parameters. A 23 full - factorial central composite designed technique was employed for experimental design and analysis of the results. The optimum process conditions for maximizing phenol degradation (removal) were recognized as follows; glucose (0.8229 g/l), ammonium sulphate(1.5183 g/l) and metal ion concentration, [Mn2+.]( 0.0195 g/l) A maximum % phenol degradation of 98.24 was obtained at these optimum parameters.
| Keywords |
| Biodegradation; Batch; Pseudomonas putida (NCIM 2102); Central Composite Design; Correlation coefficient |
| Introduction |
| The potential of microorganisms to catabolise and metabolise xenobiotic compounds has been recognized as a potentially effective means of toxic and hazardous waste disposal [1]. Phenol and its derivatives have long been recognized as some of the most persistant chemicals in wastewaters, with high toxicity even at low concentrations. Phenol and a range of similar aromatic compounds are listed as priority contaminants and are serious environmental pollutants [2,3]. It is more commonly produced artificially from industrial activities such as petroleum processing plastic manufacturing, resin production, pesticide production, steel manufacturing and the production of paints and varnish [4,5]. Good solubility of phenol in water and its high contents in industrial effluents testify to a high probability of phenol acting as a water pollutant [3]. The concentration of phenol in wastewater varies from 10 mgL-1 to 300 mgL-1 [6] but this can rise to 4.5 gL-1 in very polluted water [7]. Phenol vapors acting as air pollutant precipitate from the air in the soil like other substances. |
| Owing to their toxic effects, including permeabilisation of the cell membrane and cytoplasmic coagulation, phenol can damage sensitive cells and thus cause profound health and environmental problems, particularly during wastewater treatment process [8]. It is also known as a carcinogenic and teratogenic agent, which affects both the environment and human beings. Phenol concentrations in the range of 100-400 µgmL-1caused the complete inhibition of photosynthesis [9]. Phenol removal from the industrial wastewaters is necessary, prior to the wastewater discharge [10]. |
| Several methods such as physico-chemical [11] and biological methods [12] have been employed in the treatment or removal of phenol and its compounds [13]. The physico-chemical methods are costly and often produce undesirable products which are toxic, requiring further treatment steps [14,15]. Hence, the biological treatment method is preferred as it has the potential to almost degrade completely with innocuous end products and minimum secondary metabolites [16]. |
| Biodegradation of phenol and its derivative compounds has been extensively investigated and several studies have shown that phenol can be aerobically degraded by a wide variety of pure cultures of microorganisms such as Cryptococcus elinovic [17]. Fusarium flocciferum, Alcaligenes eutrophus [18], Bacillus sterothermophilus, Burkholderia cepacia G4, Pseudomonas putida [19], Pseudomonas aeruginosa, [20] Acinetobacter sp. Strain W-17 [21]. |
| In general, optimization studies involving the one-factor at a time approach are not only tedious, but also tend to overlook the effects of interacting factors and might lead to misinterpretations of the results. On the other hand, statistical planned experiments effectively solve such problems; minimize the error in determining the effect of parameters and the results are achieved in an economical manner [22]. |
| Response Surface Methodology, which is supported by software, is an empirical modelization technique derives for the evaluation of the relationship of a set of controlled experimental factors and observed results. It requires a prior knowledge of the processes to achieve statistical model [23]. |
| In this study, phenol biodegradation was investigated in a batch reactor using P. putida (NCIM 2102). Chemical parameters like carbon source (glucose, galactose, D-xylose, fructose and sucrose), inorganic nitrogen source (ammonium sulfate, sodium nitrate, disodium phosphate and sodium phosphate) and metal ions (Manganese, lead, cobalt and Cu (II)) at various concentrations were studied. The effects of these chemical parameters on the phenol degradation were also discussed based on response surface methodology. |
| Design of Experiments |
| Response surface methodology is an empirical modelization technique derived to the evaluation of the relationship of a set of controlled experimental factors and observed results [24]. It requires a prior knowledge of the process to achieve statistical model [25-28]. Basically this optimization of process involves three major steps, which are, performing the statistically designed experiments, estimating the coefficients in a mathematical model and predicting the response and checking the adequacy of the model [29]. |
| Y= f (X1, X2, X3,….Xk) (1) |
| The true relationship between Y and Xk may be complicated and, in most cases, it is unknown, however, a second-degree quadratic polynomial can be used to represent the function in the range of interest; |
 (2) (2) |
| where X1,X2,X3,..,Xk are the input variables which affect the response Y, Ro, Ri, Rii and Rij (i =1-k, j = 1-k) are the known parameters, ε is the random error. A second-order model is designed such that variance of Y is constant for all points equidistant from the centre of the design; |
 (3) (3) |
| where Xi is the coded value, Xo is the actual value at the center point and ΔXi is the step change value. The parameters and their values (in brackets) were three levels, namely glucose (0, 0.4, 0.8, 1.2, 1.6 gL-1), ammonium sulfate (0, 0.5, 1.0, 1.5, 2.0 gL-1) and concentration of metal ion Mn2+ (0, 0.01, 0.02, 0.03, 0.04 gL-1) at constant phenol concentration 0.100gL-1 were studied using Statistica 6.0. This also enabled the identification of significant effects of interactions for the batch studies. In system involving three significant independent variables X1, X2, and X3, the mathematical relationship of the response of these variables can be approximated by quadratic (second degree) polynomial equation; |
| Y = b0 + b1X1 + b2X2 + b3X3 + b11X1 2 + b22X22 + b33X32 +b12X1X2 + b13X1X3+ b23X2X3 (4) |
| where Y is the predicted value, b0 is the constant, X1 is the glucose, X2 is the ammonium sulfate, X3 is Mn+2, b1, b2 and b3 are linear coefficients, b12, b23 and b13 are cross product coefficients and b11, b22 and b33 are quadratic coefficients. The low, middle and high levels of each variable were designated as -1, 0, and +1 respectively, as given in table 1. A total of 20 runs were necessary to estimate the coefficients of the model using multiple linear regressions. The design of experiments was carried out for analysis using the Statistica 6.0 version. |
| Materials and Methods |
| Microorganism |
| The microorganism P.putida (NCIM 2102) was procured from culture collection NCL, Pune. The microorganism was maintained on beef extract: 1.0 gL-1; yeast extract: 2.0 gL-1; peptone: 5.0 gL-1; sodium chloride: 5.0 gL-1 and agar: 20.0gL-1. The medium was adjusted to pH 7.0 by 1N sodium hydroxide. It was stored at 4°C ± 1°C for further use. |
| Optimization studies |
| The chemical parameters namely glucose (0, 0.4, 0.8, 1.2, 1.6 gL-1), ammonium sulfate (0, 0.5, 1.0, 1.5, 2.0 gL-1) and concentration of metal ion Mn2+ (0, 0.01, 0.02, 0.03, 0.04 gL-1) at constant 0.100 gL-1 phenol concentration were studied in the minimal medium composed of dihydrogen potassium phosphate: 1.5 gL-1; potassium dihydrogen phosphate: 0.5 gL-1; ammonium sulfate: 0.5 gL-1; sodium chloride: 0.5 gL-1; sodium sulfate: 3.0 gL-1; yeast extract: 2.0 gL-1; glucose: 0.5 gL-1; ferrous sulfate: 0.002 gL-1 and calcium chloride: 0.002 gL-1 by P.putida (NCIM 2102) for the maximum degradation of phenol. Samples were withdrawn at regular intervals for phenol determination. From the above experiments the range of glucose, ammonium sulfate and concentration of metal ion Mn2+ were chosen for further optimization of the design. |
| Design of experiments |
| To optimize the range of experiments the 23 full-factorial Central Composite Design (CCD) was applied. The range and the levels of the process variables under study are given in table 1: glucose (0, 0.4, 0.8, 1.2, 1.6 gL-1), ammonium sulfate (0, 0.5, 1.0, 1.5, 2.0 gL-1) and concentration of metal ion Mn2+ (0, 0.01, 0.02, 0.03, 0.04 gL-1) which served as critical variables X1, X2 and X3 respectively. |
| Estimation of phenol |
| Phenol was determined quantitatively by the Spectrophotometric method (DR/ 4000 V, Hach) using 4-amino antipyrine as the color reagent (λmax: 500nm) according to standard methods of analysis [30]. |
| Results and Discussion |
| Effect of carbon source |
| Microorganisms acquire nutrients, electrons and energy from their environments to support growth. Biodegradation of organic substrates provide microorganisms with energy and building materials that are used for growth of new cells, cell maintenance and co-metabolism of other less degradable substances [31]. |
| In general, microorganisms grow mostly in a medium supplemented with additional substrates [32]. Hence, growth could be manipulated by addition of two or more nutrients simultaneously [33- 35]. If a microbial population is grown on mixed substrates present in the medium, the microbes consume only one, or both the substrates. Consequently, several utilization patterns can be observed. In mixed substrates, individual substrates can have synergistic, antagonistic or no effect on one another, resulting in a growth rate that is higher, lower or the same than if the substrates are present individually [36,37]. |
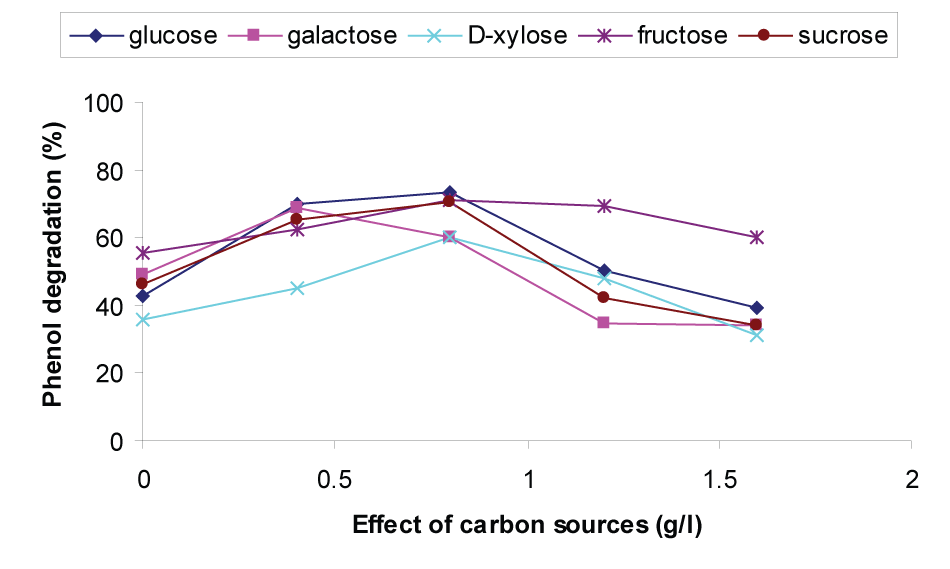
| Hence, different carbon sources were selected for two reasons. First, phenol is a toxic compound representing wastes of industrial origin. Second, these conventional carbon sources are non-toxic, a common substrate which can represent wastes of urban or agricultural origin. In this study, the effect of six different carbon sources namely glucose, galactose, D-xylose, fructose and sucrose in the range of 0-1.6 gL-1 on the degradation of phenol were studied and shown in Figure 1. From Figure 1, it can be observed that glucose is the best carbon source among all and the % of phenol degradation obtained was 73.43. Phenol degradation increased up to a glucose concentration of 0.8gL-1 and thereafter it decreased and the degradation was almost inhibited at a concentration of 1.6gL-1. This may be due to catabolite repression by glucose as reported by Papanastasiou [38] i.e the presence of glucose could inhibit utilization of the target substrate. Satsangee and Ghosh [39] have also reported that glucose interferes with phenol uptake. This result coincides with Kar et al. [40] who reported that phenol degradation was completely inhibited when glucose concentration was at 2gL-1. Hence 0.8gL-1 glucose concentration was considered to be the optimum carbon source. |
| Effect of inorganic nitrogen source |
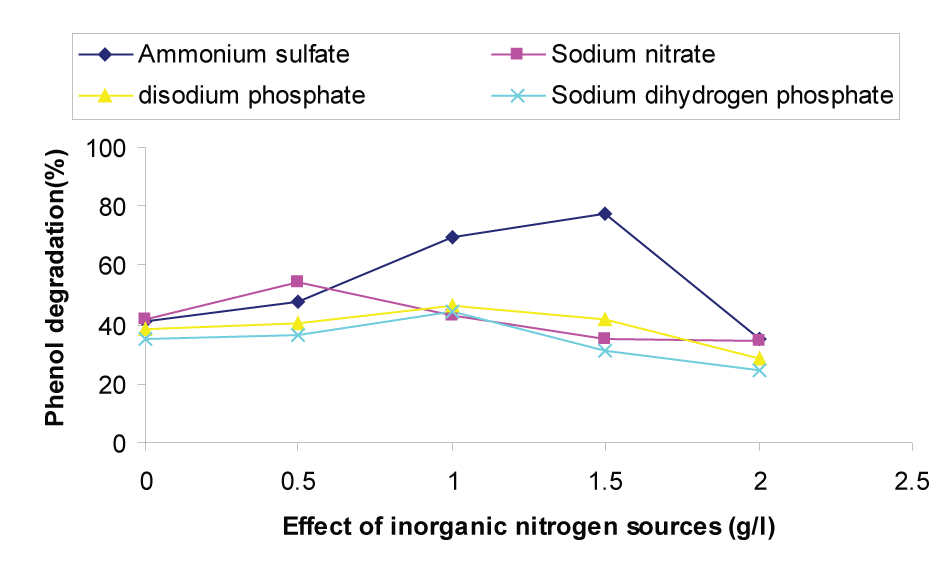
| Nitrogen is the next most important nutrient for the phenol degradation. The effect of four inorganic nitrogen sources namely ammonium sulfate, sodium nitrate, disodium phosphate and sodium phosphate in the range of 0-2.0 gL-1 on the degradation of phenol were studied and shown in Figure 2. From Figure 2 it was observed that up to a concentration of 1.5 gL-1 of ammonium sulfate, the phenol degradation was increased and further increase in the concentration, a detrimental effect was observed on phenol degradation. Hence, the optimum concentration of ammonium sulfate observed was 1.5 gL-1 and the phenol degradation was 77.34%. The enhanced rate of phenol degradation at less than 1.5 gL-1 ammonium sulfate can be attributed to the attenuation of phenol toxicity by ammonium sulfate and the increase in cell mass formed as a result of the additional nitrogen source. |
| This is in good agreement with Premalatha and Suseela Rajakumar [41] who reported that ammonium chloride at a concentration of 0.175 gL-1 was the best nitrogen source for pentachlorophenol degradation, giving 100% degradation by day 5. Pentachlorophenol degradation by a mixed bacterial population was also enhanced by ammonium salts [42]. |
| Effect of metal ions |
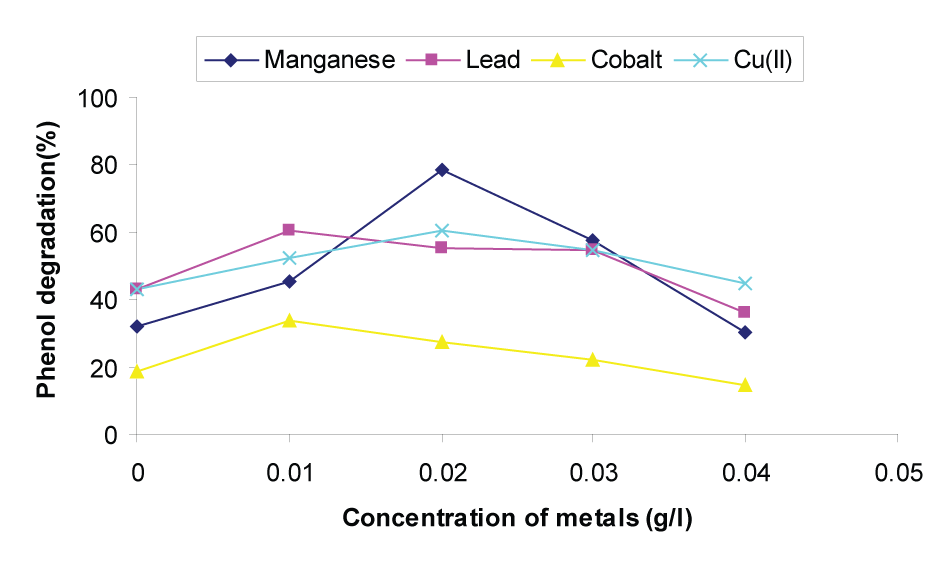
| The tolerance of different strains to metals varies widely and it is necessary to determine the optimum concentration to avoid the inhibitory effects caused when these cations are present in toxic concentrations. The present study investigates the effect of four different metal sources viz Manganese, lead, cobalt and Cu (II) in the range of 0-0.04 gL-1 on phenol degradation by P.putida (NCIM 2102). From Figure 3, it was observed that Mn+2 degraded maximum phenol when compared to lead, cobalt and Cu (II). |
| It may be observed that from Figure 3 that phenol degradation increased up to a concentration of 0.02 gL-1 and further increase in Mn+2 concentration had a detrimental effect on phenol degradation. Hence, the optimum concentration of Mn+2 for phenol degradation by P.putida (NCIM 2102) was found to be 0.02gL-1 and the percentage of phenol degradation at this optimum value was 78.28. This result is in agreement with Kotresha and Vidyasagar [43] who reported that maximum degradation of phenol by P.aeruginosa MTCC 4996 was possible in the presence of 2.0 mM zinc. This may be due to the fact that microbes display a large range of tolerance and resistance to heavy metals [44]. Hughes and Poole [45] and Sterritt and Lester [46] also reported that addition of certain metal ions at low concentration enhances the degradation rate. |
| Evaluation of experimental results with CCD |
| The design of experiments was carried out for analysis using Statistica 6.0 software. The percentage phenol degradation obtained after 16 h incubation with 20 experimental runs and with different combinations of glucose concentration, (NH4)2SO4 concentration and metal ion concentration (Mn2+) were estimated. |
| By applying multiple regression analysis on the experimental data, the following second order polynomial equation was found to represent the percentage phenol degradation adequately. |
| Y = 44.5 +60X1 -35.5X2 +29.2X3-7.5X12 +617.2X22 -20382.1X32 -5.8X1X2 - 373.7X2X3 + 3.7375X1X3 (5) |
| The predicted values of percentage phenol degradation using the above equation are given in Table 2 along with experimental values. The coefficients of the regression model (Eq. 5) calculated are listed in Table 3, in which they contain three linear, three quadratic and three interaction terms and one block term. The significance of each coefficient was determined by Student's t-test and p-values, which are listed in Table 3. The larger the magnitude of the t-value and smaller the p-value, the more significant is the corresponding coefficient. This implies that the first order and second order main effects of glucose concentration, (NH4)2SO4 concentration and metal ion concentration (Mn2+) are highly significant as is evident from their respective p-values. They are more significant at the second order. This indicates that they can act as limiting nutrients and small variations in their concentration will alter either growth rate or product formation rate or both to a considerable extent. The interaction effect of metal ion concentration (Mn2+) and glucose concentration was found to be significant (p=0.05). The remaining two interaction terms i.e. glucose concentration × (NH4)2SO4 and (NH4)2SO4 × metal ion concentration (Mn2+) were found to be insignificant (Table 3). |
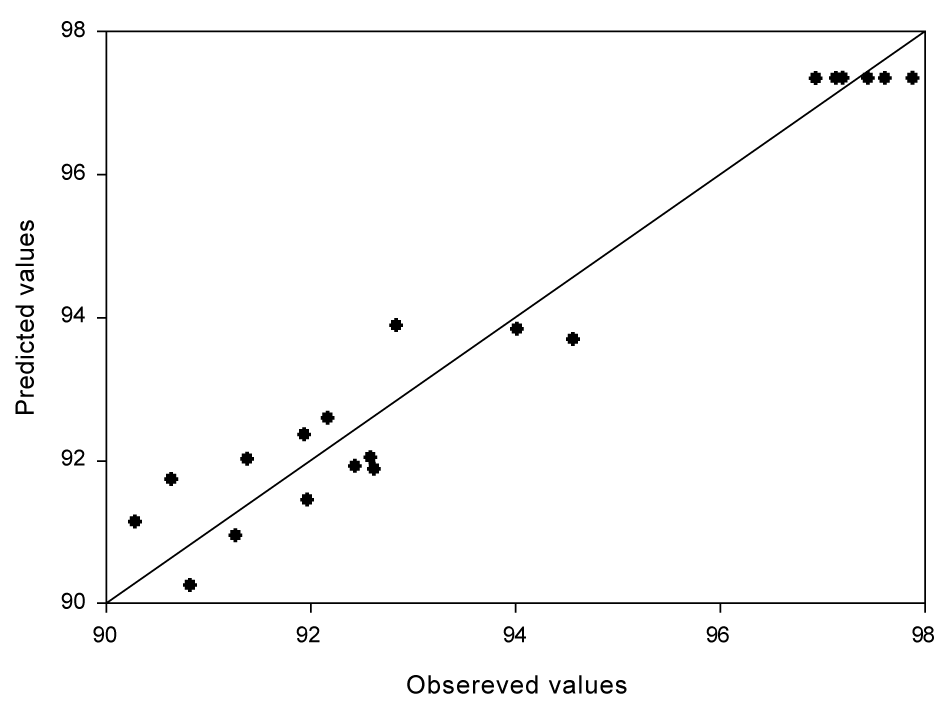
| The parity plot (Figure 4) showed a satisfactory correlation between the experimental and predicted values (obtained from Eq. 5) of percentage phenol degradation, wherein, the points cluster around the diagonal line which indicated the optimal fit of the model, since the deviation between the experimental and predicted values was minimal. |
| The results of the second order response surface model fitting in the form of Analysis of Variance (ANOVA) were given in Table 4. It is required to test the significance and adequacy of the model. The Fisher variance ratio, the F-value (= S2 r /S2e), is a statistically valid measure of how well the factors describe the variation in the data about its mean. The greater the F-value is from unity, the more certain it is that the factors explain adequately the variation in the data about its mean, and the estimated factor effects are real. The ANOVA of the regression model demonstrates that the model is highly significant, as is evident from the Fisher's F-test (Fmodel= 20.62065) and a very low probability value (Pmodel> F=0.000026). |
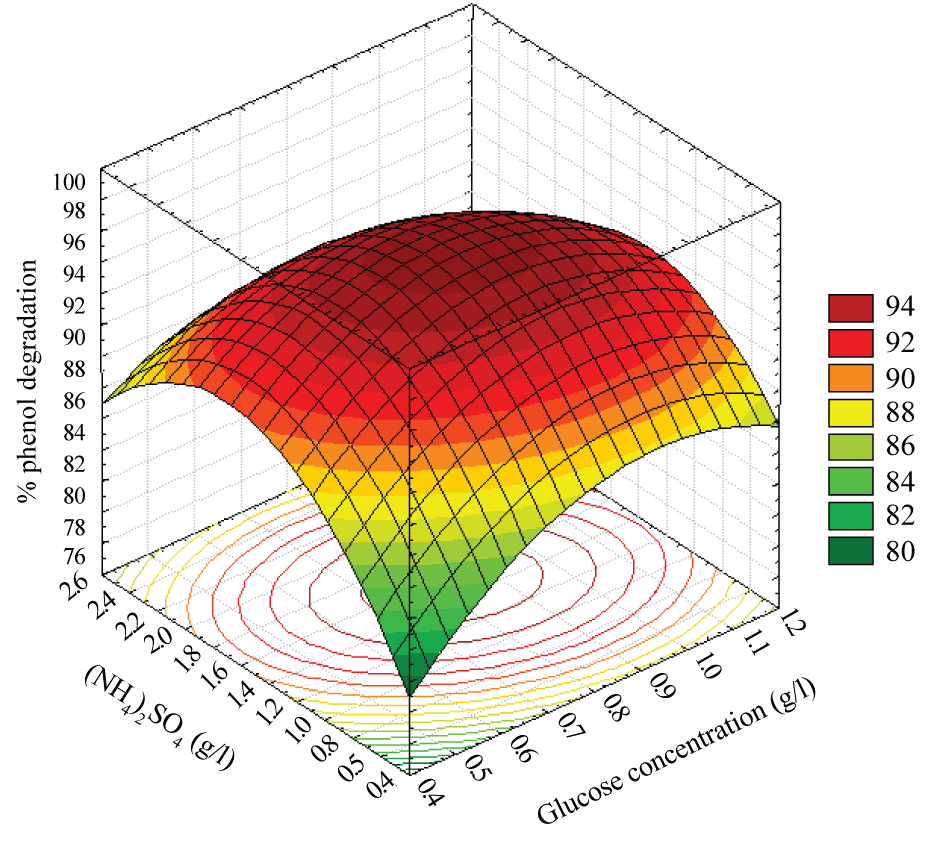
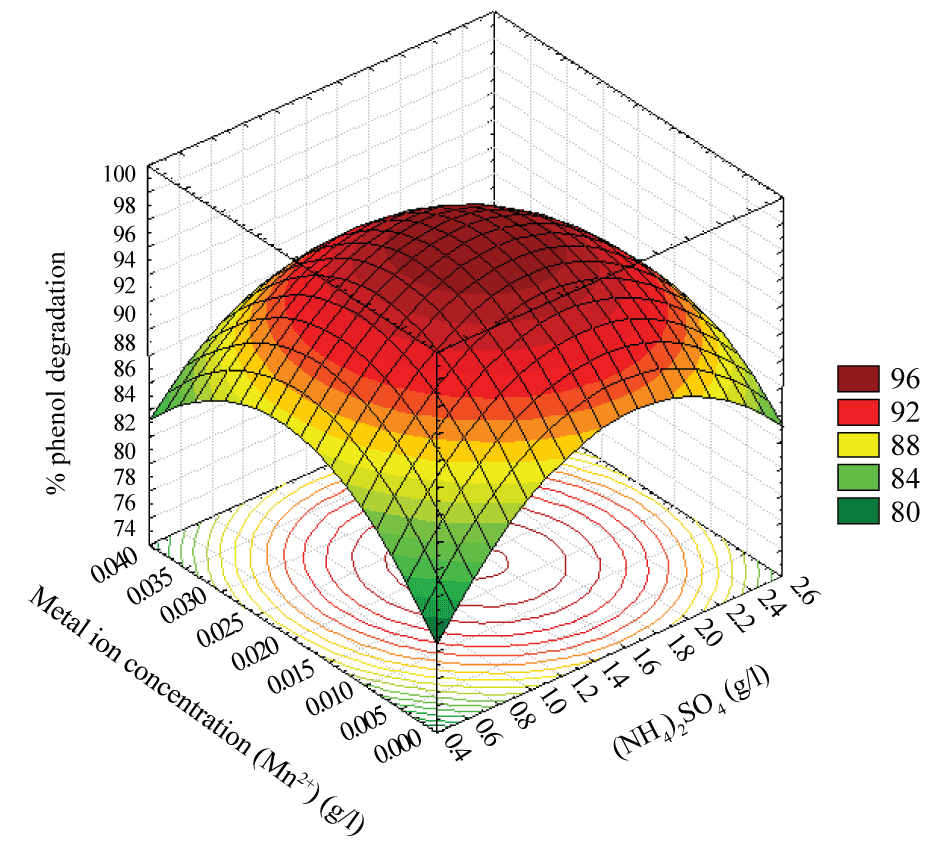
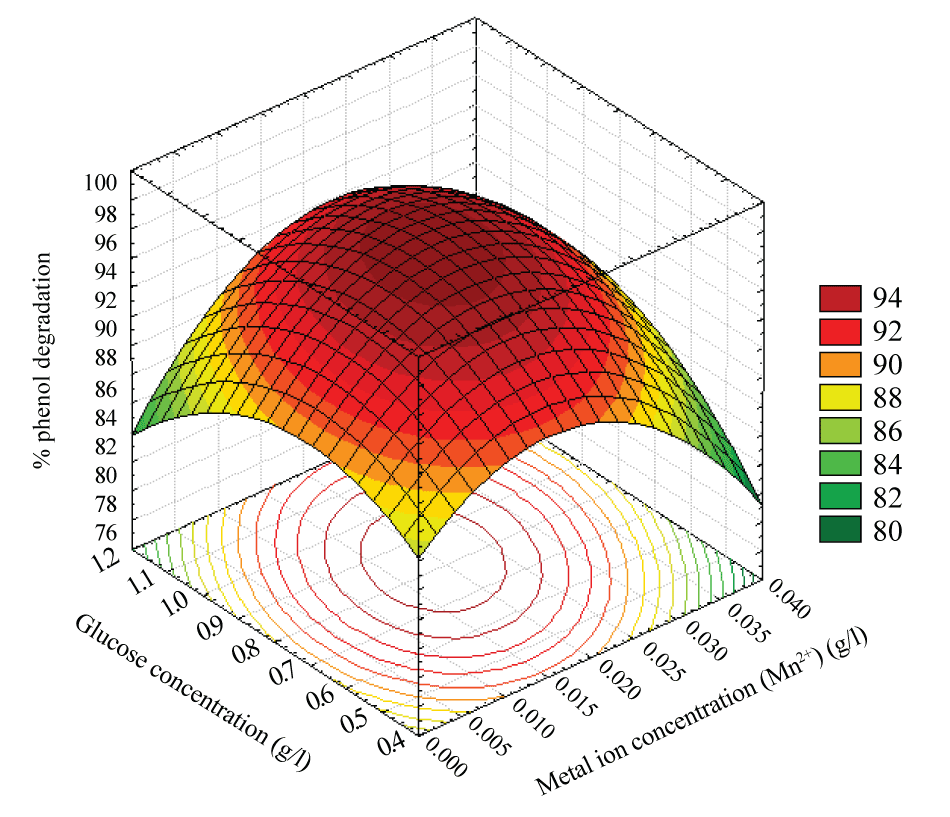
| The goodness of the fit of the model was checked by the determination coefficient (R2). The R2 value provides a measure of how much variability in the observed response values can be explained by the experimental variables and their interactions. The R2 value is always between 0 and 1. The closer the R2 value is to 1, the stronger the model is and the better it predicts the response. In this case, the value of the determination coefficient (R2 = 0. 9488) indicates that 94.88 % of the variability in the response could be explained by the model. In addition, the value of the adjusted determination coefficient (Adj R2 = 0.9028) is also very high to advocate for a high significance of the model. The predicted and experimental percentage phenol degradation at the optimum levels of chemical conditions was also determined by using (Equation 5). Figures 5-7 represent the isoresponse contour and surface plots for the optimization of chemical conditions of phenol degradation. |
| The effects of the glucose concentration and (NH4)2SO4 concentration on the percentage phenol degradation showed in Figure 5. An increase in the (NH4)2SO4 concentration with glucose concentration up to the optimum point increased the percentage phenol degradation to a maximum level and a further increase in the (NH4)2SO4 concentration with glucose concentration the trend is reversed. |
| The interaction effect of the metal ion concentration (Mn2+) and (NH4)2SO4 concentration on the percentage phenol degradation in Figure 6 clearly indicates a proper combination for degradation of phenol. An increase in the (NH4)2SO4 concentration with metal ion concentration (Mn2+) increased the phenol degradation gradually but at a higher (NH4)2SO4 concentration and metal ion concentration (Mn2+) the trend is reversed. The optimum for maximum phenol degradation lies near the centre point of the (NH4)2SO4 concentration and metal ion concentration (Mn2+). |
| A similar effect on the response was observed for the glucose concentration at any level of the metal ion concentration (Mn2+) an increase in the glucose concentration with metal ion concentration (Mn2+) up to the optimum point increased the percentage phenol degradation to maximum level and a further increase in the glucose concentration with metal ion concentration (Mn2+) decreased the phenol degradation is shown in Figure 7. |
| Therefore, an optimum was observed near the central value of glucose concentration, (NH4)2SO4 concentration and metal ion concentration (Mn2+). The optimum conditions for maximum phenol degradation were obtained at a glucose concentration of 0.8229gL-1, (NH4)2SO4 concentration of 1.5183gL-1 and metal ion concentration (Mn2+) of 0.0195gL-1. A maximum % phenol degradation of 98.24 was obtained at these optimum parameters. The experimental and predicted phenol degradation at optimum conditions of degradation were also determined (Table 5). |
| Conclusion |
| The present study shows the potential of the P. putida (NCIM 2102) for phenol waste water treatment. The performance of this strain in biodegradation of phenol in the medium is excellent. The central composite design selected as a response surface method proved to be suitable for performing bioremediation studies in complex system where the toxicity of the pollutant to the microorganism do not permit a straightforward study [47]. The response surface methodology using 23 full-factorial composite design was adopted to optimize the process variables like carbon source, inorganic nitrogen and metal ion concentration for the microbial degradation of phenol by P.putida (NCIM 2102). The optimum conditions for maximum phenol degradation were obtained at a glucose concentration of 0.8229 gL-1, (NH4)2SO4 concentration of 1.5183 gL-1 and metal ion concentration (Mn2+) of 0.0195 gL-1. A maximum % phenol degradation of 98.24 was obtained at these optimum parameters. The designed generated may be used for designing a treatment plant for phenol waste effluents where collection can be achieved on a large scale. |
References
|
Tables and Figures at a glance
| Table 1 | Table 2 | Table 3 | Table 4 | Table 5 |
Figures at a glance
 |
 |
 |
 |
| Figure 1 | Figure 2 | Figure 3 | Figure 4 |
 |
 |
 |
| Figure 5 | Figure 6 | Figure 7 |
Relevant Topics
- Anaerobic Biodegradation
- Biodegradable Balloons
- Biodegradable Confetti
- Biodegradable Diapers
- Biodegradable Plastics
- Biodegradable Sunscreen
- Biodegradation
- Bioremediation Bacteria
- Bioremediation Oil Spills
- Bioremediation Plants
- Bioremediation Products
- Ex Situ Bioremediation
- Heavy Metal Bioremediation
- In Situ Bioremediation
- Mycoremediation
- Non Biodegradable
- Phytoremediation
- Sewage Water Treatment
- Soil Bioremediation
- Types of Upwelling
- Waste Degredation
- Xenobiotics
Recommended Journals
Article Tools
Article Usage
- Total views: 16847
- [From(publication date):
June-2011 - Dec 19, 2025] - Breakdown by view type
- HTML page views : 11901
- PDF downloads : 4946
