Intrinsic and Specific Vulnerability of Groundwater in a River Valley - Assessment, Verification and Analysis of Uncertainty
Received: 28-Aug-2013 / Accepted Date: 12-Sep-2013 / Published Date: 18-Sep-2013 DOI: 10.4172/2157-7617.1000159
Abstract
Aquifer vulnerability maps are valuable tools for communicating concerns about the level of groundwater pollution hazard to local land use planners and to the general public. Groundwater vulnerability to contamination in the Kampinoski National Park (KNP) area in central Poland was evaluated as a basis for developing appropriate protection strategy for the groundwater resources and management in recreation areas located near Warsaw. Kampinoski National Park (KNP) and its lagging are located in central Poland in the valley of the Vistula River. Assessment of groundwater vulnerability was accomplished using U.S. EPA DRASTIC. Region of the Vistula valley is characterized by medium (324 km2) and moderately high (229 km2) intrinsic vulnerability to contamination. The DRASTIC method was used to assess specific vulnerability to contamination, taking into account additional parameters defining a potential risk of threat of groundwater connected with land development. The area of studies is characterised by a moderately high (340 km2) and medium (247 km2) specific vulnerability to contamination. The DRASTIC method has been applied to assess the specific vulnerability of groundwater to nitrate, basing on the possible impact of land development. Land development is analysed in the aspect of possible, potential contamination of groundwater with nitrate, but also a possibility of protecting waters before any potential contamination. The area of studies is characterised by low (426 km2) and medium (136 km2) specific vulnerability to contamination with nitrate. Use of GIS techniques and geo-statistical methods during the development of the vulnerability made possible a more precise assignment of the parameter values and, subsequently, allowed for a more accurate distinction of vulnerability types.
Keywords: Groundwater vulnerability; Specific vulnerability; Intrinsic vulnerability; DRASTIC; River valley; Poland
11077Admission
Aquifer vulnerability maps are valuable tools for communicating concerns about the level of groundwater pollution hazard to local land use planners and to the general public. Assessments of vulnerability of groundwater to contamination enable a reliable and objective opinion, necessary for formalising applications concerning e.g. localisation decisions or ways of spatial planning, development plans, protection plans, etc. Legislative procedures concerning the protection of groundwater in Poland require drawing up reports of impact on the environment in the case of realising investments that may threaten the environment. Assessments of vulnerability of groundwater to contamination in regional scale and reports in local scale, along with the land use plans, are the most important instruments in environmental protection. Groundwater vulnerability to contamination in the Kampinoski National Park (KNP) area in central Poland was evaluated as a basis for developing appropriate protection strategy for the groundwater resources and management in recreation areas located near Warsaw.
Definition of Vulnerability and Primary Terms
According to the conclusions of the international conference on “Vulnerability of Soil and Groundwater to Pollutants”, held in 1987 in The Netherlands, groundwater vulnerability to contamination is defined, as the sensitivity of groundwater quality to an imposed contaminant load, which is determined by the intrinsic characteristics of the aquifer. Intrinsic vulnerability of groundwater to contamination in studies conducted in the region of Kampinos National Park (KNP) is understood as natural property of the hydro geological system, determining the risk of migration of impure substances from the surface of the territory to groundwater [1-7]. In the adopted term of vulnerability, it is assumed that filtration, flow and soaking pollution takes place as a result of the advective model of transport from the surface of the terrain. Sorption, self-purification and other processes concerning the behaviour of polluting substances in soils, zones of aeration, the aquifer, etc. are not being taken into account [8].
Aside from intrinsic vulnerability, specific vulnerability also takes into account the type of polluting sub-stance, its load, time of impact, as well as the spatial character of the focus of contamination connected with it [2,5,6,9] that is why it is different for variable contamination.
The term of vulnerability in Poland was introduced in recent years not only in scientific studies and the-ses, but also in many legal acts, documentation, cyclical maps and other documents. In the binding in Poland Ordinance of the Minister of Environment of 23 December 2002 on criteria of marking waters vulnerable to contamination of nitrogen compounds from agricultural sources [10] in compliance with the entries of the Water Law of 18 July 2001 [11] and legal entries of the European Union, among others, the Nitrogen Directive 91/676/ ECE and with the Water Directive 2000/60/EC, the following waters are regarded as liable to contamination: groundwater, in which the content of nitrogen amounts from 40 to 50 mg NO3/L and shows an increasing trend. While groundwater are regarded as polluted waters if the content of nitrogen amounts to more than 50 mg NO3/L.
Localisation of Study Area
Studies of vulnerability of groundwater to contamination in the regional scale have been conducted for the area of Kampinos National Park (KNP) and its lagging, located in central Poland in the valley of the Vistula River. KNP established in 1950, takes up an area of 385 km2; it is surrounded by a protective zone established in 1977, called a lagging, of an area of 378 km2. The park and its lagging is bordered from the north and north-east by the shore of the Vistula River, from the east, the border runs through suburbs of Warsaw, from the south it runs through agricultural areas of the Lowicz Blonie Plain (Blonski level); while from the west, the left shore of Bzura River constitutes the border (Figure 1).
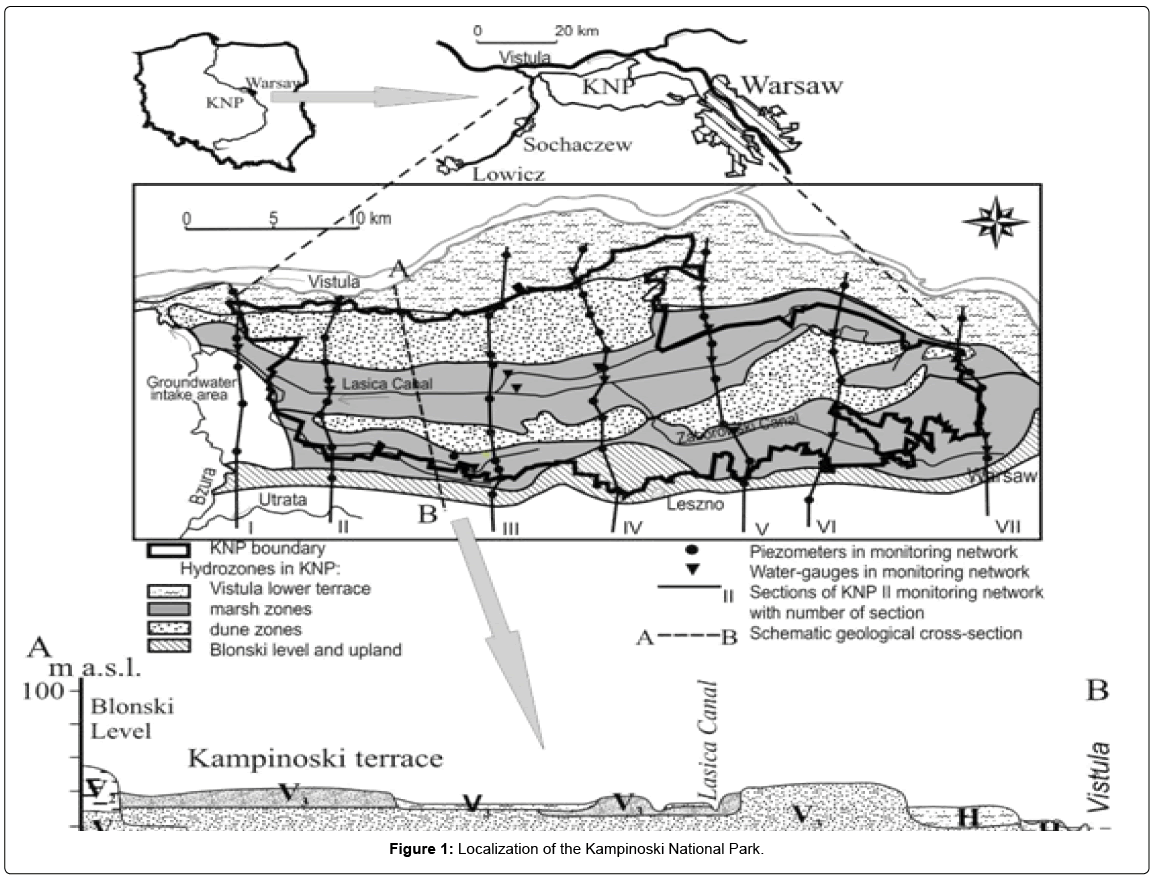
Figure 1: Localization of the Kampinoski National Park.
Kampinos National Park is also an area of the network NATURA 2000 and Biosphere Reservoir (UNESCO MaB). In accordance with the requirements of the UNESCO programme, the reservoir has three zones: central, buffer and transit. The central zone, called the core, encompasses areas of strict protection of Kampinos National Park, with adjacent territories to them, which are valuable in terms of nature. The buffer zone lies completely on the territory of Kampinos National Park; it serves the realisation of various forms of active protection. The transit zone encompasses the entire lagging of Kampinos National Park, together with fragments of the Warsaw Zone of the Protected Landscape. This zone is where man’s land use is admitted based on rules of balanced development. However, man’s activity cannot in any case degrade the nature of this zone; furthermore, it cannot have a negative impact on the internal and buffer zone. Land use is very diverse both in Park, but above all in its lagging. Aside from the mentioned forest areas, small villages are located here, agricultural zones, while the eastern part is an area constituting the suburbs of Warsaw, the largest city in Poland.
Hydrogeological Conditions
Kampinos National Park together with the lagging is located in a Hydrogeological valley unit. Quaternary sediments occur on the entire area of the park and lagging, constituting a collector of underground water. The surface of tertiary loams, constituting a bed of a quaternary aquifer, in the region of KNP occurs in the range of ordinates from 2 to 54 m a.s.l. A clear dichotomy of the aquifer of a total thickness up to 50 m is connected with its litho logical shape. The top part of the aquifer has a sandy and sandy-gravel character; the bottom is created by sandy-silt sediments, in places changing to sandy clay and dusty clay. Locally, these complexes are divided by layers of sandy and dusty clays of small thickness. The higher part of the aquifer (depth 8-17.5 m) is characterized by a value of the coefficient of permeability within the range from 30 to 71 m/d. For the bottom part of the layer (depth 18–36 m), the coefficient of permeability is clearly lower and amounts to under 30 m/d. In sand dune areas on the surface there is fine-grainted sand, sand and gravel underlayed with medium-course. In marshy areas under the hiatal sand grains there are fine and hiatal sands. On the fluvial terrace, the top layer is created by tilly sandy, finegrained sands lay below, while hiatal sands constitute the lowest layer (Krogulec, in-print).
The following division criteria: differences in geologic structure and geomorphology, lithology of sub-surface sediments and related vegetation cover, depth of ground water table, amplitude of water level fluctuations and human economic activities were used to distinguish zones of similar hydrodynamical and environmental conditions, the so called hydrozones [7]. The following hydrozones have been distinguished in KNP area:
• The Vistula River flood plain terrace
• 2 marsh zones (northern and southern),
• 2 dune zones (northern and southern),
• Accumulative-erosive Warsaw-Blonie terrace called Blonski level (with part of the upland).
Assessing of Intrinsic Vulnerability of Groundwater
DRASTIC method
The DRASTIC method is a standard tool in assessing the vulnerability of groundwater to contamination, applied in many countries [5,12]. It enables a general classification of intrinsic vulnerability of the studied area, drawn-up maps using this method present layout and value of the DRASTIC index; they can be the primary tool in the widely understood management of the environment.
Specific parameters considered in the DRASTIC method are analyzed as spatial information, which can be obtained directly or indirectly from many sources. The exactness and reliability of vulnerability assessment depends above all on the level of Hydrogeological recognition and reliability of available data and information, therefore, available databases.
In order to perform calculations of the DRASTIC index in KNP region (617, 89 km2), digitizing of the area into calculation blocks of an area of 100 m × 100 m was applied. The values of particular parameters of the DRASTIC method were averaged for each block. KNP region and its lagging encompass 61790 calculation blocks. In each block, calculations on the vulnerability of groundwater to contamination using the DRASTIC method were conducted; therefore, for each block a value of the DRASTIC index was obtained. In all of the calculations the possibilities of GIS tools were applied [13].
Calculations of the DRASTIC index for each hydrozones, hydrogeological units or blocks were conducted according to the following formula [12]:
DRASTIC index = (parameter weight * parameter rank) (1)
DRASTIC index = DR Dw + RRRw + ARAw + SRSw + TRTw + IRIw +
CRCw (2)
where:
- depth to groundwater, R - recharge, A - aquifer type, S - soil type, T - topography, I - impact of the vadose zone, C - hydraulic conductivity, R- rank coefficient for each factor, W – weigh coefficient for each factor.
Each variable is assigned with a different degree of importance on a scale of 1 to 5, the most significant factors have weights of 5; the least significant a weight of 1. Each criterion also possesses a suitable order of value of the used coefficient and is credited with a rank, in other words a rank on a 1 to 10 scale, depending on the local conditions (Table 1).
| No. | Parameter | Parameter value classes | Weight | Rank |
|---|---|---|---|---|
| 1 | D – depth to groundwater | >5 | 5 | 7 |
| [m] | 3,1-5 | 8 | ||
| 1,1-3 | 9 | |||
| <1 | 10 | |||
| 2 | R – recharge | 50-75 | 4 | 2 |
| [mm/year] | 101-130 | 3 | ||
| 151-180 | 4 | |||
| 181-200 | 5 | |||
| >250 | 6 | |||
| 3 | A – aquifer type | hiatal sands, fine-grained sands with till and clay inlays | 3 | 2 |
| hiatal sands, fine-grained sands with silt and clay | 3 | |||
| hiatal sands with inlays of clay | 4 | |||
| river and glacifluvial sands | 6 | |||
| gravel and sands | 8 | |||
| 4 | S – soil type | dusty soil, mineral-muck soil, alluvial soil | 2 | 5 |
| brown soil, black soil | 6 | |||
| podsolic soils, eolian-eroded, etc. | 7 | |||
| silt-gley, alluvial-peat soils | 8 | |||
| muck soils | ||||
| ground-gley, gley-podsolic, podsolic soils | 9 | |||
| 5 | T – topography (slope) | 2.9-3.9 | 1 | 7,5 |
| [%] | 2.5-2.9 | 8 | ||
| 2.0-2.5 | 8,5 | |||
| 1.6-2.0 | 9 | |||
| 1.0-1.6 | 9,5 | |||
| 1.0-0.0 | 10 | |||
| 6 | I – impact of the vadose | varvic loams, clays | 5 | 2 |
| zone, | aggregate mud, alluvions, | 3 | ||
| icedommed clays | 4 | |||
| river and glacifluvial sands | 6 | |||
| gravel, eolian sands | 8 | |||
| 7 | C – hydraulic conductivity | <4 | 3 | 1 |
| [m/d] | 4-12 | 2 | ||
| 13-28 | 4 | |||
| 29-40 | 6 | |||
| 41-80 | 8 |
Table 1: Values of parameters of the DRASTIC method in KNP region.
Parameter 1: One of the most exactly defined parameters of the DRASTIC method is the depth to water. The long-term system of monitoring observations of groundwater in KNP enables a quantity assessment of the current state of groundwater, the characteristics of season values, together with the assessment of change trends. This parameter is often only estimated, constituting one of the arguments negating the DRASTIC method for vulnerability assessment.
The monitoring system of waters in the KNP region is based on manual, conducted every 2 weeks since 1999, observations of states of waters are conducted in 56 piezometers (Figure 1). These measurements encompass a database from 11 years (1999-2009), that is over 16 thousand measurements. Such a scope of measurements and the location of study points enable to indicate and characterise regular trends, season trends, anomalous values and a spatial characteristic of changes of states of groundwater [14]. The location of the depth to groundwater in the KNP region is characterised by a significant dynamics of changes. The characteristic feature of the entire waterbearing system is the shallow location of depth to groundwater, mean depth to groundwater amounts to 1.03 m in the northern marsh zone to 2.67 m in the north dune zone (Table 2). Locally and in season, the depth to groundwater is located deeper, which results mainly from the exploitation of waters for needs of people. An example can be the highest intake of groundwater, an intake in the KNP region located in the region Wolka Smolana, where the mean depth to groundwater amounts to 3.16 m.
| Hydrozones in KNP region | ||||||||
|---|---|---|---|---|---|---|---|---|
| Depth togroundwater, value in period 1999-2008 [m] | flood plain terrace | northern marshzone | southern marsh zone | northerndune zone | southern dune zone | Blonski level | suburb of Warsaw | area of Wol-ka Smolanaintake |
| mean depth | 1,91 | 1,03 | 1,15 | 2,67 | 2,60 | 2,15 | 2,32 | 3,16 |
| mediana | 1,93 | 1,03 | 1,11 | 2,70 | 2,62 | 2,20 | 2,33 | 3,21 |
| minimum | 1,23 | 0,30 | 0,49 | 2,04 | 1,97 | 0,97 | 1,53 | 2,35 |
| maximum | 2,43 | 1,64 | 1,94 | 3,17 | 3,13 | 2,99 | 2,96 | 3,62 |
| standard | 0,24 | 0,29 | 0,34 | 0,24 | 0,26 | 0,45 | 0,31 | 0,27 |
| deviation | ||||||||
| amplitude | 1,19 | 1,33 | 1,45 | 1,12 | 1,15 | 2,02 | 1,44 | 1,27 |
Table 2: Basic statistic measures of groundwater depth in KNP.
Parameter 2: The value of net recharge constitutes a very important element of vulnerability assessment, especially difficult to specify due to its variability in time and space. In assessments of groundwater vulnerability to contamination using the DRASTIC the infiltration recharge is only estimating, often determined only in quantity. In the KNP region, the infiltration recharge amount is determined in using a few methods, and the accepted value in vulnerability assessment has been preceded by a wide analysis. The value of this parameter can be acknowledged as specific in quantity for specific hydrozones of KNP and for the entire area of studies. However, the results obtained confirm that in the case of the area of studies of low variability of hydrogeological conditions, even standard methods applied, but based on long-term observations; allow assessing the value of parameter 2 in quantity.
Water-Table Fluctuation (WTF) method: The water table fluctuation (WTF) method is a conventional method for quantifying groundwater infiltration recharge by multiplying the specific yield by the water level rise [15]. Based on the Van Genuchten model, an analytical relationship between groundwater recharge and the water level rise is derived. The equation is used to analyze the effects of the water level depth and the soil properties on the recharge estimate using the WTF method.
Infiltration recharge was calculated with the use of the following formula [15]:
where:
R – infiltration recharge, Sy - specific yield, h – water table hydraulic head, t – time
Applying the above equation requires the assumption that water reaching the saturation zone is immediately stored and other factors of the balance equation in the recharge period are equal to zero. This method gives the most exact results for short period of observation in areas where the depth to groundwater is shallow, which guarantees quite big changes in its location in time [16]. Due to its primary assumption and the possibility of assessing changes of depth to groundwater on the basis of regular monitoring studies, this method has been applied to assess the recharge in the valley of the Vistula in the KNP region. The location of piezometers within the limits of all of KNP enables to calculate values of recharge for particular hydrozones (Table 3). The recharge has been calculated for various periods of time on the basis of monitoring data from the period 1999-2009. For example, the value of recharge in the period of the lowest rainfall, therefore, the winter period (November-April), it amounted to a mean of 90.5 mm/year. During the highest precipitation in July (mean monthly precipitation 72.1 mm), infiltration reached 207 mm, i.e., 35% of the mean sum of precipitation and 40% higher than the mean annual recharge (Krogulec, in print). Season values may be the basis of scenario maps or variants of maps of intrinsic vulnerability of groundwater to contamination.
| Hydrozone | Infiltration recharge [mm/year] | Area [km2] |
|---|---|---|
| flood plain terrace – central part | 73 | 120.48 |
| marsh zones – south part | 100 | 47.88 |
| marsh zones – south part | 94 | |
| marsh zones – north part | 89 | 107.04 |
| marsh zones – north part | 73 | |
| dune zones - south part | 131 | 87.12 |
| dune zones - south part | 265 | |
| dune zones - north part | 193 | 90.12 |
| dune zones - north part | 207 | |
| Blonski level (central part) | 207 | 90 |
| Blonski level (central part) | 137 | |
| KNP area | 143 | 542.64 |
Table 3: Value of infiltration recharge [mm/year] - WTF method.
Base Flow Index (BFI) method: The basis of calculations were sequences of day flows in half a century (1951-2000) recorded in the hydrologeological profile in Wladyslawowo in Lasica (A=441.0 km2). Lasica is the main river within KNP, the area almost entirely fits within the borders of the part and its lagging. The calculated values of river base runoff in the KNP region may be accepted as the net recharge value, because the sources of groundwater in the studied river basin are connected with recharge and the groundwater are drained practically mainly by Lasica River.
The hydrograph separation was computed using the automated series processing method so called Base Flow Index (BFI) performs hydrograph separation [17,18]. Series of daily runoff during the period 1951–2000 have been used. The average discharge of the Lasica River in 1951–2000 is 1.13 m3/s (minimum 0.016 m3/s, maximum 8.36 m3/s); runoff from the mouth of the catchment is 121 mm, but it can change by a factor of four from 242 mm (1967) to 52 mm (1991). The highest value occurs during the spring thaw (19–20 mm), the lowest in summer and autumn from June to October (4–6 mm) [19]. In the interval 1999- 2009 the mean river base runoff reached 84 mm/year.
The results obtained are based on long-terms observations of Lasica’s flow, characterising a typical seasonality of river base runoff. The method applied enables regional assessment of the recharge value, but rules out the possibility of determining the value of recharge of particular hydrozones within KNP.
Numeric models: Model studies enable the quantity assessment of recharge most precisely. The hydrodynamic model of the hydrogeological system of Kampinos National Park was imitated with the help of the orthogonal digitising net of the step x = y = 100 m. The amount of the accepted step corresponds to the resolution of the numeric model of the terrain area. An identical method of digitalisation of space was applied in assessments of vulnerability of groundwater to contamination. The relation of the model with the surrounding was determined using the II and III type border conditions. Condition of the III type (type RIVER) in MODFLOW programme [20,21] was set for surface water constituting hydrodynamic borders of the model. The border condition of the III-type was also used for imitating the main channels and melioration trenches. Determining internal border conditions allowed taking into account their draining role in calculations. On the south border along the geomorphological edge dividing the Kampinos terrace and Blonski level, the III type condition was set (GHB). On the remaining borders, the condition of zero flow was set, which resulted from the hydrodynamic state of the stream of groundwater determined on the basis of monitoring measurements. Infiltration recharge of the system was modelled through the combination of the II and III type conditions. The II type condition was set as fixed for the entire area of the recharge size. The III type condition was used to calculate evapotranspiration. Evapotranspiration package was applied for this, which enables to calculate the amount of losses in the depth function of the depth to groundwater occurring. The condition has lower limits, so-called extinction depth, below which the amount of evapotranspiration is equal to zero. Combining II and III type conditions, together with applying the numeric model of the territory’s area allows determining the net recharge.
Obtained as a result of modelling, net recharge is a table of number, which represents the spacious distribution of recharge given off to the aquifer system in a discrete way. The resolution of the picture of recharge results directly from the scheme of digitalisation of area applied for the numeric model. The picture of conditions of recharge confirms that recharge takes place in dune hydrozones, while the marshy hydrozones, due to the shallow occurrence of depth to groundwater, intensification of losses occurs connected with evapotranspiration (Table 4).
| Hydrozones | Area [km2] | Infiltration recharge[mm/Lear] | Evapotranspiration [mm/year] |
|---|---|---|---|
| flood plain terrace | 73 | 49,9 | 19,3 |
| marsh zones – south part | 131 | 50,0 | 49,0 |
| marsh zones – north part | 89 | 50,0 | 61,1 |
| dune zones - south part | 73 | 50,0 | 11,9 |
| dune zones - north part | 100 | 50,0 | 6,9 |
| area of Wolka Smolana intake | 94 | 50,0 | 13,7 |
| area of the single-family building | |||
| development | 265 | 49,9 | 72,3 |
| suburb of Warsaw | 193 | 47,1 | 5,4 |
Table 4: Value of infiltration recharge – results of modelling.
Parameter 3: Aquifer media has been widely recognised on the basis of direct studies and interpretations of drilling profiles. The database for the studied region contains 978 drillings (studies and wells); a supplementation of the recognition was geophysical investigations. For the needs of the DRASTIC method, 5 classes were generated; the largest area is taken up by river and glacifluvial sands (39%), as well as gravel and eolian sands (31%). The remaining divisions have little participation in building the aquifer.
Parameter 4: The soil cover is very diverse; it has been studied in detail for the needs of maintaining and renaturalising plant habitats in KNP. In DRASTIC method, the soil has been characterised through references to primary types classified US SCS (Soil Conservation Service – American Office of Soil Protection). The choice of the appropriate rank of the soil requires consider the characteristic features of the soils; this can be obtained by indentifying the most important soil types, but also layers occurring in the soil profile and having the greatest influence on the filtering of water and transport of contamination. Ranks of particular types of soils occurring are strictly connected with the spacious lithological diversity of surface deposits.
Parameter 5: The slope of the territory plays a smaller role in assessing vulnerability of groundwater to contamination (weight 1). The studied territory is quite diverse morphologically, despite the location of the river’s valley, for sand dunes (hills) territories and marshy lows occur here. Despite small hipsometric differences, the slope of the territory’s area shows a changeability resulting from micro-sculptures, changes of declines of an anthropogenic character, occurring e.g. in the eastern part of KNP’s lagging in the neighbourhood of the city agglomeration and flow of the Vistula valley. Calculating declines have been carried out on the basis of the digital model of increasing territory to the scale 1:50 000 of the study region, approximately 94% of the territory’s surface is characterised by small slopes, amounting from 0 to 0.2%, only under 1% of the area is one where the slope of territory amounts from 0.4% to 2.8%.
Parameter 6: The lithology of subsoil deposits has been widely recognised on the basis of geophysical studies and the analysis of drilling profiles of mainly shallow piezometers of the monitoring network of KNP. The greatest area takes up river and glacifluvial sands – 237.56 km2, eolian sands, and gravel, aired up sands take up a significant area - 192.38 km2, and aggregate mud and alluvial soil - 155.53 km2.
Parameter 7: On the basis of the analysis of values from sample pumping conducted in variable times in 186 well holes located in the study area or in its direct neighbourhood, but in the area of the studied hydrogeological unit, the average value of the coefficient of permeability (hydraulic conductivity) amounts to 12.59 m/d.
The higher part of the aquifer (up to 17.5 m b.g.l.) is characterised by a value of the coefficient of perme-ability within the range from 30 to 71 m/d. In the lower layer, the coefficient of permeability is clearly lower and accepts a value below 30 m/d.
In 2003, measurements of the value of the coefficient of permeability were conducted using the PARAMEX method. This method enables to mark in situ the values of the coefficient of permeability of the aquifer, as well as the assessment of the technical state of the piezometer [22]. PARAMEX can be included in the “express” methods of marking the coefficient of permeability of aquifers from the slug-bail test group [23]. On the territory of KNP, studies of the coefficient of permeability using the PARAMEX method was conducted on 16 piezometers (depth up to 6 m) from 2 cross-sections: IV and V (Figure 1). The value of the coefficient of permeability changes in the scope from 3.6 m/d to 64.32 m/d.
In order to recognise changes of parameters of permeability in detail in the vertical profile, in July 2010, 2 profiles of drillings were performed using Geoprobe equipment. In the marshy hydrozone, 10 markings were performed in the profile, taking samples from the depths from 0.3 m to 9.6 m b.g.l. The average value of the coefficient of permeability amounts to 8.48 m/d, in the variability scope from 0.59 to 24.46 m/d. In the sand dune zone, 14 markings were performed of the coefficient of permeability from the depth of 0.3 to 15.6 m. The average value amounted to 3.54, in variability from 0.43 to 7.24 m/d.
The coefficient of permeability was averaged in the vertical profile if a few values were present, then a geostatistical analysis was performed using the classical kriging method. For 48% of the study area, a aquifer occurs for which the coefficient of permeability amounts from 13 to 28 m/d, a significantly lower value – under 4 m/d occur only 4% of the study area.
Results of assessment
On the basis of the scope of variability of “initial” data, as well as calculations in accordance with the DRASTIC method, a modified, but adapted to the specifics of the studied territory classification of groundwater vulnerability was accepted. Six classes were formed of intrinsic vulnerability of groundwater to contamination in the KNP region and it’s lagging:
• A - very low (DRASTIC index<100),
• B - low (DRASTIC index from 100 to 125),
• C - medium (DRASTIC index from 126 to 150),
• D - moderately high (DRASTIC index from 151 to 175),
• E - high (DRASTIC index from 176 to 200),
• F - very high (DRASTIC index >200)
Region of the Vistula valley is characterized by medium (37% of the area – 229 km2) and moderately high (52% of the area that is over 324 km2) vulnerability to contamination. In the study region, the area of approxi-mately 12.5 km2 is classified as very low vulnerable. The area of high class vulnerability takes approximately 53 km2, and very high 0.01 km2 (Table 5 and Figure 2).
| DRASTIC index | Vulnerability class | Area of region [km2] | Percent share of class in the area of the KNP region |
|---|---|---|---|
| <100 | A – very low | 0.03 | below 0.01 |
| 100-125 | B – low | 12.53 | 2.03 |
| 126-150 | C – medium | 323.93 | 52.43 |
| 151-175 | D – moderately high | 228.57 | 36.99 |
| 176-200 | E – high | 52.82 | 8.55 |
| >200 | F – very high | 0.01 | below 0.01 |
| TOTAL | 617.89 km2 – study area | 100 % | |
Table 5: Areas of regions in particular classes of vulnerability - results of intrinsic vulnerability assessment using the DRASTIC method.
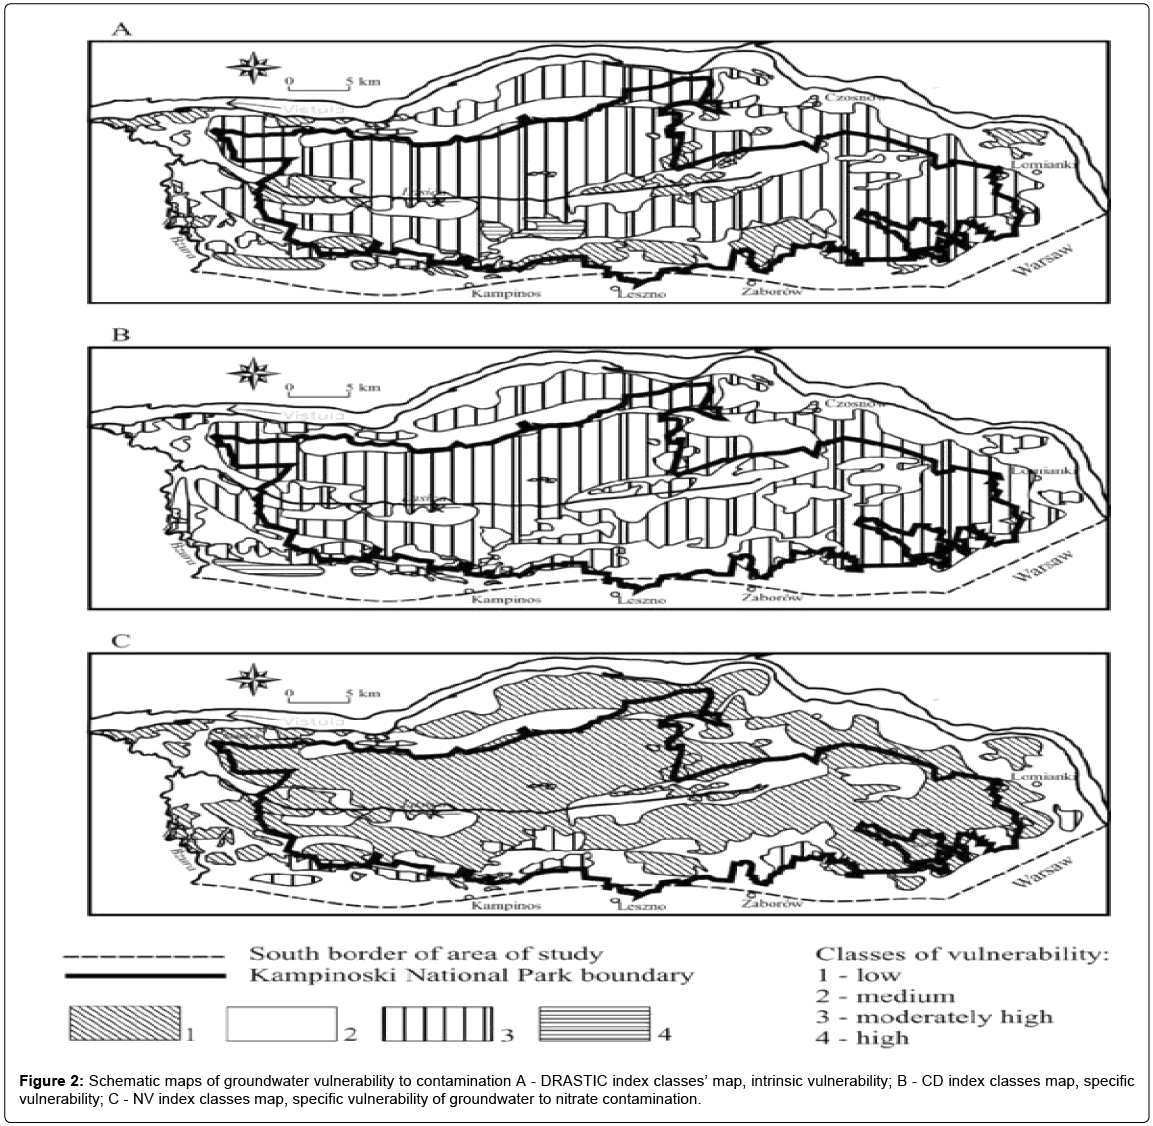
Figure 2: Schematic maps of groundwater vulnerability to contamination A - DRASTIC index classes’ map, intrinsic vulnerability; B - CD index classes map, specific vulnerability; C - NV index classes map, specific vulnerability of groundwater to nitrate contamination.
The DRASTIC method appropriately characterises vulnerability of groundwater to contamination in the river valley in the regional intake. In studies conducted in the KNP region, the biggest defect of the DRASTIC method has been eliminated, that is calculating the index on the basis of estimate values of particular parameters. Due to the specificity of hydrogeological recognition, quantity and spatial characteristics of parameter values is possible, which is used in the DRASTIC method.
An assessment of vulnerability of groundwater to contamination was also performed basing on the calculation of the DRASTIC index for the values of particular parameters most frequently occurring in the KNP area. The value of the DRASTIC index obtained for the dominating values amounting to 125.5 classified the area in terms of vulnerability to the medium class, really on the border of low/medium (Table 6) [7]. The presented calculations and results obtained indicate clearly the necessity of performing precise assessments of vulnerability, estimating it on the basis of average or dominating values does not correspond to real vulnerability of groundwater of the studied system.
| No | Parameter | Dominating class of value (percent-age share in the entire KNP region) | Weigh | Rank | DRASTIC index | |
|---|---|---|---|---|---|---|
| 1 | D | 1.1 – 3.0 [m] (48%) | 5 | 9 | 45 | |
| 2 | R | 151-180 [mm/year] (37%) | 4 | 4 | 16 | |
| 3 | A | river and fluvioglacial sands | 3 | 6 | 18 | |
| (39%) | ||||||
| 4 | S | dusty soil, mineral-muck soil, allu- | 2 | 5 | 10 | |
| vial soil (27%) | ||||||
| 5 | T | 0.0-0.2 [%] (94%) | 1 | 9.,5 | 9,5 | |
| 6 | I | river and glacifluvial sands (31%) | 5 | 3 | 15 | |
| 7 | C | 13-28 [m/d] ( 48%) | 3 | 4 | 12 | |
| DRASTIC index – 125.5 | ||||||
Table 6: DRASTIC index value for dominating values of specific parameters.
Specific Vulnerability of Groundwater Due to Land Development
The location of KNP near Warsaw makes the territory diverse in terms of land development, from urbanised (suburbs of Warsaw) through agricultural (Blonski level and partially Kampinos terrace), compact single-family development (region of small towns in the park’s lagging) to practically an unchanged area anthropogenically (area of national park).
The Blonski level, located to the south of KNP is an agricultural territory with several places of compact, single family housing. Currently, this area is insignificantly change anthropogenically, however, under the potential influence of threats of quality of waters resulting from fertilization, flow of contamination from house-holds (most often without a sewage network), small workshops, trade factories, shops or petrol stations, even roads. Unfortunately, the amount of fertilization is not registered, which disables the estimation of the initial load of nitrate released to the environment.
The south-east part of KNP surroundings is urbanized significantly. On this territory a number of objects are located, which activity may impact water relations negatively, in this also the quality of groundwater. Among others, the following objects constitute a potential threat: residential estates, waste and compos deposit, pharmaceutical factories, renovation and trade factories (e.g. tanneries, paint factories, paint shops, print shops) and others.
The south-eastern part of the KNP surroundings, especially the towns located there; create an enclave in a park, cutting into it at a narrow wedge. Next to the territories, the largest treatment plant is located in this region, as well as other infrastructural objects.
The DRASTIC method was used to assess specific vulnerability to contamination in the region of Kampinos National Park, taking into account additional parameters defining a potential risk of threat of groundwater connected with land development [24]. Values of the parameter (rank and weight) have been accepted, taking into account the possibility of threatening groundwater from the surface of the territory connected with its variable land development. The specific vulnerability value was determined according to the DRASTIC formula taking into account parameter L being the product of the weight and rank connected with land development (Table 7). A rank of a parameter has been accepted in accordance with the proposition presented by [24]. The method of land development has been accepted on the basis of own studies.
| Land development | Lr |
|---|---|
| industry | 6 |
| local waste deposits | 5 |
| territory used for agriculture | 7 |
| territory used for agriculture, eco- | 5 |
| logical farms | |
| suburban area | 8 |
| forests | 1 |
| area remaining under legal protection, undeveloped | 1 |
| area of dunes, uncovered area | 1 |
Table 7: Value of rank Lr connected with land development.
Specific vulnerability of groundwater to contamination has been determined on the basis of calculations [25] according to the expanded formula applied to the DRASTIC index:
CD index = DR Dw + RRRw + ARAw + SRSw + TRTw + IRIw + CRCw + LwLr (4)
CD index – DRASTIC index + Lw Lr
where:
CD index – index of specific groundwater vulnerability, Lw – relative weight land use, Lr – rank of the potential risk associated with land use of land use; the rest of the parameters are the same as in equation. [1,2].
According to previous classification, six classes were formed of specific vulnerability of groundwater to contamination in the KNP region and it’s lagging:
• A - very low (CD index <100),
• B - low (CD index 100 to 130),
• C - medium (CD index 131 to 160),
• D - moderately high (CD index 161 to 190),
• E - high (CD index 191 to 220),
• F - very high (CD index >220)
The area of studies is characterized by a moderately high (55% of the area, that is over 340 km2) and medium (40% of the area, that is 247 km2) specific vulnerability to contamination calculated in accordance with the formula [3] (Figure 2). The remaining classes of vulnerability occur on a significantly smaller area, e.g. the area of very high class vulnerability takes up approximately 40 km2, and very high 0.02 km2.
Specific Vulnerability of Groundwater to Nitrate Contamination
In accordance with the binding legal acts, waters threatened with contamination are: groundwater in which the content of nitrogen amounts from 40 to 50 mg NO3/L and shows an increasing trend. Groundwater is regarded as polluted water if the content of nitrogen amounts to more than 50 mg NO3/L.
The share of nitrates in useable groundwater of water-bearing levels in Poland varies greatly; the hydro-geochemical background of nitrate fluctuates between 0.1 and 10 mg/L.
In the region of Kampinos National Park, only one point is located, which belongs to the national (regional) monitoring system. That is why for the needs of indicating areas particularly vulnerable for contamination of nitrate, detailed recognition of nitrate concentration in groundwater has been conducted in piezometers. Chemical analyses of groundwater in KNP were conducted in 3 rounds: September/ October (IX/X) 2008, April 2009, September 2009 (Table 8). Samples of water were taken from all 56 piezometers of the monitoring network. During some trials, the number of taken samples was smaller due to technical terms; checking and control measurements were conducted many times, almost 200 marking of nitrate contents were conducted in total.
| Hydrozones | Statistical parameter | Data od sampling | ||
| dune zones - north part | 2008 | April 2009 | September 2009 | |
| mean | 19,81 | 23,58 | 21,17 | |
| standard error | 8,14 | 11,85 | 9,00 | |
| median | 4,87 | 7,08 | 7,53 | |
| standard deviation | 28,19 | 39,30 | 29,85 | |
| range | 91,19 | 128,37 | 80,57 | |
| minimum | 0,00 | 0,00 | 5,31 | |
| maximum | 91,19 | 128,37 | 85,88 | |
| dune zones - south part | Statistical parameter | 2008 | April 2009 | September 2009 |
| mean | 5,24 | 9,30 | 10,62 | |
| standard error | 0,58 | 3,14 | 4,03 | |
| median | 4,87 | 5,53 | 6,86 | |
| standard deviation | 1,41 | 7,70 | 9,87 | |
| range | 3,98 | 19,92 | 25,23 | |
| minimum | 3,98 | 4,43 | 5,31 | |
| maximum | 7,97 | 24,35 | 30,54 | |
| marsh zones– north part | Statistical parameter | 2008 | April 2009 | September 2009 |
| mean | 9,90 | 8,66 | 8,73 | |
| standard error | 4,84 | 3,11 | 4,05 | |
| median | 3,76 | 6,64 | 4,87 | |
| standard deviation | 13,68 | 8,24 | 10,72 | |
| range | 38,07 | 22,13 | 32,32 | |
| minimum | 0,89 | 0,00 | 0,00 | |
| maximum | 38,96 | 22,13 | 32,32 | |
| marsh zones– south part | Statistical parameter | 2008 | April 2009 | September 2009 |
| mean | 6,14 | 8,47 | 8,02 | |
| standard error | 1,42 | 2,04 | 1,75 | |
| median | 3,54 | 8,85 | 7,30 | |
| standard deviation | 4,03 | 5,40 | 4,95 | |
| range | 9,30 | 15,49 | 15,94 | |
| minimum | 3,10 | 2,21 | 1,77 | |
| maximum | 12,39 | 17,71 | 17,71 | |
| flood plainterrace | Statistical parameter | 2008 | April 2009 | September 2009 |
| mean | 22,72 | 47,73 | 29,30 | |
| standard error | 9,12 | 19,25 | 11,16 | |
| median | 17,04 | 30,10 | 22,13 | |
| standard deviation | 22,33 | 47,16 | 24,96 | |
| range | 56,66 | 108,90 | 58,88 | |
| minimum | 0,44 | 5,75 | 5,75 | |
| maximum | 57,10 | 114,65 | 64,63 | |
Table 8: Nitrate concentration in groundwater in KNP hydrozones.
In the northern dune zone, a variable changing period of nitrate concentration was noted, with a small increasing tendency of the mean value in time. This tendency is also clear in maximum values of nitrates, in April 2009, the maximum value amounted to 128 mg/L. Claimed high values of nitrate concentrations, exceeding the limit valued specified in the Regulation of the Minister of Health (Dz.U.10.72.466), show a point character of contamination. The north dune zone neighbours the used agricultural terrace, farms are located here and there is no sewage system. In the southern dune zone, the scope of concentrations is less. The mean value of nitrates does not exceed 11 mg/L, and the maximum concentration even locally does not exceed 31 mg/L.
Within the scope of marshy zones, the mean nitrogen concentration amounts to only 10 mg/L and not tendencies for changing the nitrogen concentration in time has been observed. A higher scope of concentration occurs in the north marshy zone, the highest mean value from the sample of 2008 amounted to 9.9 mg/L and the maximum value contained 39 mg/L. Smaller scopes of nitrate concentrations occur in the southern marshy zone, where the maximum value is 17.7 mg/L. Higher values of nitrate concentration occur in all three series of samples on the fluvial terrace, the mean value for the sample from April 2009 amounted to over 48 mg/L, and the maximum value in April 2008 exceeded 115 mg/L. The values of concentrations classify the area of the fluvial terrace of the Vistula as polluted with nitrate compounds from agricultural sources. The described hydrozone is an area both used for agriculture, as well as in relation to other territories being on the border of KNP and the lagging, settled densely.
For the region of Warsaw’s suburbs and the Blonski level (Table 9), due to the lower number of markings, calculations of primary statistical parameters were conducted on all the markings without the characteristic of change in time. Despite the agricultural activity conducted on the area of the Blonski level, the mean nitrate concentration is low, amounts to 12.35 mg/L, but the maximum value achieved 40 mg/L indicating waters threatened with contamination, though there are no clear circumstances for the increase of nitrate concentrations in time. A significantly higher value of concentrations is noted on the resided and partially agricultural territories constituting the suburbs of Warsaw (Blonski level). The mean value of nitrate concentration is higher than 22 mg/L, and the maximum value exceed 115 mg/L, which classified the areas as contaminated.
| Hydrozones | Statistical parameter | NO3 [mg/L] |
|---|---|---|
| Accumulative-erosive Warsaw-Blonie terrace called Blonski level | mean | 12.35 |
| standard error | 6.21 | |
| median | 9.32 | |
| standard deviation | 12.88 | |
| range | 38.18 | |
| minimum | 1.33 | |
| maximum | 39.52 | |
| Warsaw’s suburbs | mean | 22.49 |
| standard error | 14.21 | |
| median | 5.11 | |
| standard deviation | 31.77 | |
| range | 111.44 | |
| minimum | 3.55 | |
| maximum | 115.00 |
Table 9: Nitrate concentration in groundwater in selected KNP hydrozones.
Specific vulnerability of groundwater to contamination with nitrate has been determined on the basis of calculations [25] according to the expanded formula applied to the DRASTIC index:
NV index = (DR Dw + RRRw + ARAw + SRSw + TR>Tw + IRIw + CRCw) LU (5)
where:
NV index – nitrate vulnerability index, LU - potential risk associated with land use; the rest of the parameters are the same as in equation. [1,2]
This is applying the DRASTIC formula to assess the specific vulnerability of groundwater to nitrate, bas-ing on the possible impact of land development [25]. Land development is analysed in the aspect of possible, potential contamination of groundwater with nitrate, but also a possibility of protecting waters before any potential contamination. The scope of values of the parameter LU fits within the scope from 0.1 to 1.0. The lowest values correspond with the areas, which are the least exposed to potential contamination with nitrate, the highest connected are with a potential risk. The area regarded as slightly changed anthropogenically, therefore, the forest areas, are characterised by a low LU value (0.1), while for agricultural areas, a higher LU value has been assumed (from 0.3 to 0.6). For urbanised areas, depending on the method and type of development, the following LU value has been assumed- from 0.6 to 1.0.
Six classes were formed of specific vulnerability of groundwater to contamination in the KNP region and its lagging:
A - very low (NV index <10),
B - low (NV index 10 to 50),
C - medium (NV index 51 to 100),
D - moderately high (NV index 101 to 150),
E - high (NV index 151 to 200),
F - very high (NV index >200)
The area of studies is characterised by low (69% of the area that is over 426 km2) and medium (22% of the area that is 136 km2) specific vulnerability to contamination with nitrate (Figure 2). The remaining classes of vulnerability occur on a significantly lower level.
Results and Discussion
The assessment of vulnerability of groundwater to contamination in the KNP region was conducted in applying few commonly used methods (Table 10). The method of studies applied in the KNP region through subsequent, complementary steps, processing databases in GIS systems, model studies, the applying the DRASTIC index, CD index and NV index has created the possibility to correctly determine intrinsic and specific vulnerability of groundwater to contamination.
| Vulnerability class | Surface of area of particular clas-ses of vulnerability [km2] | Practical specification of vulnerability classes (developed on the basis of Foster et.al. 2002) | ||
|---|---|---|---|---|
| DRASTICindex | CD index | NV index | ||
| Avery low | <1 | <1 | <1 | Practically no vulnerability of groundwater to contamina-tion |
| B low | 13 | 2 | 426 | Vulnerability of groundwater to conservative contamina-tion in their constant effect. |
| C medium | 324 | 247 | 136 | Vulnerability of groundwater to some contamination,mainly conservative in conditions of their constant effect. |
| D moderately-high | 229 | 340 | 57 | Vulnerability of groundwater to some contamination, but only in conditions of their constant effect. |
| E high | 53 | 30 | <1 | Vulnerability of groundwater to a lot of contamination and fast activity of contamination in many situations. |
| F very high | <1 | <1 | <1 | Vulnerability of groundwater to a lot of contamination and fast activity of contamination in most situations. |
Table 10: Area of particular classes of intrinsic and specific vulnerability.
The calculable value of the NV index was compared with the depth to groundwater (mean value) and noted nitrate concentrations (mean values). The values obtained (Table 11) confirm that in the case of a variable territory in terms of development and hydrogeological conditions, there is not direct relation between the factors conditioning vulnerability of groundwater.
| Hydrozone | Land development | Mean depth to groundwater(scope of changes) [m] | Nitrate concen-trations (scope of varia-bility) NO3 [mg/L] | NV index, mean value(scope ofchanges) |
|---|---|---|---|---|
| Vistula floodplain terrace | Several places of compact,single-family housing,recreational and touristregions, partially of anagricultural character (eco-logical agriculture) | 1.91 (1.23 – 2.43) | 0.44 – 114.65 | 60 ( |
| Marsh zones | Forest-marshy territories,very limited development | 1.03 – 1.15 (0.30-1.64 northzone; 0.49 – 1.94 south zone) | 0.0 – 38.96 | 75 ( |
| Dune zones | Compact forest complexes,practically no residents | 2.60 – 2.67 (2.04 – 3.17 northzone; 1.97-3.13 south zone) | 0.0 – 128.37 | 55 ( |
| Blonski level(together withpart of the up-land) | Agricultural territory withseveral places of compact,single-family housing. | 2.15 (0.97 - 2.99) | 12.35 (1.33 –39.52) | 82 (51 – 150) |
| Suburb of War-saw | Quite compact suburbandevelopment and smallforest areas accompanyingit. Numerous focuses ofcontamination. Smallsemi-agricultural areas. | 2,32 (1,53 – 2,96) | 22,49 (3,55 –115,0) | 114 (51 – 200) |
| Region of intakein Wolka Smo-lana | The largest intake ofgroundwater in the KNPregion and lagging. Partial-ly developed area, agricul-tural. | 3,16 (2,35 – 3,21) | - | 141 (51-150) |
Table 11: Characteristic of groundwater vulnerability in KNP.
Statistical calculations have been conducted concerning the correlation of parameters applied in assessing intrinsic vulnerability with the DRASTIC method for data from 61790 blocks (Table 12).
| D | R | A | S | T | I | C | |
|---|---|---|---|---|---|---|---|
| D | 1.0 | ||||||
| R | +0.74 | 1.0 | |||||
| A | -0.34 | +0.41 | 1.0 | ||||
| S | -0.18 | +0.44 | +0.79 | 1.0 | |||
| T | +0.11 | +0.59 | +0.28 | -0.23 | 1.0 | ||
| I | -0.32 | +0.78 | +0.79 | +0.71 | +0.23 | 1.0 | |
| C | -0.21 | +0.49 | +0.89 | +0.32 | +0.11 | +0.79 | 1.0 |
Table 12: Pearson’s correlation matrix of parameters applied in assessing intrinsic vulnerability in KNP region.
The high value of correlation indicates a dependency between parameters, in consequent a possibility of simplifying the method of assessment in the case of intrinsic vulnerability, using statistically independent parameters.
Another stage of studies was the assessment of dependencies between the DRASTIC index and concentration of nitrates conducted in a few variants. Lineal correlation was calculated between the mean concentration of nitrates and the value of the DRASTIC index in a given observation point; the value amount to 0.51.
The spatial variability of nitrate concentrations was conducted using the standard kriging method. A distribution of values was obtained and tables of nitrate concentrations in each calculation block (matrix of data). Calculations of correlations were performed with the value of the DRASTIC index and value of nitrate concentrations for all 61790 blocks. The value of the coefficient of lineal correlation r amounts to 0.61. Statistical calculation verifies the accepted calculation method, indicating the justification of its application. The high value of correlation confirms the usefulness of performing a statistical distribution using the kriging method and justification of choosing the DRASTIC method to assess intrinsic vulnerability of groundwater to contamination in the KNP region. In order to verify the assessment of specific vulnerability of groundwater to contamination conducted according to the DRATIC procedure, the correlation value was calculated between the mean nitrate concentration of groundwater, NV index and CD index. The values of lineal correlation r for the correlation value between the mean nitrate concentration of groundwater and NV index and CD index reached 0.68 and 0.55 respectively. The method of assessing specific vulnerability specified by the vale NV index correlates well (r=0.64) with the DRASTIC method. The method can be used in regional assessments of specific vulnerability however, in maintaining requirements and notes concerning the DRASTIC procedure, especially in detailed scope, the quantity assessment of values of parameters necessary for calculating the DRASTIC index.
Conclusions
Results of the comprehensive hydrogelogical assessment presented in the context of local topography and soil layering provided the basis for creating a reliable and precise environmental database of the KNP region. Use of GIS techniques and geostatistical methods during the development of the vulnerability map made possible a more precise assignment of the parameter values and, subsequently, allowed for a more accurate distinction of vulnerability types. The use of extensive data series comprising long-term hydrogeological measurements in monitoring network resulted in better determination of groundwater horizons in all hydro-zones defined within the KNP area.
DRASTIC method enabled creation of general classification and the map of intrinsic vulnerability for the study area, based on calculated values of the IPZ index. This type of enhancement of the basic DRASTIC method can be done for the entire KNP region or just for selected parts, characterized by high intrinsic vulnerability, or perhaps only in cases where there are planned changes in development. The maps of groundwater vulnerability developed using DRASTIC show that the river valley region, which covers nearly 90% of the study area, represents medium and moderate high vulnerability. The DRASTIC method can be used for the accurate assessment of the groundwater pollution risk in the study area as it is usually expressed (by the correlation between groundwater intrinsic vulnerability and nitrates concentration).
Interpretation of vulnerability results requires in each case individual approach and taking into account the specifics of the area of study. An example can be the environmental situation in the KNP region; a threat of the depth to groundwater lowering and results of this phenomenon constitutes here the greatest threat for plant life. The increase of thickness of the aeration zone, negative for the biotic environment, influences the decrease of the DRASTIC index and causes a longer saturation time by the aeration zone, which results in classifying the studied area to a lower vulnerability class of groundwater of the system – it becomes “safer”, which paradoxically is a threat to the park. The planned target denaturalization of some of the biotic systems, e.g. marshy in KNP will result in increasing the vulnerability class of groundwater to contamination of the hydrogeological system (the system will become more vulnerable).
Acknowledgements
This research was funded by Norwegian Financial Mechanism in project: “Development of the method for reconstruction primary hydrologeological conditions in Kampinoski National Park in order to restrain nature degradation and improvement of biodiversity status” (2008-2010).
References
- Margat J (1968) Vulnérabilité des nappes d´eau souterraines á la pollution. Bases de lacartographie. BRGM 68, Orléans, France.
- Van Duijvenbooden W, Waegeningh HG (1987) Vulnerability of Soil and Groundwater to Pollutants, Pro-ceedings and Information. International Conference held in Netherlands, 1987, TNO Com-mittee on Hydrological Research, Delft, The Netherlands.
- Barrocu G, Biallo G (1993) Application of GIS for aquifer vulnerability evaluation. Application of Geo-graphical Information Systems in Hydrology and Water Resources Management. HydroGIS93. IAHS 211: 571-580.
- Evans BM, Myers WL (1990) A GIS-based approach to evaluating regional groundwater pollution potential with DRASTIC. J Soil Water Conserv 45: 242-245.
- Vrba J, Zaporozec A (1994) Guidebook on mapping groundwater vulnerability, IAH, International Contributions to Hydrogeology, 16 Heise Verlag, Hannover.
- Zurek A, Duda R, Foryciarz K, Kolat M (1999) Rangowa Ocena Odpornosci Zbiorników Wód.
- Krogulec E (2004) Vulnerability assessment of groundwater pollution in the valley unit in terms of the hydrodynamic conditions. Wydawnictwa Uniwersytetu Warszawskiego, Warszawa.
- Anderson LJ, Gosk E (1989) Applicability of vulnerability maps in Environmental Geologie. Water Science 13: 39-43.
- Foster SSD (1987) Fundamental concepts in aquifer vulnerability, pollution risk and protection strategy. International Conference, 1987, Noordwijk Aan Zee, the Netherlands Vulnerability of Soil and Groundwater to Pollutants The Hague, Netherlands Organization for Applied Scientific Research, Pages 69-86
- Regulation of Ministry of Environment, Dz.U. Nr 241, poz. 2093, 2002. Poland.
- Aller L, Bennet T, Lehr JH, Petty RJ (1987) DRASTIC: Standardized system for evaluating groundwater pollution potencial using hydrogeologic settings. US EPA Report 600/2-87-035 US EPA, Ada, OK.
- Krogulec E (2006) Methods and results of groundwater vulnerability evaluation to contamination In the Kampi-noski National Park. Acta Geologica Polonica 56: 349-359.
- Krogulec E, Furmankowska A, Trzeciak J, Zablocki S (2010) Range determining factors and tendencies of groundwater level changes in wetland areas. Biuletyn Panstwowego Instytutu Geologicznego 441: 73-82.
- Healy RW, Cook PG (2002) Using ground water levels to estimate recharge. Hydrogeol J 10: 91-109.
- Scanlon BR, Healy RW, Cook PG (2002) Choosing appropriate techniques for quantifying groundwater recharge. Hydrogeology J 1: 18-39.
- Magnuszewski A (1990) An automated method for calculating the characteristics of nizówkowych. Review of Geophysical 1: 79-83.
- Tomaszewski E Use of the modified algorithm to evaluate the size FRIEND power underground rivers. In: A. Magnuszewski & Laws Soczynska. Hydrology at the beginning of the twenty-first century, Committee on Hydrological PTG. University of Warsaw, Warsaw.
- Soczynska U, Gutry-Korycka M, Pokojska P, Mikos D (2003) Balance potamologiczny as a method of assessing the variability of water circulation in the basin of the weasel (Kampinoski National Park). Ecohydrology and Hydrobiology 3: 291-309.
- McDonald M, Harbaugh A, Brennon R, Ackerman D (1988) A method of converting no-flow cells to varia-ble-head cells for the U.S. Geological Survey modular finite-difference ground-water flow model. U.S. Geological Survey. Washington.
- Harbaugh AW, Banta ER, Hill MC, McDonald MG (2000) MODFLOW-2000, The U.S. Geological Sur- vey Modular Ground-Water Model - User guide to modularization concepts and the ground-water flow process: U.S. Geological Survey Open-File Report 00-92.
- Marciniak M (1999) Identyfikacja parametrów hydrogeologicznych na podstawie skokowej zmiany potencjalu hydraulicznego. Metoda PARAMEX. Wyd. Nauk. UAM, Poznan.
- Secunda S, Collin ML, Melloul AJ (1998) Groundwater vulnerability assessment using a composite model combining DRASTIC with extensive agricultural land use in Israel’s Sharon region. J Environ Manage 54: 39–57.
- Martinez-Bastida JJ, Arauzo M, Valladolid M (2010) Intrinsic and specific vulnerability of groundwater in central Spain: the risk of nitrate pollution. Hydrogeology Journal 18: 681-698.
Citation: Krogulec E (2013) Intrinsic and Specific Vulnerability of Groundwater in a River Valley - Assessment, Verification and Analysis of Uncertainty. J Earth Sci Clim Change 4: 159. DOI: 10.4172/2157-7617.1000159
Copyright: ©2013 Krogulec E. This is an open-access article distributed under the terms of the Creative Commons Attribution License, which permits unrestricted use, distribution, and reproduction in any medium, provided the original author and source are credited.
Select your language of interest to view the total content in your interested language
Share This Article
Recommended Journals
Open Access Journals
Article Tools
Article Usage
- Total views: 19448
- [From(publication date): 12-2013 - Dec 19, 2025]
- Breakdown by view type
- HTML page views: 14444
- PDF downloads: 5004