Neural Mechanisms of Fine-Grained Temporal Processing in Audition
Received: 31-Dec-2011 / Accepted Date: 23-Feb-2011 / Published Date: 28-Feb-2012 DOI: 10.4172/2161-119X.S3-001
Abstract
Our auditory percepts do not necessarily correspond to an immediately present acoustic event but, rather, is the outcome of processing incoming signals over a period of time. For example, when acoustic pulses are periodically delivered at >20-40 ms intervals, individual signals are clearly heard as discrete events, whereas at ≤ 20-40 ms intervals, the same signals are perceptually merged together. Psychophysicists have adopted the concept of a “temporal grain” defined by a 20-40 ms time frame to explain the above phenomenon: when successive signals fall into different temporal grains, each signal is perceptually “resolved” as a series of discrete events. However, when the signals fall within the same temporal grain, they are perceptually integrated into a single continuous event. Such temporal grain is lost after bilateral ablation of the primary auditory cortex (AI). Neurophysiology studies on humans and animals support the view that this corresponds to the cut off interval (~30 ms) for AI neurons to generate discharges with time-locking to individual signals (i.e., stimulus-locking response); at shorter intervals, the neurons only generate a single discharge cluster at the onset of the signal train which is often followed by suppression. Such temporal behavior was captured well by our neurocomputational model [1] which incorporates temporal interplay among (1) AMPA-receptor-mediated EPSP, (2) GABAA-receptor-mediated IPSP, (3) NMDA-receptor-mediated EPSP, (4) GABAB-receptor-mediated IPSP in the AI neuron along with (5) short-term plasticity of thalamocortical synaptic connections. Ramifications from these findings are discussed in relation to language impairment.
Introduction
Our auditory percept does not necessarily correspond to immediately present acoustic events but, rather, the outcomes from processing incoming signals over a certain time period [2]. One typical example is the interval-dependent perceptual quality of acoustic pulses. When the pulses are periodically delivered over intervals of ≥ 20-40 ms (called “order threshold”), individual signals are clearly heard as “discrete” events and the pulse train holistically produces a sensation of “rhythm” [3]; (2) at intervals of ≤ 1-3 ms (called “fusion threshold”), individual signals perceptually fuse into a single “tonal” sensation [4,5]; (3) in the transition range, a series of signals produces a buzz or rattle like sensation, called “roughness” [6].
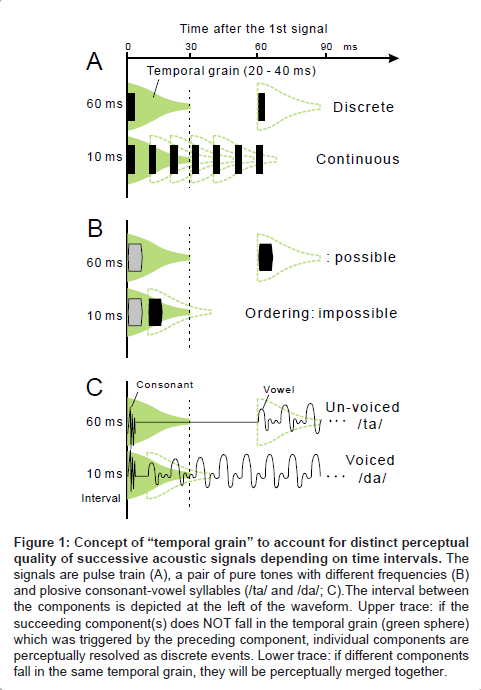
In order to explain the above findings, psychophysicists [7,8] have adopted the concept of “temporal grain” which operates over a range of 20-40 ms (green sphere, Figure 1A). When successive signals fall into different temporal grains, each signal is perceptually “resolved” as a distinct event (upper trace); when the signals fall within the same temporal grain, they are perceptually integrated as a single continuous event (lower trace). Under this scheme, the order threshold is considered as a manifestation of the 20-40-ms temporal grain. The fusion threshold is considered to be a 1-3-ms temporal grain, otherwise “resolution–integration paradox” would be entailed [9,10].
The present article reviews the literatures in the fields of psychophysics, neurophysiology and computational neuroscience that have addressed temporal grain which gives rise to the order threshold. Then, I discuss implications of the findings from a clinical perspective.
Psychophysical Studies of the Temporal Grain with a 20-40 ms Frame in Audition
Non-linguistic correlate to the temporal grain: order threshold
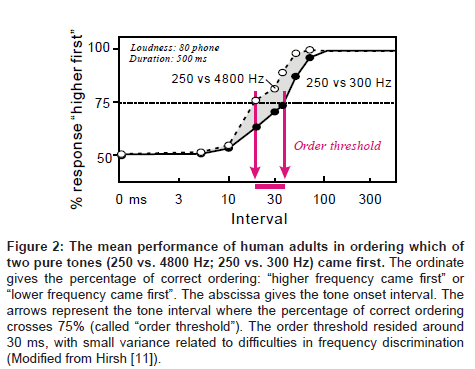
As briefly mentioned above, the order threshold is a canonical example of 20-40 ms temporal grain of auditory processing. The order threshold was first defined by Hirsh [11] as the minimal interval between two successive signals required for listeners to detect which of the two was presented first. In his pioneering studies [11,12], pairs of various kinds of acoustic signals (e.g., different tones, band noise and pulses) were employed: within-pair differences were made regarding to frequency (in the case of tones), spectrum (in the case of band noise), duration, laterality, etc. While modifying the intervals for a certain pair of signals, the listeners were asked which signal came first – tone or noise, higher or lower frequency, from the right or left ear, etc. The results indicated that the listeners could distinguish signal order with a 75% accuracy if the interval was longer than 20-40 ms (Figure 2).This value was found to be virtually independent of frequency, bandwidth and laterality, suggesting that the order threshold is the elaboration of central, receptor-independent mechanisms (Figure 2).
Linguistic correlate to the temporal grain: voice onset time (VOT) boundary
Figure 1: Concept of “temporal grain” to account for distinct perceptual quality of successive acoustic signals depending on time intervals. The signals are pulse train (A), a pair of pure tones with different frequencies (B) and plosive consonant-vowel syllables (/ta/ and /da/; C).The interval between the components is depicted at the left of the waveform. Upper trace: if the succeeding component(s) does NOT fall in the temporal grain (green sphere) which was triggered by the preceding component, individual components are perceptually resolved as discrete events. Lower trace: if different components fall in the same temporal grain, they will be perceptually merged together.
Figure 2: The mean performance of human adults in ordering which of two pure tones (250 vs. 4800 Hz; 250 vs. 300 Hz) came first. The ordinate gives the percentage of correct ordering: “higher frequency came first” or “lower frequency came first”. The abscissa gives the tone onset interval. The arrows represent the tone interval where the percentage of correct ordering crosses 75% (called “order threshold”). The order threshold resided around 30 ms, with small variance related to difficulties in frequency discrimination (Modified from Hirsh [11]).
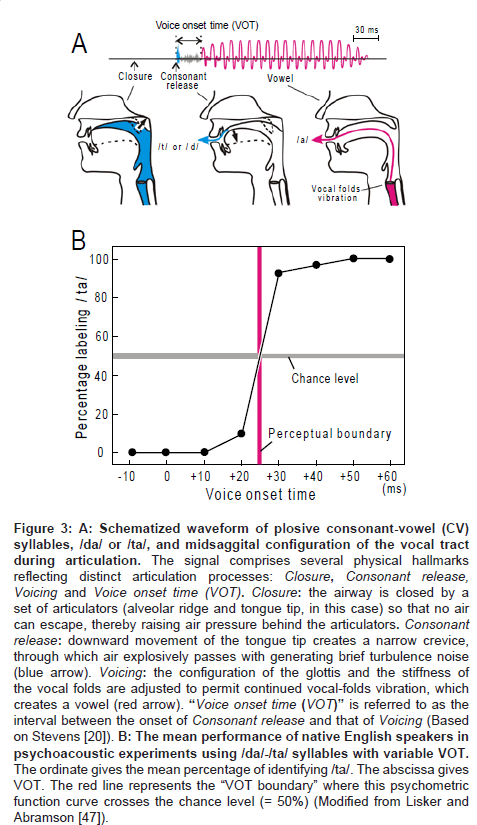
Another manifestation of the 20-40 ms temporal grain is the categorical perception of stop consonant-vowel syllables such as /da/-/ ta/ distinction (reviewed by Lieberman et al. [13]). The phonemes /da/ and /ta/, or something very much like these, occur in all languages which have been surveyed throughout the world [14,15]. Figure 3A (upper trace) gives schematic representation of the waveform of /da/ or /ta/. This waveform has three hallmarks which are, (1) closure, (2) consonant release and (3) vowel. The time interval between the onset of consonant release and vowel, which is termed “voice onset time (VOT),” functions as the main constraint on /da/ or /ta/ perception. Figure 3B illustrates the results of psychoacoustic experiments performed on native English speakers. The subjects were presented with one of the /da/-/ta/ syllables with variable VOT (0, 10, 20, 30, 40, 50, 60 ms) and then were asked whether the signal was heard as /da/ or /ta/. The mean of percentage for labeling /ta/ was plotted as a function of VOT. When the VOT is shorter than 25 ms, the subjects perceived the syllable exclusively as / da/; when the VOT was prolonged above 25 ms, the perceived quality jumped abruptly to /ta/, instead of changing gradually. The value of VOT at which this psychometric function crosses the threshold of random change (= 50 %) is termed as the “VOT boundary” (red line; for strict definition, [16]). In many languages, the VOT boundary resides at the 20-40 ms range with some variance among place of articulation (Comment1).
Figure 3: A: Schematized waveform of plosive consonant-vowel (CV) syllables, /da/ or /ta/, and midsaggital configuration of the vocal tract during articulation. The signal comprises several physical hallmarks reflecting distinct articulation processes: Closure, Consonant release, Voicing and Voice onset time (VOT). Closure: the airway is closed by a set of articulators (alveolar ridge and tongue tip, in this case) so that no air can escape, thereby raising air pressure behind the articulators. Consonant release: downward movement of the tongue tip creates a narrow crevice, through which air explosively passes with generating brief turbulence noise (blue arrow). Voicing: the configuration of the glottis and the stiffness of the vocal folds are adjusted to permit continued vocal-folds vibration, which creates a vowel (red arrow). “Voice onset time (VOT)” is referred to as the interval between the onset of Consonant release and that of Voicing (Based on Stevens [20]). B: The mean performance of native English speakers in psychoacoustic experiments using /da/-/ta/ syllables with variable VOT. The ordinate gives the mean percentage of identifying /ta/. The abscissa gives VOT. The red line represents the “VOT boundary” where this psychometric function curve crosses the chance level (= 50%) (Modified from Lisker and Abramson [47]).
Summary
Psychoacoustic studies on humans and animals indicate that the perceived quality of successive acoustic signals drastically alters across the time interval of 20-40 ms regardless of whether the signals are phonetic or non-phonetic, reflecting general properties of the auditory system.
Involvement of the Primary Auditory Cortex (AI) in the Temporal Grain of the 20-40 ms Frame
Clinical reports regarding patients with lesions restricted to bilateral AI
There is a vast body of evidence indicating that humans with lesions restricted to the bilateral primary auditory cortex (AI) are impaired in speech comprehension while other basic language abilities such as speaking, reading and writing are spared. In those patients, the degree of deficit often diverted across phoneme classes: (1) consonantal tasks such as /d/-/t/ distinction were generally much more impaired as compared to vowel tasks such as /a/-/i/ distinction; (2) among consonantal tasks, the discrimination of plosives (/b/, /d/, /g/ …) was more heavily impaired than fricative (/f/, /th/, /sh/…), nasal (/m/, /n/, /ng/…), approximant (/l/, /r/, /y/…) etc [21-25]. Consonant release and VOT of plosive consonant-vowel syllables (Figure 3A) are the most rapid and brief phonological events. Vowels and many other consonants are longer in duration (ranging from tens to hundreds of milliseconds) and less temporally punctuated [26-28]. Therefore, it was suggested that bilateral AI is critically involved in fine-grained temporal processing as to effectively differentiate between plosive consonant-vowel syllables (ex., /d/-/t/ distinction).
The patients with bilateral AI lesions are often associated with prolongation of order threshold (see above), say from ~20 ms to 100 ms [29,30]. On the other hand, the patients usually show normal performance in pure-tone audiometry, which measures the capacity for detecting pure tones of variable frequency and intensity [31-33].
Taken together, while the patients with bilateral AI lesions have been classically diagnosed as having “pure word” deafness [31,34], the core deficit may reside in fine-grained temporal “auditory” processing, that causes speech comprehension to be disturbed.
Cortical ablation studies on animals
Presently, to my knowledge, no animal studies have examined the effect of selective ablation of bilateral AI on fine-grained temporal processing. It is, yet, noteworthy that bilateral ablation of the primary and secondary auditory areas in monkeys produced a permanent deficit in the ability to discriminate between conspecific vocalizations without significant audiometric hearing loss [35]. The involved acoustic cue(s) were not specified in this study. However, this finding is consistent with the symptoms for humans with bilateral AI lesion (see above).
If the sphere of ablation is expanded to the total body of auditory areas, it is likely that we will be able to find animal behavior studies that have analytically examined the effect on temporal processing. Specifically, such cortical ablation hindered identification of the order of signals in cats [36] and monkeys [37], discrimination between 10- and 300-Hz (corresponding to 3- to 100-ms intervals) trains of noise bursts in monkeys [38], detection of amplitude-modulation (AM) rate below but not above ~30 Hz (≥ 33-ms intervals) in rats [39], and detection of temporal gaps between noise in rats [40] and ferrets [41]. In general, such cortical ablation did not produce profound audiometric hearing loss [42-44].
Summary
Case studies of patients with lesions restricted to the bilateral AI indicated that the AI is critically involved in fine-grained temporal processing regardless of whether the signals are phonetic or nonphonetic. Cortical ablation studies on animals, while still in their infancy, support this view.
In Vivo Neurophysiology Studies on AI that Addressed the Neural Correlate to the 20-40 ms Temporal Grain
Temporal behavior of the primary auditory cortex (AI) in response to successive auditory signals
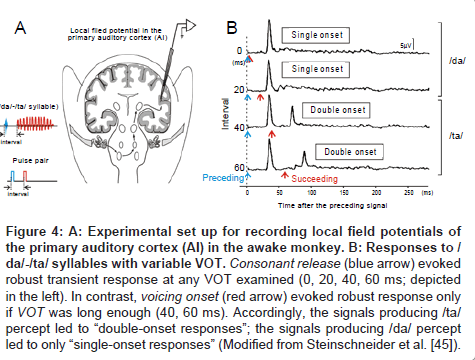
Local field potentials: To investigate the neural mechanisms underlying VOT-dependent categorical perception, Steinschneider et al. [45] recorded local field potential of the AI in awake monkeys while delivering /da/-/ta/ syllables with variable VOT (Figure 4A). Since the recording electrode tip was placed in lower lamina III, which arbors dense efferent fibers to higher auditory areas [46], the recorded neural activities (Figure 4B) were expected to be the outcome of intra-AI processing. When the VOT was long enough (60 ms [bottom] and 40 ms [2nd bottom]), the response comprised two distinctive peaks (namely, “double-onset” response): the 1st peak was evoked by consonant release (denoted by blue arrow) and the 2nd peak by vowel onset (denoted by red arrow). On the contrary, if VOT was short (0 ms [top] and 20 ms [2nd]), robust responses were evoked solely by the consonant release (namely, “single-onset” response). Since a 20-40 ms VOT is equivalent to the psychoacoustically measured VOT boundary for /ta/-/da/ syllables [18,47], the authors inferred that the AI would differentiate / ta/ and /da/ by representing /ta/ as a “double-onset” response, and /da/ as a “single-onset” response [45]. Such VOT-dependent category-like behavior of AI filed potential has been also observed in cats [48-50], guinea pigs [51], and even in humans who underwent epilepsy surgery [52,53]. Comparable findings have been obtained by MEG in humans [54,55].
As expected, we observed similar category-like behavior of AI field potentials in cats when the animal was presented with two successive acoustic pulses (inset in Figure 4A) instead of /ta/-/da/ syllables.
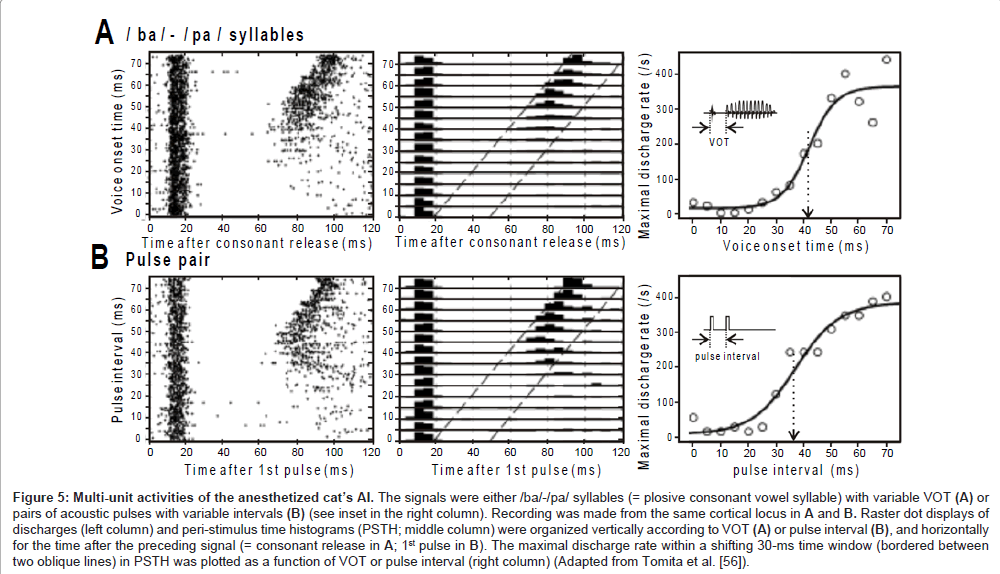
Multi-unit activities: The local field potentials are thought to represent summated activities across thousands or more neurons. In an attempt to capture the temporal behavior of a much smaller neural population, Eggermont and colleagues [56] applied a multi-unit recording technique to the AI of anesthetized cats. The set of sound signals was either (1) /ba/-/pa/ syllables with variable VOT or (2) two successive pulses with variable interval (inset in the right panel, Figures 5A and B, respectively).
Figure 4: A: Experimental set up for recording local field potentials of the primary auditory cortex (AI) in the awake monkey. B: Responses to / da/-/ta/ syllables with variable VOT. Consonant release (blue arrow) evoked robust transient response at any VOT examined (0, 20, 40, 60 ms; depicted in the left). In contrast, voicing onset (red arrow) evoked robust response only if VOT was long enough (40, 60 ms). Accordingly, the signals producing /ta/ percept led to “double-onset responses”; the signals producing /da/ percept led to only “single-onset responses” (Modified from Steinschneider et al. [45]).
The left panel in Figure 5A is a raster dot display of discharges that occurred during the presence of /ba/-/pa/ syllables (abscissa: time after consonant release; ordinate: VOT). At any VOT, the AI transiently generated discharges in response to consonant release with a ~10-ms latency. The excitation was followed by profound suppression lasting several tens of ms (i.e., post-activation suppression), during which the vowel failed to evoke discharges and even spontaneous discharges were a rare occurrence. At VOT >~ 40 ms, the vowel became to evoke discharges. The middle panel is a combination of peri-stimulus-time histograms (5-ms bin width). The maximal discharge rate within a sliding 30-ms time window (bounded between two oblique lines), which was potentially evoked by the vowel, was plotted in the right panel. The data points were distributed in a category-like manner, and thus were fitted with a sigmoid curve. The fitting curve resembled the psychometric function for the VOT dependent categorical perception (Figure 3B, solid line). Such concordance implies that the temporal behavior of the AI neurons is related to the mapping of the VOT continuum onto distinct phoneme categories: stimulus locking to both the consonant release and the vowel onset may represent an unvoiced /pa/, whereas onset response to only the consonant release may represent a voiced /ba/.
Figure 5B show the activities of the same cortical locus as for Figure 5A during the presence of pairs of successive pulses. Qualitatively, the neurometric curve (right panel) resembles the psychometric curve in the metric for the order threshold (Figure 2). This may indicate that the temporal behavior of the AI neurons also provides the basis for discreteness vs. continuousness distinction: stimulus locking to each pulse may represent discreteness; onset response to only the 1st pulse may represent continuousness.
Figures 5A and 5B marked concordance. The /ba/-/pa/ syllables and successive pulses have rather different spectral compositions but similar temporal structure in that the preceding component (consonant/1st pulse) and succeeding component (vowel/2nd pulse) are clearly separated by a (quasi-) silent period. Therefore, it is likely that the AI neurons relied on temporal structure of the signal in order to conduct category-like responses.
Classification of AI units: based on stimulus locking capacity
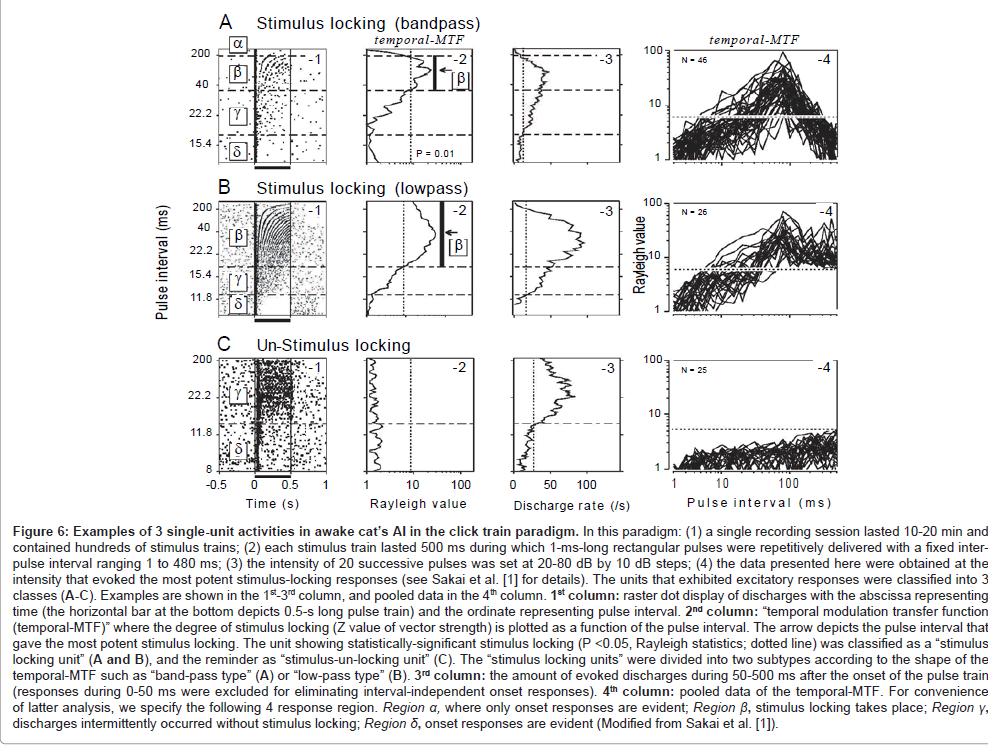
During the processing of communication sounds, temporal grain of the auditory system is supposed to operate somewhat like a chain (green spheres, Figure 1). To probe such functional architecture, we employed a train of acoustic pulses with variable intervals (= click train paradigm; see legend in Figure 6 for details). The responses of the cat’s AI were recorded using a single-unit recording technique. During the recording, the animals were kept awake in order to avoid (1) potential influence of anesthetics on the capacity for stimulus locking [57,58] and (2) spontaneous oscillatory discharges which occur predominantly while sleeping or under anesthetized conditions [59]. The data presented here were obtained at the stimulus intensity that evoked the most robust stimulus-locking responses.
One hundred sixteen single units were divided largely into two classes depending on the presence or absence of stimulus locking (stimulus-locking type: n=72; stimulus-un-locking type: n=44, respectively).
Figure 5: Multi-unit activities of the anesthetized cat’s AI. The signals were either /ba/-/pa/ syllables (= plosive consonant vowel syllable) with variable VOT (A) or pairs of acoustic pulses with variable intervals (B) (see inset in the right column). Recording was made from the same cortical locus in A and B. Raster dot displays of discharges (left column) and peri-stimulus time histograms (PSTH; middle column) were organized vertically according to VOT (A) or pulse interval (B), and horizontally for the time after the preceding signal (= consonant release in A; 1st pulse in B). The maximal discharge rate within a shifting 30-ms time window (bordered between two oblique lines) in PSTH was plotted as a function of VOT or pulse interval (right column) (Adapted from Tomita et al. [56]).
Figure 6A-1 is a raster dot display of discharges for a representative stimulus-locking unit. According to our criterion [1], this unit showed 4 response regions (region α−δ). In region α (intervals ≥ 200 ms), only the onset response was evident. In region β (intervals: 38-200 ms), stimulus-locking discharges took place. The magnitude of stimulus locking was statistically evaluated referring to temporal modulation transfer function (hereafter, temporal-MTF; A-2) where Rayleigh value of vector strength [60] was plotted as a function of inter-pulse interval (statistical significance [dotted line] was accepted at P <0.05). In region γ (intervals: 16-38 ms), discharges occurred intermittently without stimulus locking. The driven rate measured during 50-500 ms after the onset of the stimulus train (A-3) exceeded the threshold for excitation (dotted line). In region δ (interval ≤ 16 ms), only onset response was evident. The region with stimulus locking (region β) was flanked by the regions without stimulus locking (i.e., region α and region γ). Consequently, the temporal-MTF looked “band-pass” shaped. Bandpass shaped temporal-MTF was found in 46 stimulus-locking units (A-4).
The remaining 26 stimulus-locking units, as exemplified in Figures 6B, had regions β−δ but lacked region α. Region β extended to the maximal pulse interval (480 ms) that was adopted in the study. In other words, stimulus locking was evident down to the lower cut-end of repetition rate (2.1 Hz conversed from 480 ms). In this respect, the temporal-MTF was regarded as “low-pass” shaped.
Regardless of temporal-MTF shape, the border between regions β and γ (or shorter limiting pulse-intervals for stimulus locking) resided at ~30 ms (Table 1). This value is in line with the previous AI singleunit studies on un-anesthetized cats [61] and monkeys [62-64] and resembles both the order threshold [11] and the VOT boundary [13].
The capacity for stimulus locking was largely level tolerant over a range of at least 20 dB SPL. Specifically, the border between regions β and γ was not altered in a statistically significantly way when the stimulus intensity was changed from the best SPL to 20-dB below it [1,65]. This finding parallels to the relative level-invariance for the order threshold [11] and VOT boundary in psychoacoustics [66].
Figures 6C displays the responses of a stimulus-un-locking unit. This type of unit, when compared to the stimulus-locking units, generally had a far broader standard deviation of response latency (= spiking jitter) which was typically within several tens of milliseconds [65]. Because stimulus locking and the condensed nature of spiking jitter are two major indicators of the capacity for the temporal encoding of acoustic transients [67,68], this type of unit may NOT be well-suited to represent the temporal structure of acoustic signals. This type of unit will not be analyzed further since the main interest here is to address neural processes underlying fine-grained temporal processing.
Figure 6: Examples of 3 single-unit activities in awake cat’s AI in the click train paradigm. In this paradigm: (1) a single recording session lasted 10-20 min and contained hundreds of stimulus trains; (2) each stimulus train lasted 500 ms during which 1-ms-long rectangular pulses were repetitively delivered with a fixed interpulse interval ranging 1 to 480 ms; (3) the intensity of 20 successive pulses was set at 20-80 dB by 10 dB steps; (4) the data presented here were obtained at the intensity that evoked the most potent stimulus-locking responses (see Sakai et al. [1] for details). The units that exhibited excitatory responses were classified into 3 classes (A-C). Examples are shown in the 1st-3rd column, and pooled data in the 4th column. 1st column: raster dot display of discharges with the abscissa representing time (the horizontal bar at the bottom depicts 0.5-s long pulse train) and the ordinate representing pulse interval. 2nd column: “temporal modulation transfer function (temporal-MTF)” where the degree of stimulus locking (Z value of vector strength) is plotted as a function of the pulse interval. The arrow depicts the pulse interval that gave the most potent stimulus locking. The unit showing statistically-significant stimulus locking (P <0.05, Rayleigh statistics; dotted line) was classified as a “stimulus locking unit” (A and B), and the reminder as “stimulus-un-locking unit” (C). The “stimulus locking units” were divided into two subtypes according to the shape of the temporal-MTF such as “band-pass type” (A) or “low-pass type” (B). 3rd column: the amount of evoked discharges during 50-500 ms after the onset of the pulse train (responses during 0-50 ms were excluded for eliminating interval-independent onset responses). 4th column: pooled data of the temporal-MTF. For convenience of latter analysis, we specify the following 4 response region. Region a, where only onset responses are evident; Region ß, stimulus locking takes place; Region ?, discharges intermittently occurred without stimulus locking; Region d, onset responses are evident (Modified from Sakai et al. [1]).
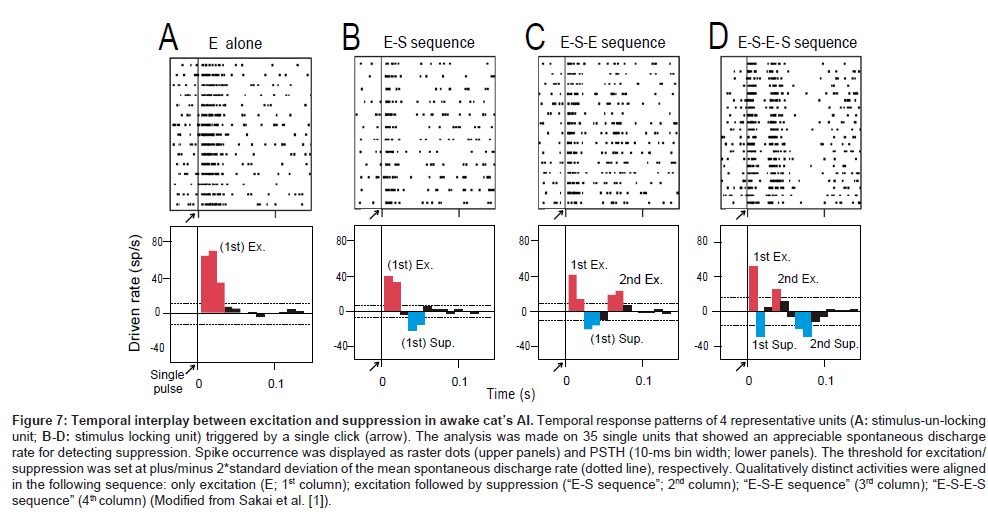
Figure 7: Temporal interplay between excitation and suppression in awake cat’s AI. Temporal response patterns of 4 representative units (A: stimulus-un-locking unit; B-D: stimulus locking unit) triggered by a single click (arrow). The analysis was made on 35 single units that showed an appreciable spontaneous discharge rate for detecting suppression. Spike occurrence was displayed as raster dots (upper panels) and PSTH (10-ms bin width; lower panels). The threshold for excitation/ suppression was set at plus/minus 2*standard deviation of the mean spontaneous discharge rate (dotted line), respectively. Qualitatively distinct activities were aligned in the following sequence: only excitation (E; 1st column); excitation followed by suppression (“E-S sequence”; 2nd column); “E-S-E sequence” (3rd column); “E-S-E-S sequence” (4th column) (Modified from Sakai et al. [1]).
| Unit type | Click train paradigm | Single click paradigm | |||
|---|---|---|---|---|---|
| N | Longer limit (a-b border) |
Shorter limit (b-g border) |
N | Sequence | |
| Stimulus locking (band-pass) | 46 | 174 ± 112 ms | 30.6 ± 25.9 ms | 9/14 | E-S-E-S* |
| 5/14 | E-S-E | ||||
| Stimulus locking (low-pass) | 26 | ― | 33.1 ± 28.7 ms | 8/13 | E-S-E |
| 5/13 | E-S | ||||
| Stimulus un-locking | 44 | ― | ― | 8/8 | E |
See Figure 6 for classification of unit type. Longer (shorter) limit: longer (shorter) limiting pulse-intervals for stimulus locking.
Table 1: Response variables (milliseconds; mean ± S.D.) in the click train paradigm and sequence of excitation and suppression in the single click paradigm.
Involvement of post-activation suppression in stimulus locking
As demonstrated by multi-unit recordings (Figures 5A and B, left column), post-activation suppression that was induced by the preceding signal (consonant release [A]; 1st pulse [B]) constrained responsiveness to the succeeding signal (vowel [A]; 2nd pulse [B]).
To examine whether and how the suppression process mediates stimulus locking of individual AI neurons, an additional single unit recording was made on 35 units (27 stimulus-locking units, 8 stimulusun- locking units) that showed an appreciable amount of spontaneous discharge for detecting suppression. In this session (namely, the “single-click paradigm”), a single pulse was presented 10-20 times at intervals > 4s. Figures 7A-D shows the responses of 4 representative single units: discharge occurrence was displayed as a raster dot (upper row) as well as a post-latency time histogram (bottom row).
Four temporal patterns were recognized: (1) only excitation (marked with red; namely, “E-alone” [A]), (2) excitation then suppression (marked with blue) (namely, “E-S sequence”); (3) excitation, suppression then excitation (“E-S-E sequence” [C]); (4) excitation, suppression, excitation then suppression (“E-S-E-S sequence” [D]). As summarized in Table (right column), all stimulusun- locking units exhibited the “E-alone” pattern; all the stimuluslocking units exhibited the remaining patterns, which in common contain both the 1st excitation and 1st suppression. This renders the idea that stimulus locking is mediated through temporal interplay between excitation and suppression.
Among stimulus-locking units, the band-pass temporal-MTF type exhibited the 2nd suppression (marked with asterisk) with a statistically significant higher ratio than the low-pass temporal-MTF type (Fisher’s exact test, P < 0.001). This may indicate that the presence of the 2nd suppression configures the temporal-MTF more likely band-pass.
Summary
A subset of AI neurons (i.e., stimulus-locking units) is capable of generating discharges with time locking to acoustic transients. The minimal interval between acoustic transients required to elicit a stimulus-locking responses is ~30 ms with level tolerance. These features support the idea that AI stimulus locking provides the basis for the temporal grain, which is manifested as the order threshold and VOT boundary. The capacity for stimulus locking is likely to be mediated through temporal interplay between excitation and suppression.
In Vitro Study: Post-Synaptic Potentials in the AI Neuron Evoked by Electrical Stimulation
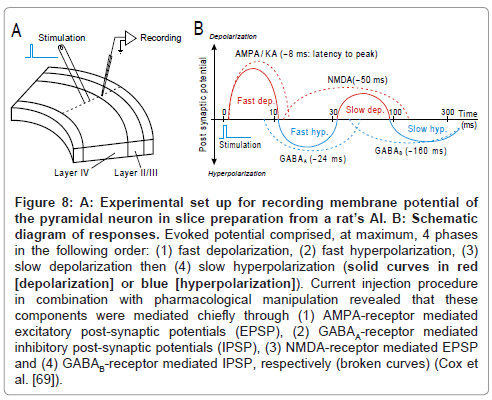
By applying in vivo intra-cellular recording technique to unanesthetized cat’s AI, de Ribaupierre and colleagues (1972) observed that the excitation and suppression of the stimulus-locking units are mediated chiefly through temporal interplay of depolarization and hyperpolarization, respectively. By employing patch-clamp technique on slice preparations from rat’s AI, Cox and colleagues [69] recorded the post-synaptic potentials of a pyramidal neuron (Figure 8A). As schematized in Figure 8B, an electrical pulse that was delivered to thalamocortical afferent fibers evoked, at maximum, 4 components in the following order: (1) fast depolarization, (2) fast hyperpolarization, (3) slow depolarization then (4) slow hyperpolarization (solid curves; red: depolarization; blue: hyperpolarization). Each component may roughly mediate the 1st excitation, 1st suppression, 2nd excitation then 2nd suppression, respectively. Current injection procedure in combination with pharmacological manipulation revealed that those components were mediated mostly through (1) AMPA-receptor mediated excitatory post-synaptic potentials (EPSP), (2) GABAA- receptor mediated inhibitory post-synaptic potentials (IPSP), (3) NMDA-receptor mediated EPSP and (4) GABAB-receptor mediated IPSP, respectively (broken curves). The net of these PSP components took a roughly similar time course to the E-S-E-S sequences of spike occurrence in vivo (Figure 7D). Such analogy inspires an idea that temporal interplay among EPSPs and IPSPs regulates the temporal behavior of the stimulus-locking unit.
Neurocomputational Model of Temporal Behavior of the Stimulus-Locking Unit
Temporal interplay between EPSPs and IPSPs: 4-receptor version model
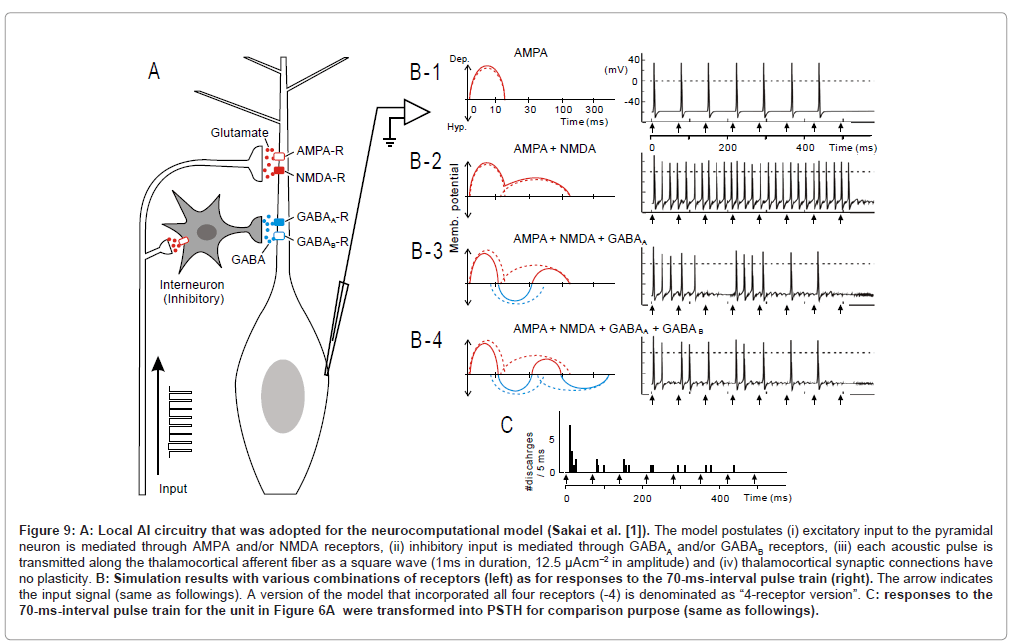
To verify the above idea, we developed a neurocomputational model [1]. As schematized in Figure 9A, the model postulates that (1) excitatory input to the AI neuron is mediated through AMPA and/or NMDA receptors, (2) inhibitory input is mediated through GABAA and/or GABAB receptors and (3) each acoustic signal is transmitted along the thalamocortical afferent fiber as a square wave.
Figure 8: A: Experimental set up for recording membrane potential of the pyramidal neuron in slice preparation from a rat’s AI. B: Schematic diagram of responses. Evoked potential comprised, at maximum, 4 phases in the following order: (1) fast depolarization, (2) fast hyperpolarization, (3) slow depolarization then (4) slow hyperpolarization (solid curves in red [depolarization] or blue [hyperpolarization]). Current injection procedure in combination with pharmacological manipulation revealed that these components were mediated chiefly through (1) AMPA-receptor mediated excitatory post-synaptic potentials (EPSP), (2) GABAA-receptor mediated inhibitory post-synaptic potentials (IPSP), (3) NMDA-receptor mediated EPSP and (4) GABAB-receptor mediated IPSP, respectively (broken curves) (Cox et al. [69]).
Figure 9: A: Local AI circuitry that was adopted for the neurocomputational model (Sakai et al. [1]). The model postulates (i) excitatory input to the pyramidal neuron is mediated through AMPA and/or NMDA receptors, (ii) inhibitory input is mediated through GABAA and/or GABAB receptors, (iii) each acoustic pulse is transmitted along the thalamocortical afferent fiber as a square wave (1ms in duration, 12.5 µAcm–2 in amplitude) and (iv) thalamocortical synaptic connections have no plasticity. B: Simulation results with various combinations of receptors (left) as for responses to the 70-ms-interval pulse train (right). The arrow indicates the input signal (same as followings). A version of the model that incorporated all four receptors (-4) is denominated as “4-receptor version”. C: responses to the 70-ms-interval pulse train for the unit in Figure 6A were transformed into PSTH for comparison purpose (same as followings).
Figures 9 B-1 to -4 (right) illustrate simulated responses at a 70- ms pulse interval, in which various combination of PSP components were incorporated (left). This interval corresponds to the mean value (73.7±18.9 ms) for eliciting the most potent stimulus locking (ex., Figure 6A-2, arrow). As a reference, the physiological observation at a 70-ms pulse interval was transformed into a peri-stimulus time histogram (Figure 9C).
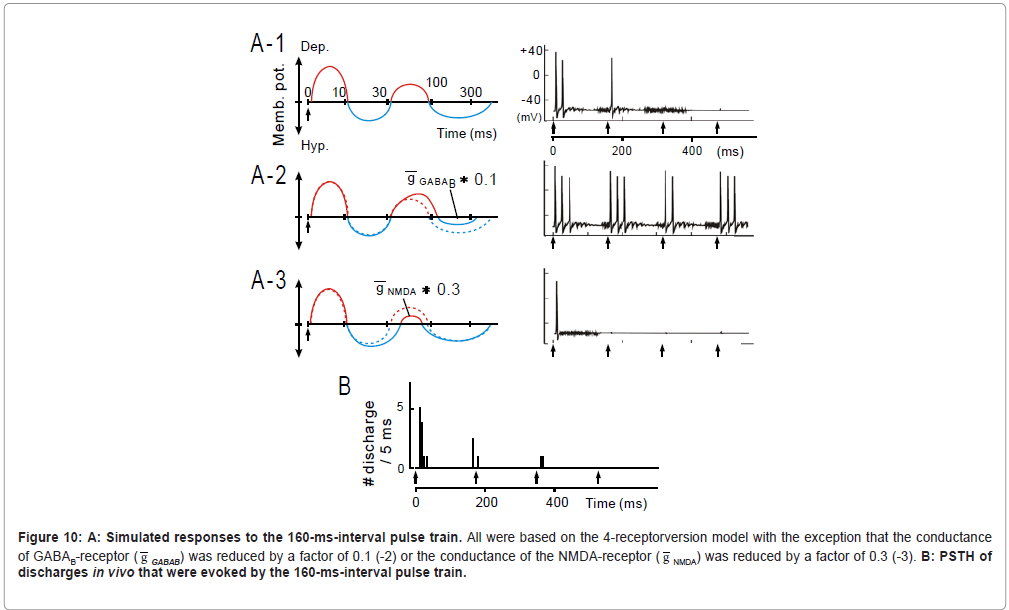
Figure 10: A: Simulated responses to the 160-ms-interval pulse train. All were based on the 4-receptorversion model with the exception that the conductance of GABAB-receptor ( g GABAB) was reduced by a factor of 0.1 (-2) or the conductance of the NMDA-receptor ( g NMDA) was reduced by a factor of 0.3 (-3). B: PSTH of discharges in vivo that were evoked by the 160-ms-interval pulse train.
In this model, if only AMPA receptors were incorporated (B-1), each pulse was predicted to faithfully evoke discharges. However, the robustness of onset response which was evident in the physiology data (C), was not clearly recognized in the model (B-1). If NMDA receptors were incorporated into the model (B-2), dischargers took place throughout the pulse train, obscuring stimulus locking. If GABAA receptors were further added to the model (B-3), both the robustness of onset response and stimulus locking became evident. While this feature, more or less, resembled the physiological observation(C), the former differed from the latter in that: (1) the 3rd stimulus did not evoke discharges and (2) the discharge clusters evoked by the 4th and 5th stimulus merged together. Such discrepancies were diminished when GABAB receptors were further added to the model (B-4; namely the “4-receptor version” model).
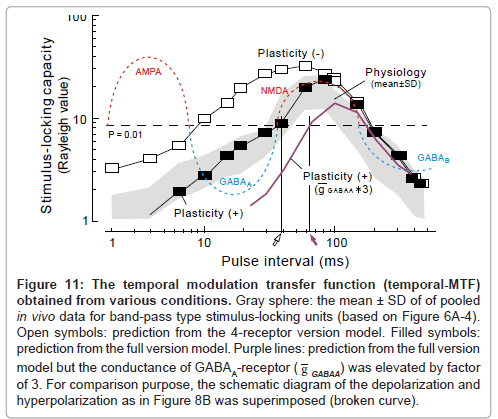
Figure 11: The temporal modulation transfer function (temporal-MTF) obtained from various conditions. Gray sphere: the mean ± SD of of pooled in vivo data for band-pass type stimulus-locking units (based on Figure 6A-4). Open symbols: prediction from the 4-receptor version model. Filled symbols: prediction from the full version model. Purple lines: prediction from the full version model but the conductance of GABAA-receptor ( g GABAA) was elevated by factor of 3. For comparison purpose, the schematic diagram of the depolarization and hyperpolarization as in Figure 8B was superimposed (broken curve).
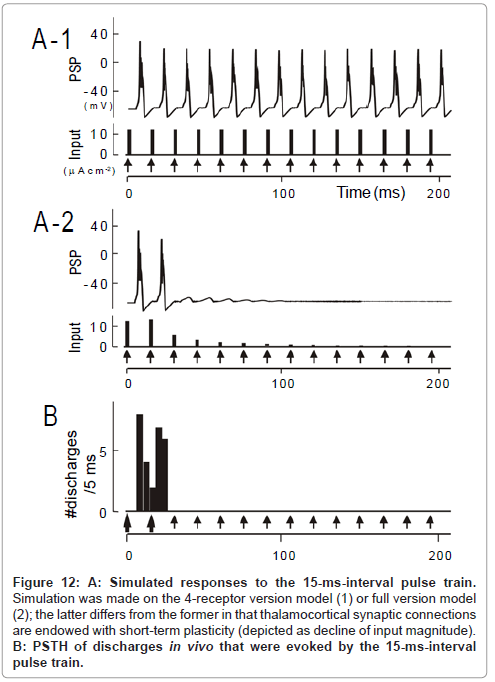
Figure 12: A: Simulated responses to the 15-ms-interval pulse train. Simulation was made on the 4-receptor version model (1) or full version model (2); the latter differs from the former in that thalamocortical synaptic connections are endowed with short-term plasticity (depicted as decline of input magnitude). B: PSTH of discharges in vivo that were evoked by the 15-ms-interval pulse train.
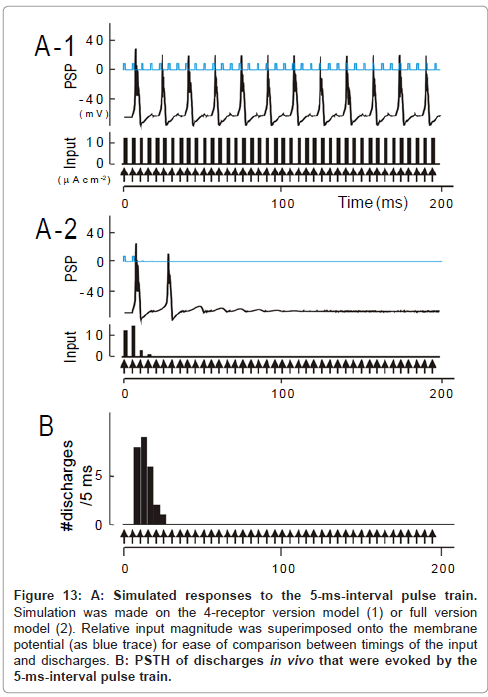
Figure 13: A: Simulated responses to the 5-ms-interval pulse train. Simulation was made on the 4-receptor version model (1) or full version model (2). Relative input magnitude was superimposed onto the membrane potential (as blue trace) for ease of comparison between timings of the input and discharges. B: PSTH of discharges in vivo that were evoked by the 5-ms-interval pulse train.
At 160-ms inter-pulse interval, as exemplified in Figure 10, the 4-receptor version model (A-1) well captured the physiological observation (B) (see later for A-2 to -4) .
The temporal MTF that was simulated based on the 4-receptor version model (filled squares, Figure 11) closely resembled the one obtained physiologically (gray sphere: mean ± SD) as long as the pulse interval was sufficiently long (> 50 ms).
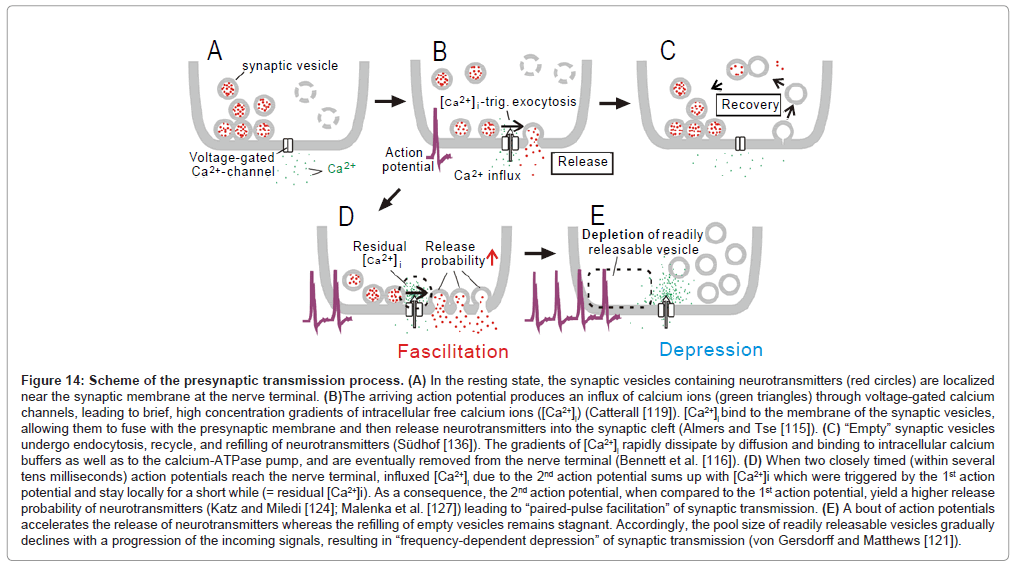
Figure 14: Scheme of the presynaptic transmission process. (A) In the resting state, the synaptic vesicles containing neurotransmitters (red circles) are localized near the synaptic membrane at the nerve terminal. (B)The arriving action potential produces an influx of calcium ions (green triangles) through voltage-gated calcium channels, leading to brief, high concentration gradients of intracellular free calcium ions ([Ca2+]i) (Catterall [119]). [Ca2+]i bind to the membrane of the synaptic vesicles, allowing them to fuse with the presynaptic membrane and then release neurotransmitters into the synaptic cleft (Almers and Tse [115]). (C) “Empty” synaptic vesicles undergo endocytosis, recycle, and refilling of neurotransmitters (Südhof [136]). The gradients of [Ca2+]i rapidly dissipate by diffusion and binding to intracellular calcium buffers as well as to the calcium-ATPase pump, and are eventually removed from the nerve terminal (Bennett et al. [116]). (D) When two closely timed (within several tens milliseconds) action potentials reach the nerve terminal, influxed [Ca2+]i due to the 2nd action potential sums up with [Ca2+]i which were triggered by the 1st action potential and stay locally for a short while (= residual [Ca2+]i). As a consequence, the 2nd action potential, when compared to the 1st action potential, yield a higher release probability of neurotransmitters (Katz and Miledi [124]; Malenka et al. [127]) leading to “paired-pulse facilitation” of synaptic transmission. (E) A bout of action potentials accelerates the release of neurotransmitters whereas the refilling of empty vesicles remains stagnant. Accordingly, the pool size of readily releasable vesicles gradually declines with a progression of the incoming signals, resulting in “frequency-dependent depression” of synaptic transmission (von Gersdorff and Matthews [121]).
Involvement of short-term plasticity
As a whole, the temporal-MTF made from the 4-receptor version model deviated to the left compared to the physiologically obtained one. This indicates that the model predicted an unrealistically potent stimulus locking at short intervals. For instance, for a 15-ms interval, simulated was the responses time-locked to each pulse (Figure 12A- 1); observed was the robust onset response followed by suppression (Figure 12B; region δ [transformed from Figure 6A-1]). At a 5-ms interval, predicted was the responses time-locked to every third pulses (Figure 13A-1); such skipping was scarcely encountered during physiology recording (Figure 13B). These discrepancies could not be resolved even though parameter values in the 4-receptor version model were manipulated within physiologically realistic ranges.
It has been widely accepted that the impact of preceding signals onto a given neuron accumulates as to plastically alter its responsiveness to the signals that follow. Such phenomenon, called “plasticity,” is omnipresent across the central nervous system, including the AI [70]. In the following, I show several piece of evidence suggesting that plasticity modifies the temporal behavior of the stimulus-locking units.
Frequency-dependent depression: Generally, the number of discharges evoked by individual pulses progressively declined with the progression of pulse trains (ex., at 70-ms interval (Figure 9C); 160- ms interval (Figure 10B); 15-ms interval (Figure 12B); 5-ms interval (Figure 13B)). Such tendencies became more conspicuous at shorter intervals and most manifested as an un-responsive period in the region δ (Figure 6A-1). Responsiveness returned to the control level by an interval of 4s after the termination of the stimulus train [1]. These features are all consistent with a kind of short-term plasticity, known as “frequency-dependent depression” [71].
A number of biophysical processes have been proposed as the basis of frequency-dependent depression (reviewed by Zucker and Regehr [70], Castro-Alamancos [72]). The most prominent one is temporal exhaustion of readily releasable vesicles at presynaptic terminals [71] (Figure 14E).
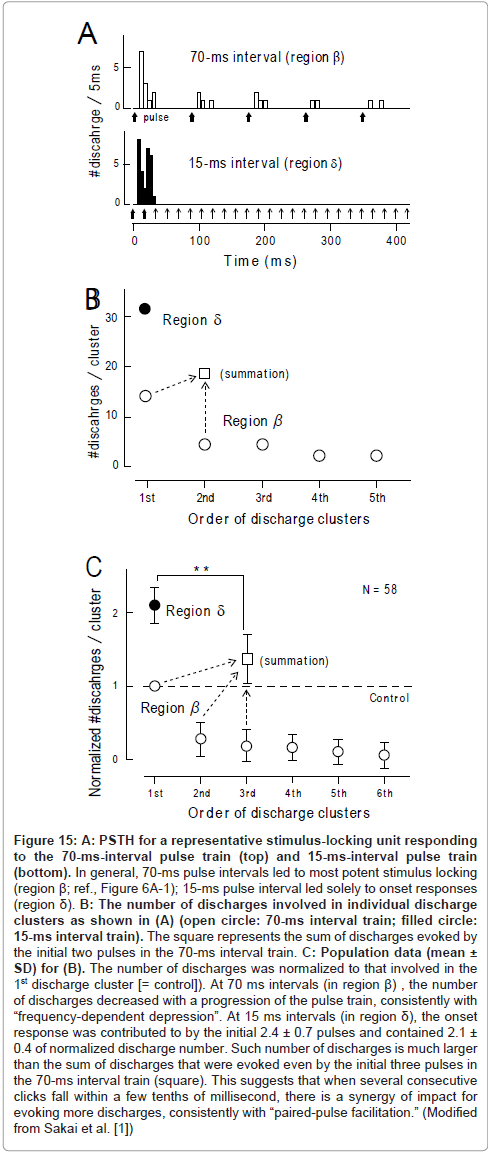
Paired-pulse facilitation: There were marked interval-dependent differences in (1) the number of acoustic pulses that contributed to the 1st discharge cluster and (2) the number of discharges in the 1st discharge cluster. As exemplified in Figure 15A (upper trace; same as Figure 9C), when the acoustic pulses were delivered with 70-ms intervals, the 1st pulse evoked the 1st discharge cluster, the 2nd pulse evoked the 2nddischarge cluster, and so forth. The 1st discharge cluster comprised 14 discharges (open circle, further left; Figure 15B), the 2nd discharge cluster comprised 5 discharges (open circle, 2nd), and so forth.
In contrast, at an interval of 15ms, the initial two pulses (bold arrows; lower trace, Figure 15A) worked in concert for evoking the 1st discharge cluster, which comprised 31 discharges (filled circle, Figure 15B). This number of discharges was much larger than the total amount of discharges which were evoked by the 1st and 2nd pulse at a 70ms interval (= 19; square, Figure 15B). Population data (Figure 15C) confirmed this finding. It is, thus, likely that when several consecutive signals fall within tens of milliseconds of each other, there is a synergy of impacts for evoking more discharges. Responsiveness returned to the control level by 4s after the termination of the stimulus train [1]. These features have many parallels with another kind of short-term plasticity, called “paired-pulse facilitation” [73]. Paired-pulse facilitation is thought to be caused chiefly by the residual elevation of the intracellular calcium concentration ([Ca 2+]i ) in presynaptic terminals [73,74] (Figure 14D).
Full-version model: We implemented two kinds of short-term plasticity (i.e., frequency-dependent depression and paired-pulse facilitation) to the “4-receptor version” model. This version model is called the “full version” model [1].
The prediction of the full version model differed from the 4-receptor version model in that (1) the unresponsive period became evident at the 15ms interval (cf., Figure 12A-2 to A-1)similarly to the physiological observation (Figure 12B) and (2) the same was true for the 5ms interval (cf., Figure 13A-2 to A-1 and C). On the other hand, both models predicted similar response features at longer intervals (data not shown; [1]). As clearly shown in Figure 11, the full version (filled squares) had more prediction power than the 4-receptor version (open squares), especially at short intervals (< 50 ms). This supports the idea that short-term plasticity of thalamocortical synaptic connections plays a larger role in stimulus locking at short intervals.
Ramification of the full-version model
Constraints on the shorter limiting pulse-interval for stimulus locking: It is noteworthy that the shorter limiting pulse-interval for stimulus locking (30-40 ms; open arrow, Figure 11) is akin to the transition point from the GABAA-receptor mediated IPSP (broken blue curve, left [adopted from Figure 8B]) and the NMDA-receptormediated EPSP (broken red curve, right). This value is compatible with the neurophysiology data on un-anesthetized animals [1,61-65] but rather shorter than the data (40-200 ms) on pentbarbiturateanesthetized animals [75-77].
One cannot attribute the effects of pentbarbiturate merely to changes in vigilance because, when the animals were anesthetized with ketamine, the limiting interval for stimulus locking remained at ~30 ms, which is similar to that of un-anesthetized animals. Because pentbarbiturate greatly potentates GABAA-receptor mediated IPSPs than ketamine [57,78], pentbarbiturate may produce a rightward shift of the transition point between GABAA-receptor mediated IPSP and NMDA-receptor-mediated EPSP. This may in turn lead to a prolongation of the shorter limiting interval for stimulus locking.
Expectedly, in the model when the conductance of GABAA- receptor ( g GABAA: 0.1 nS in original; [79] was elevated by factor of 3, the rising limb of the temporal-MTF (purple curve) shifted to the right thereby prolonging the shorter limiting interval for stimulus locking to ~60 ms (purple arrow).
Constraints on temporal-MTF shape (band-pass vs. low-pass): Given that the 2nd suppression was present in band-pass type units at a disproportionately higher probability than in low-pass type units (Table, right columns), it is intriguing that the 2nd suppression plays an important role in configuring the temporal-MTF shape. If so, the manipulation of activities of GABAB receptors or NMDA receptors will alter the temporal-MTF shape because the 2nd suppression is likely a subtraction product of the GABAB-receptor mediated IPSP by the NMDA-receptor mediated EPSP (Figure 8B).
When the conductance of GABAB receptors ( g GABAB: 1.0 nS; [80]) was reduced by a factor of 0.1 (Figure 10A-2, left), responsiveness to the initial several stimuli was enhanced, thereby promoting a “low-pass” effect (right). Contrariwise, when the conductance of NMDA receptors ( g NMDA: 0.38 nS; [81]) was reduced (Figure 10A-3, left), responsiveness to the 2nd and latter stimuli profoundly degraded, promoting a “lowcut” effect (right). These findings support the hypothesis that the temporal-MTF shape is configured by balance between the GABAB- receptor mediated IPSP and the NMDA-receptor mediated EPSP: if the former dominates, the temporal-MTF tends to be more band-pass; if the latter dominates, the temporal-MTF to be more low-pass.
Summary
Temporal behavior of the AI stimulus locking units was well captured by our computational model which incorporated (1) AMPAreceptor- mediated EPSP, (2) GABAA-receptor-mediated IPSP, (3) NMDA-receptor-mediated EPSP, and (4) GABAB-receptor-mediated IPSP along with (5) short-term plasticity of the thalamocortical synaptic connections. In addition, the model raised the possibility that the relative strength of these neural elements constrain temporal filter shape.
Figure 15:A: PSTH for a representative stimulus-locking unit responding to the 70-ms-interval pulse train (top) and 15-ms-interval pulse train (bottom). In general, 70-ms pulse intervals led to most potent stimulus locking (region ß; ref., Figure 6A-1); 15-ms pulse interval led solely to onset responses (region d). B: The number of discharges involved in individual discharge clusters as shown in (A) (open circle: 70-ms interval train; filled circle: 15-ms interval train). The square represents the sum of discharges evoked by the initial two pulses in the 70-ms interval train. C: Population data (mean ± SD) for (B). The number of discharges was normalized to that involved in the 1st discharge cluster [= control]). At 70 ms intervals (in region ß) , the number of discharges decreased with a progression of the pulse train, consistently with “frequency-dependent depression”. At 15 ms intervals (in region d), the onset response was contributed to by the initial 2.4 ± 0.7 pulses and contained 2.1 ± 0.4 of normalized discharge number. Such number of discharges is much larger than the sum of discharges that were evoked even by the initial three pulses in the 70-ms interval train (square). This suggests that when several consecutive clicks fall within a few tenths of millisecond, there is a synergy of impact for evoking more discharges, consistently with “paired-pulse facilitation.” (Modified from Sakai et al. [1])
Implications for Clinics
Here I discuss ramifications of the above described findings, which in my belief provide a framework to study neural mechanisms underlying language impairment.
Relevance to specific language impairment (SLI)
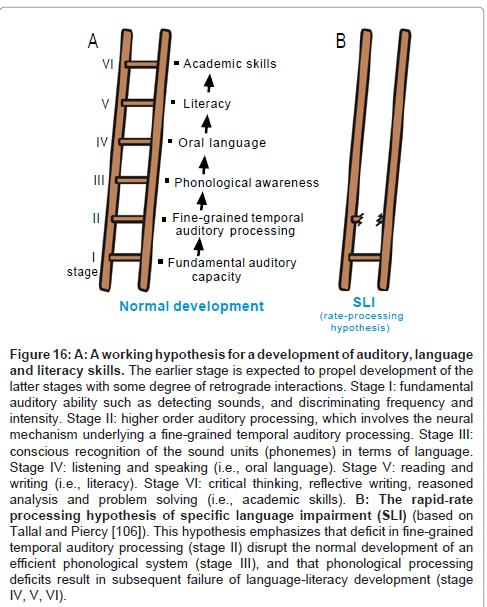
Figure 16A schematizes a working hypothesis for a development of language functions, which is based on the claims that (1) normal auditory function is necessary for normal development of oral language (i.e., listening and speaking) and (2) oral language and literacy skills (i.e., reading and writing) develop in a cascade with bidirectional interactions [82-85]. Specifically, stage I corresponds to fundamental auditory capacity including sound detection, frequency discrimination and loudness discrimination [86]. Stage II corresponds to higher order auditory processing whereby acoustic information is summated or segmented across a spectral/temporal axis. The 20-40 ms temporal grain (see above) is considered to be a typical manifestation of this stage. The outcome of this stage can be utilized by the acoustic center of speech to realize “phonological awareness” (stage III), i.e., conscious understanding of the sound units in a language (phonemes), which promotes the ability to listen to, recognize, and manipulate the sound that make up a language [87,88]. Enhancement of phonological awareness as well as other language subsystems (ex., morphology, syntax, semantics and pragmatics skills; see comment2) is expected to propel the development of oral language (stage IV) [89,90]. Oral language provides a basis for the development of literacy (stage V) [91,92], i.e., the ability to read for knowledge and write coherently [83]. Literacy has a direct impact on academic skills such as critical thinking, reflective writing, reasoned analysis and problem solving [93].
Figure 16:A: A working hypothesis for a development of auditory, language and literacy skills. The earlier stage is expected to propel development of the latter stages with some degree of retrograde interactions. Stage I: fundamental auditory ability such as detecting sounds, and discriminating frequency and intensity. Stage II: higher order auditory processing, which involves the neural mechanism underlying a fine-grained temporal auditory processing. Stage III: conscious recognition of the sound units (phonemes) in terms of language. Stage IV: listening and speaking (i.e., oral language). Stage V: reading and writing (i.e., literacy). Stage VI: critical thinking, reflective writing, reasoned analysis and problem solving (i.e., academic skills). B: The rapid-rate processing hypothesis of specific language impairment (SLI) (based on Tallal and Piercy [106]). This hypothesis emphasizes that deficit in fine-grained temporal auditory processing (stage II) disrupt the normal development of an efficient phonological system (stage III), and that phonological processing deficits result in subsequent failure of language-literacy development (stage IV, V, VI).
This scheme, in my belief, can be of use to capture some aspect of “specific language impairment (SLI)”. SLI is diagnosed when a child’s language does not develop normally in the absence of any apparent handicapping conditions including deafness, autism, mental retardation or severe environmental deprivation [94,95]. Epidemiological surveys, in the US [96,97] and Canada [98], estimated that the prevalence of SLI of children under the age of 6-7 old to be approximately 5-10 %. A growing body of research has pointed to the possibility that SLI is a heterogeneous syndrome rather than a single entity, encompassing distinct clinical profiles that may reflect distinct underlying deficits [95,99]. There appear to be two broad competing theoretical perspectives about the nature of SLI. One perspective posits that the core deficit is specific to the domain of language (stage III-V), especially phonological awareness, morphology and/or syntax skills which work in concert to mediate grammatical rules [94,95,100].
Another perspective posits that SLI is essentially derived from disorders of non-linguistic processes such as auditory perception [101], working memory [102], attention [103], processing rate [104], motor acuity [105] etc. This helps to account for some of the breadth of linguistic and non-linguistic deficits observed in SLI. For example, many young children with SLI are less able to process brief, rapidly successive signals (on the order of tens of milliseconds) regardless of whether the signals are phonetic or non-phonetic [101,106,107]. To this end, Tallal et al. [108] proposed the “rate-processing constraint hypothesis” to account for some aspect of SLI: deficit in fine-grained temporal auditory processing (stage II) is a bottle neck of languageliteracy development (stage III-V).
As described, it is very likely that fine-grained temporal auditory processing is contributed to by AI stimulus locking. Our neurocomputational model makes it likely that AI stimulus locking is mediated chiefly through temporal interplay among EPSPs and IPSPs along with short-term plasticity (Figures 8B and 9A). This model predicts that the enhancement of GABAA-receptor activities causes a reduction of AI’s capacity for stimulus locking (purple line, Figure 11). This may, in turn, hamper fine-grained temporal auditory processing. Given Tallal’s rate-processing constraint hypothesis, if a young child is chronically exposed to such biochemical compounds as to selectively enhance GABAA-receptor activities or reduce NMDA-receptor activities, the child’s language-literacy abilities would not be expected to develop normally. This conjecture, at present, has not been verified experimentally. In the future, this should be addressed by clinical examination if possible, supplemented by pharmaco-behavioral experiments on animals.
Tolerance of speech intelligibility against reverberation
The majority of the synchronization units (i.e., band-pass type) exhibited “low-cut” effects in temporal filtering (Table). Our neurophysiology result implies such a property is related to the 2nd suppression, which is dominant ~100-300 ms after the stimulus onset (Figure 7D). Our neurocomputational model indicates the correspondence of this timing to the transition of dominance from NMDA-receptor-mediated EPSP to GABAB-receptor-mediated IPSP (Figure 8B). Of note, this timing corresponds to the rates (3-10 Hz) of both (1) an articulation gesture associated with the syllable [109] and (2) the temporal envelope on which speech intelligibility is most efficient [110,111]. Drullman et al. [112] found that speech intelligibility was considerably hindered when the temporal envelope was artificially low-pass filtered below 4 Hz (≥ 250 ms in interval) and suggested that such effect was mainly due to blurring of the temporal contrast between successive syllables. Houtgast and Steeneken [110] found that, within commonly encountered reverberant environments, acoustic reflections exert aversive effects mostly at 2-6 Hz in temporalmodulation rate. Reverberant sounds are intermingled with the original signal, causing a reduction in temporal envelope depth and shifting the distribution peak of the temporal-modulation rate toward 1-2 Hz. If such effects are not too severe, speech sounds are still intelligible with somewhat distorted perceptual quality. If they are too severe, there is a drastic decline in intelligibility. Presumably, the “low-cut” effect in band-pass type units is of great use for the improvement of speech intelligibility with buffering against reverberation. Taken together, it is possible that an alteration of the balance between NMDA receptors and GABAB receptors interfere with speech intelligibility in reverberant environments.
Ending remark
I discussed ramifications from the findings of the stimuluslooking AI units in relation to language impairment. The above conjectures have not yet been substantiated and, thus, are amenable to future clinical verification, supplemented by animal studies. To-beobtained findings would shed insight on our understanding of neural mechanisms underlying language impairment, point to a risk factor of a specific deficit, and consequently lead to new therapies.
Conclusion
The perceived quality of successive acoustic signals drastically alters at the boundary of the 20-40 ms interval. This phenomenon can be explained by the concept of the “temporal grain” with a 20-40 ms time frame. Results from clinical observations and neurophysiology recordings converge to indicate that such temporal grain is based on a category-like temporal behavior of a subset of AI neurons, i.e., stimulus locking units. Temporal behavior of those neurons was well captured by our neurocomputational model which incorporates temporal interplay between EPSPs and IPSPs along with short-term plasticity. The present article, in my belief, may provide useful clues in search for the neural basis of language impairment.
1Place of articulation is referred to as the locus of closure in the vocal tract. In English, three sets of place-of-articulation are involved in the production of plosive consonant-vowel syllables [20]: (1) upper and lower lips (holistically called “bilabials”; VOT boundary at ~20 ms) for producing /b/ or /p/; (2) alveolar ridge and tongue tip (“alveolars” [Figure 3A]; ~30 ms) for /d/ or /t/; (3) tongue blade and soft plate (“velars”; ~40 ms) for /g/ or /k/.
Figure 3: A: Schematized waveform of plosive consonant-vowel (CV) syllables, /da/ or /ta/, and midsaggital configuration of the vocal tract during articulation. The signal comprises several physical hallmarks reflecting distinct articulation processes: Closure, Consonant release, Voicing and Voice onset time (VOT). Closure: the airway is closed by a set of articulators (alveolar ridge and tongue tip, in this case) so that no air can escape, thereby raising air pressure behind the articulators. Consonant release: downward movement of the tongue tip creates a narrow crevice, through which air explosively passes with generating brief turbulence noise (blue arrow). Voicing: the configuration of the glottis and the stiffness of the vocal folds are adjusted to permit continued vocal-folds vibration, which creates a vowel (red arrow). “Voice onset time (VOT)” is referred to as the interval between the onset of Consonant release and that of Voicing (Based on Stevens [20]). B: The mean performance of native English speakers in psychoacoustic experiments using /da/-/ta/ syllables with variable VOT. The ordinate gives the mean percentage of identifying /ta/. The abscissa gives VOT. The red line represents the “VOT boundary” where this psychometric function curve crosses the chance level (= 50%) (Modified from Lisker and Abramson [47]).
2Morphology deals with the smallest meaningful unit in the grammar of a language “morphemes” (ex., “im-” for negation, “-ed” for past, or “-(e)s” for plural in English). Syntax does the rules for putting together a series of words to form phrases, clauses and sentences. Semantics does the meaning of words and sentence. Pragmatics does the usage of language in a social context [87,113].
References
- Sakai M, Chimoto S, Qin L, Sato Y (2009) Neural mechanisms of interstimulus interval-dependent responses in the primary auditory cortex of awake cats. BMC Neurosci 10: 10.
- Näätänen R, Winkler I (1999) The concept of auditory stimulus representation in cognitive neuroscience. Psychol Bull 125: 826-859.
- Warren RM, Bashford JA Jr (1981) Perception of acoustic iterance: pitch and infrapitch. Percept Psychophys 29: 395-402.
- Ritsma RJ (1962) Existence Region of the Tonal Residue. I. J Acoust Soc Am 34: 1224-1229.
- Guttman N, Pruzansky S (1962) Lower limits of pitch and musical pitch. J Speech Lang Hear Res 5: 207-214.
- Terhardt E (1974) On the perception of periodic sound fluctuations (roughness). Acustica 30: 201-213.
- Zwislocki J (1960) Theory of Temporal Auditory Summation. J Acoust Soc Am 32: 1046-1060.
- Moore BC, Glasberg BR, Plack CJ, Biswas AK (1988) The shape of the ear's temporal window. J Acoust Soc Am83: 1102-1116.
- deBoer E (1985) Auditory time constants: a paradox? In: Time resolution in auditory systems (Michelsen A, ed), pp.141–158. Berlin: Springer.
- Elhilali M, Fritz JB, Klein DJ, Simon JZ, Shamma SA (2004) Dynamics of Precise Spike Timing in Primary Auditory Cortex. J Neurosci 24: 1159-1172.
- Hirsh IJ (1959) Auditory perception of temporal order. J Acoust Soc Am 31: 759-767.
- HIRSH IJ, SHERRICK CE Jr (1961) Perceived order in different sense modalities. J Exp Psychol 62: 423-432.
- Lieberman AM, Cooper FS, Shankweiler DP, Studdert-Kennedy M (1967) Perception of the speech code. Psychol Rev 74: 431-461.
- Lisker L, Abramson AS (1964) A Cross-Language Study of Voicing in Initial Stops: Acoustical Measurements. Word 20: 384-422.
- Studdert-Kennedy M, Liberman AM, Harris KS, Cooper FS (1970) Theoretical notes. Motor theory of speech perception: a reply to Lane's critical review. Psychol Rev 77: 234-249.
- Kuhl PK, Padden DM (1982) Enhanced discriminability at the phonetic boundaries for the voicing feature in macaques. Percept Psychophys 32: 542-550.
- Kuhl PK, Miller JD (1978) Speech perception by the chinchilla: identification function for synthetic VOT stimuli. J Acoust Soc Am 63: 905-917.
- Dooling RJ, Okanoya K, Brown SD (1989) Speech perception by budgerigars (Melopsittacus undulatus): the voiced-voiceless distinction. Percept Psychophys 46: 65-71.
- Mendez MF, Geehan GR Jr (1988) Cortical auditory disorders: clinical and psychoacoustic features. J Neurol Neurosurg Psychiatry 51: 1-9.
- Miceli G (1982) The processing of speech sounds in a patient with cortical auditory disorder. Neuropsychologia 20: 5-20.
- Saffran EM, Marin OS, Yeni-Komshian GH (1976) An analysis of speech perception in word deafness. Brain Lang 3: 209-228.
- Stockert TR (1982) On the structure of word deafness and mechanisms underlying the fluctuation of disturbances of higher cortical functions. Brain Lang 16: 133-146.
- Yaqub BA, Gascon GG, AI-Nosha M, Whitaker H (1988) Pure word deafness (acquired verbal auditory agnosia) in an Arabic speaking patient. Brain 111: 457-466.
- Stevens KN (1980) Acoustic correlates of some phonetic categories. J Acoust Soc Am 68: 836-842.
- Kurowski K, Blumstein SE (1987) Acoustic properties for place of articulation in nasal consonants. J Acoust Soc Am 81: 1917-1927.
- Rosen S (1992) Temporal information in speech: acoustic, auditory and linguistic aspects. Philos Trans R Soc Lond B Biol Sci 336: 367-373.
- Brugge IF (1975) Progress in neuroanatomy and neurophysiology of auditory cortex. In D. B. Tower (Ed.), The Nervous System. Vol. 3. Human Communication and Its Disorders (pp. 97-111). New York: Raven Press.
- (1985) Pure word deafness: CT localization of the pathology. Neurology 35: 441-442.
- Kussmaul A (1877) Disturbances of speech. In H. von Ziemssen (Ed.), Cyclopedia of the Practice of Medicine (pp. 581-875). New York: William Wood Press.
- Hemphill RE , Stengel E (1940) A STUDY ON PURE WORD-DEAFNESS. J Neurol Psychiatry 3: 251-262.
- Auerbach SH, Allard T, Naeser M, Alexander MP, Albert ML (1982) Pure word deafness. Analysis of a case with bilateral lesions and a defect at the prephonemic level. Brain 105: 271-300.
- Heffner HE, Heffner RS (1989) Effect of restricted cortical lesions on absolute thresholds and aphasia-like deficits in Japanese macaques. Behav Neurosci 103: 158-169.
- Diamond IT & Neff WD (1957) Ablation of temporal cortex and discrimination of auditory patterns. J Neurophysiol 20: 300-315.
- Jerison HJ, Neff WD (1953) Effect of cortical ablation in the monkey on discrimination of auditory patterns. Fed Proc 12: 237.
- Symmes D (1966) Discrimination of intermittent noise by macaques following lesions of the temporal lobe. Exp Neurol 16: 201-214.
- Grigor'eva TI, Figurina II, Vasil’ev AG (1988) Role of the geniculate body in performing conditioned reflexes to amplitude-modulated stimuli in the rat. Zh Vyssh Nerv Deiat Im I P Pavlova 37: 265-271.
- Ison JR, O’Connor K, Bowen GP, Bocirnea A (1991) Temporal resolution of gaps in noise by the rat is lost with functional decortication. Behav Neurosci 105: 33-40.
- Kavanagh GL, Kelly JB (1988) Hearing in the ferret (Mustela putorius): effects of primary auditory cortical lesions on thresholds for pure tone detection. J Neurophysiol 60: 879-888.
- Kryter KD, Ades HW (1943) Studies of the function of higher acoustic nervous centers in the cat. Am J Psychol 56: 501-536.
- Meyer DR, Woolsey CN (1952) Effects of localized cortical destruction on auditory discriminative conditioning in cat. J Neurophysiol 15: 149-162.
- Cranford JL, Igarashi M, Stramler JH (1976) Effect of auditory neocortex ablation on pitch perception in the cat. J Neurophysiol 39: 143-152.
- Steinschneider M, Schroeder CE, Arezzo JC, Vaughan HG Jr (1995) Physiologic correlates of the voice onset time boundary in primary auditory cortex (A1) of the awake monkey: temporal response patterns. Brain Lang 48: 326-340.
- Galaburda AM, Pandya DN (1983) The intrinsic architectonic and connectional organization of the superior temporal region of the rhesus monkey. J Comp Neurol 221: 169-184.
- Lisker L, Abramson AS (1970) The voicing dimension: some experiments in comparative phonetics. Proceedings of the 6th International Congress of Phonetic Sciences 563: 563-567.
- Eggermont JJ (1995) Representation of a voice onset time continuum in primary auditory cortex of the cat. J Acoust Soc Am 98: 911-920.
- Eggermont JJ (1995) Neural correlates of gap detection and auditory fusion in cat auditory cortex. Neuroreport 6: 1645-1648.
- Eggermont JJ (1999) Neural correlates of gap detection in three auditory cortical fields in the cat. J Neurophysiol 81: 2570-2581.
- McGee T, Kraus N, King C, Nicol T, Carrell TD (1996) Acoustic elements of speech like stimuli are reflected in surface recorded responses over the guinea pig temporal lobe. J Acoust Soc Am 99: 3606-3614.
- Liégeois-Chauvel C, de Graaf JB, Laguitton V, Chauvel P (1999) Specialization of left auditory cortex for speech perception in man depends on temporal coding. Cereb Cortex 9: 484-496.
- Steinschneider M, Volkov IO, Noh MD, Garell PC, Howard MA 3rd (1999) Temporal encoding of the voice onset time phonetic parameter by field potentials recorded directly from human auditory cortex. J Neurophysiol 82: 2346-2357.
- Joliot M, Ribary U, Llinás R (1994) Human oscillatory brain activity near 40Hz coexists with cognitive temporal binding. Proc Natl Acad Sci U S A 91: 11748-11751.
- Ahissar E, Nagarajan S, Ahissar M, Protopapas A, Mahncke H, et al. (2001) Speech comprehension is correlated with temporal response patterns recorded from auditory cortex. Proc Natl Acad Sci U S A 98: 13367-13372.
- Tomita M, Noreña A, Eggermont JJ (2004) Effects of an acute acoustic trauma on the representation of a voice onset time continuum in cat primary auditory cortex. Hear Res 193: 39-50.
- Franks NP, Lieb WR (1994) Molecular and cellular mechanisms of general anaesthesia. Nature 367: 607-614.
- Zurita P, Villa AE, de Ribaupierre Y, de Ribaupierre F, Rouiller EM (1994) Changes of single unit activity in the cat's auditory thalamus and cortex associated to different anesthetic conditions. Neurosci Res 19: 303-316.
- Edeline JM, Dutrieux G, Manunta Y, Hennevin E (2001) Diversity of receptive field changes in auditory cortex during natural sleep. Eur J Neurosci 14: 1865-1880.
- Goldberg JM, Brown PB (1969) Response of binaural neurons of dog superior olivary complex to dichotic tonal stimuli: some physiological mechanisms of sound localization. J Neurophysiol 32: 613-636.
- Miller LM, EscabàMA, Read HL, Schreiner CE (2001) Functional convergence of response properties in the auditory thalamocortical system. Neuron 32: 151-160.
- Bieser A, Müller-Preuss P (1996) Auditory responsive cortex in the squirrel monkey: neural responses to amplitude-modulated sounds. Exp Brain Res 108: 273-284.
- Lu T, Liang L, Wang X (2001) Temporal and rate representations of time-varying signals in the auditory cortex of awake primates. Nat Neurosci 4: 1131-1138.
- Liang L, Lu T, Wang X (2002) Neural representations of sinusoidal amplitude and frequency modulations in the primary auditory cortex of awake primates. J Neurophysiol 87: 2237–2261.
- Sakai M, Chimoto S, Qin L, Sato Y (2009) Differential representation of spectral and temporal information by primary auditory cortex neurons in awake cats: relevance to auditory scene analysis. Brain Res 1265: 80-92.
- Ehret G (1987) Categorical perception of sound signals: Facts and hypotheses from animal studies. In S. Harnad (Ed.), Categorical Perception (pp. 301-331). Cambridge, UK: Cambridge University Press.
- Eggermont JJ (1991) Rate and synchronization measures of periodicity coding in cat primary auditory cortex. Hear Res 56: 153-167.
- Joris PX, Schreiner CE, Rees A (2004) Neural processing of amplitude-modulated sounds. Physiol Rev 84: 541-577.
- Cox CL, Metherate R, Weinberger NM, Ashe JH (1992) Synaptic potentials and effects of amino acid antagonists in the auditory cortex. Brain Res Bull 28: 401-410.
- Zucker RS, Regehr WG (2002) Short-term synaptic plasticity. Annu Rev Physiol 64: 355-405.
- Galarreta M, Hestrin S (1998) Frequency-dependent synaptic depression and the balance of excitation and inhibition in the neocortex. Nat Neurosci 1: 587–594.
- Castro-Alamancos MA (1997) Short-term plasticity in thalamocortical pathways: cellular mechanisms and functional roles. Rev Neurosci 8: 95-116.
- Kamiya H, Zucker RS (1994) Residual Ca2+ and short-term synaptic plasticity. Nature 371: 603–606.
- Kretz R, Shapiro E, Kandel ER (1982) Post-tetanic potentiation at an identified synapse in Aplysia is correlated with a Ca2+-activated K+ current in the presynaptic neuron: evidence for Ca2+ accumulation. Proc Natl Acad Sci U S A 79: 5430–5434.
- Brosch M, Schreiner CE (1997) Time course of forward masking tuning curves in cat primary auditory cortex. J Neurophysiol 77: 923-943.
- Reale RA, Brugge JF (2000) Directional sensitivity of neurons in the primary auditory (AI) cortex of the cat to successive sounds ordered in time and space. J Neurophysiol 84: 435-450.
- Nakamoto KT, Zhang J, Kitzes LM (2006) Temporal nonlinearity during recovery from sequential inhibition by neurons in the cat primary auditory cortex. J Neurophysiol 95: 1897-1907.
- Cotman CW, Monaghan DT (1987) Chemistry and anatomy of excitatory amino acid systems. In: Meltzer, HY, editor. Psychopharmacology: The Third Generation of Progress. New York: Raven Press, pp. 451–457.
- Wang XJ, Buzsáki G (1996) Gamma oscillation by synaptic inhibition in a hippocampal interneuronal network model. J Neurosci 16: 6402–6413.
- Otis TS, Mody I (1992) Differential activation of GABAA and GABAB receptors by spontaneously released transmitter. J Neurophysiol 67: 227-235.
- Jonas P, Spruston N (1994) Mechanisms shaping glutamate-mediated excitatory postsynaptic currents in the CNS. Curr Opin Neurobiol 4: 366–372.
- Mattingly IG (1972) Reading, the linguistic process, and linguistic awareness. In J. Kavanagh & I. Mattingly (Eds.), Language by ear and by eye: The relationships between speech and reading. Cambridge, MA: MIT Press.
- Wagner RK, Torgesen JK, Rashotte CA (1994) Development of young reader's phonological processing abilities: New evidence in bi-directional causality from a latent variable longitudinal study. Devel Psychol 30: 73-87.
- Caravolas M, Bruck M (1993) The effect of oral and written language input on children's phonological awareness: A cross-linguistic study. J Exp Child Psychol 55: 1-30.
- Saunders AZ, Stein AV, Shuster NL (1990) Audiometry. In: Walker HK, Hall WD, Hurst JW, editors. Clinical Methods: The History, Physical, and Laboratory Examinations. 3rd edition. Boston: Butterworths; 1990. Chapter 133.
- Wagner RK, Torgeson JK (1987) The nature of phonological processing and its causal role in the acquisition of reading skills. Psychol Bull 101: 192-212.
- Adams MJ, Foorman BR, Lundberg I, Beeler T (1998) Phonemic Awareness in Young Children: A Classroom Curriculum. Baltimore, MD: Paul H. Brookes.
- Nittrouer S (1996) The relation between speech perception and phonemic awareness: Evidence from low-SES children and children with chronic OM. J Speech Hear Res 39: 1059–1070.
- Law J, Garrett Z, Nye C (2004) The efficacy of treatment for children with developmental speech and language delay/disorder: a meta-analysis. J Speech Lang Hear Res 47: 924-943.
- Stothard SE, Snowling MJ, Bishop DV, Chipchase BB, Kaplan CA (1998) Language impaired preschoolers: A follow-up into adolescence. J Speech Lang Hear Res 41: 407–418.
- Catts HW, Fey ME, Tomblin JB, Zhang X (2002) A longitudinal investigation of reading outcomes in children with language impairments. J Speech Lang Hear Res 45: 1142-1157.
- Adams MJ (1990) Beginning to Read: Thinking and Learning About Print. Cambridge, MA: MIT Press.
- Bishop DV (1992) The underlying nature of specific language impairment. J Child Psychol Psychiatry 33: 3-66.
- Leonard LB (1998) Children with specific language impairment. Cambridge, MA: MIT Press.
- Tomblin JB, Records NL, Buckwalter P, Zhang X, Smith E, et al. (1997) Prevalence of specific language impairment in kindergarten children. J Speech Lang Hear Res 40: 1245-1260.
- Shriberg LD, Tomblin JB, McSweeny JL (1999) Prevalence of speech delay in 6-year-old children and comorbidity with language impairment. J Speech Lang Hear Res 42: 1461–1481.
- Johnson CJ, Beitchman JH, Young A, Escobar M, Atkinson L, et al. (1999) Fourteen year follow-up of children with and without speech/language impairment. J Speech Lang Hear Res 42: 744-760.
- Joanisse MF, Seidenberg MS (1998) Specific language impairment: a deficit in grammar or processing? Trends Cogn Sci 2: 240-247.
- Rice ML, Wexler K (1996) A phenotype of specific language impairment: extended optional infinitives, in towards a genetics of language (Rice, M.L., ed.), 215–237. New York: Erlbaum.
- Elliott LL, Hammer MA, Scholl ME (1989) Fine-grained auditory discrimination in normal children and children with language-learning problems. J Speech Hear Res 32: 112–119.
- Gathercole SE, Baddeley AD (1990) Phonological memory deficits in language disordered children: Is there a causal connection? J Mem Lang 29: 336–360.
- Finneran DA, Francis AL, Leonard LB (2009) Sustained attention in children with specific language impairment (SLI). J Speech Lang Hear Res 52: 915-929.
- Kail R (1994) A method for studying the generalized slowing hypothesis in children with specific language impairment. J Speech Hear Res 37: 418-421.
- Vargha-Khadem F, Watkins K, Alcock K, Fletcher P, Passingham R (1995) Praxic and non-verbal cognitive deficits in a large family with a genetically transmitted speech and language disorder. Proc Natl Acad Sci U S A 92: 930–933.
- Tallal P, Piercy M (1973) Defects of non-verbal auditory perception in children with developmental aphasia. Nature 241: 468–469.
- Kraus N, McGee TJ, Carrell TD, Zecker SG, Nicol TG, et al. (1996) Auditory neurophysiologic responses and discrimination deficits in children with learning problems. Science 273: 971–973.
- Tallal P, Miller S, Fitch RH (1993) Neurobiological Basis of Speech: A case for the Preeminence of Temporal Processing. Ann N Y Acad Sci 682: 27-47.
- Hoequist Jr C (1983) Syllable Duration in Stress-, Syllable- and Mora-Timed Languages. Phonetica 40: 203-237.
- Houtgast T, Steeneken HJM (1985) A review of the MTF concept in room acoustics and its use for estimating speech intelligibility in auditoria. J Acoust Soc Am 77: 1069–1077.
- Greenberg S, Arai T (2004) What are the essential cues for understanding spoken language? IEICE Trans Inf & Syst E87-D: 1059-1070.
- Drullman R, Festen JM, Plomp R (1994) Effect of temporal envelope smearing on speech reception. J Acoust Soc Am 95: 1053–1064.
- Ottenheimer HJ (2006) The Anthropology of Language: An Introduction to Linguistic Anthropology. Canada: Thomas Wadsworth.
- Albert ML, Bear D (1974) Time to understand. A case study of word deafness with reference to the role of time in auditory comprehension. Brain 97: 373–384.
- Almers W, Tse FW (1990) Transmitter release from synapses: does a preassembled fusion pore initiate exocytosis? Neuron 4: 813-818.
- Bennett MR, Farnell L, Gibson WG (2000) The probability of quantal secretion near a single calcium channel of an active zone. Biophys J 78: 2201–2221.
- Bishop DV, McArthur GM (2005) Individual differences in auditory processing in specific language impairment: a follow-up study using event-related potentials and behavioural thresholds. Cortex 41: 327-341.
- Bishop DV (1994) Is specific language impairment a valid diagnostic category? Genetic and psycholinguistic evidence. Philos Trans R Soc Lond B Biol Sci 346: 105-111.
- Catterall WA (2011) Voltage-gated calcium channels. Cold Spring Harb Perspect Biol 3: a003947.
- Czapinski P, Blaszczyk B, Czuczwar SJ (2005) Mechanisms of action of antiepileptic drugs. Curr Top Med Chem 5: 3-14.
- von Gersdorff H, Matthews G (1997) Depletion and replenishment of vesicle pools at a ribbon-type synaptic terminal. J Neurosci 17: 1919–1927.
- Cathy G, Shari H, Julie S (2011) Right from the start: a rationale for embedding academic literacy skills in university Courses. J Univ Teach & Learn Practice 8: article 6.
- Hansel D, Mato G (2003) Asynchronous states and the emergence of synchrony in large networks of interacting excitatory and inhibitory neurons. Neural Comput 15: 1–56.
- Katz B, Miledi R (1968) The role of calcium in neuromuscular facilitation. J Physiol 195: 481-492.
- Leonard LB, Bortolini U, Caselli C, McGregor KK, Sabbadini L (1992) Morphological deficits in children with specific language impairment: The status of features in the underlying grammar. Language Acquisition 2: 151–179.
- Lieberman P (1984) The Biology and Evolution of Language. Cambridge, MA: Harvard University Press.
- Malenka RC, Kauer JA, Zucker RS, Nicoll RA (1988) Postsynaptic calcium is sufficient for potentiation of hippocampal synaptic transmission. Science 242: 81-84.
- Perucca E (2002) Pharmacological and therapeutic properties of valproate: a summary after 35 years of clinical experience. CNS Drugs 16: 695–714.
- Phillips DP, Farmer ME (1990) Acquired word deafness and the temporal grain of sound representation in the primary auditory cortex. Behav Brain Res 40: 85-94.
- De Ribaupierre F, Goldstein MH Jr, Yeni-Komshian G (1972) Intracellular study of the cat's primary auditory cortex. Brain Res 48: 185-204.
- Rogawski MA, Porter RJ (1990) Antiepileptic drugs: pharmacological mechanisms and clinical efficacy with consideration of promising developmental stage compounds. Pharmacol Rev 42: 223–286.
- Rosenberg G (2007) The mechanisms of action of valproate in neuropsychiatric disorders: can we see the forest for the trees? Cell Mol Life Sci 64: 2090–2103.
- Sakai M, Sato Y (2011) Interstimulus interval-dependent categorical perception in audition: findings and a hypothesis of the role for the primary auditory cortex. pp. 117-161. In: Auditory Cortex: Anatomy, Functions and Disorders (Ed. Elhilali, M). New York: Nova Press.
- Sakai M, Sato Y Circular sensitivity to the temporal-envelope period of the primary auditory cortex (AI) neuron in awake cats (submitted).
- Stromswold K (2001) The heritability of language: a review and metaanalysis of twin, adoption, and linkage studies. Language 77: 647-723.
- Sudhof TC (2004) The synaptic vesicle cycle. Annu Rev Neurosci 27: 509-547.
- Tallal P (1980) Auditory temporal perception, phonics and reading disabilities in children. Brain Lang9: 182–198.
- Ticku MK (1991) Drug modulation of GABAA–mediated transmission. Semin Neurosci 3: 211-218.
- Zucker RS, Haydon PG (1988) Membrane potential has no direct role in evoking neurotransmitter release. Nature 335: 360-362.
Citation: Sakai M (2012) Neural Mechanisms of Fine-Grained Temporal Processing in Audition. Otolaryngol S3:001. DOI: 10.4172/2161-119X.S3-001
Copyright: © 2012 Sakai M. This is an open-access article distributed under the terms of the Creative Commons Attribution License, which permits unrestricted use, distribution, and reproduction in any medium, provided the original author and source are credited.
Select your language of interest to view the total content in your interested language
Share This Article
Recommended Journals
Open Access Journals
Article Tools
Article Usage
- Total views: 15678
- [From(publication date): 1-2012 - Nov 14, 2025]
- Breakdown by view type
- HTML page views: 10836
- PDF downloads: 4842

