Research Article Open Access
A Highly Adaptable Method for Quantification of Peptidyl-tRNA Hydrolase Activity
W. Blake Holloway, Hana McFeeters, Adam M Powell, Gnana S Nidadavolu and Robert L McFeeters*
Department of Chemistry, University of Alabama in Huntsville, Huntsville, AL, USA
- *Corresponding Author:
- Robert L McFeeters
Department of Chemistry, University of Alabama in Huntsville
Huntsville, AL, USA
Tel: 256-824-6023
Fax: 256-824-6349
E-mail: robert.mcfeeters@uah.edu
Received date: March 04, 2015; Accepted date: April 28, 2015; Published date: May 06, 2015
Citation: Holloway WB, McFeeters H, Powell AM, Nidadavolu GS, McFeeters RL (2015) A Highly Adaptable Method for Quantification of Peptidyl-tRNA Hydrolase Activity. J Anal Bioanal Tech 6:244. doi: 10.4172/2155-9872.1000244
Copyright: © 2015 Holloway WB, et al. This is an open-access article distributed under the terms of the Creative Commons Attribution License, which permits unrestricted use, distribution, and reproduction in any medium, provided the original author and source are credited.
Visit for more related articles at Journal of Analytical & Bioanalytical Techniques
Abstract
The emerging importance of Peptidyl-tRNA hydrolase (Pth) enzymes necessitates the need for a widely applicable functional assay to further studies of this important enzyme family. Previously reported methods for monitoring Pth function suffer from limitations of cost, time, substrate availability, and application compatibility. Herein we present a new method for the rapid and precise characterization of Pth activity. The method is applicable for use with specific or bulk peptidyl-tRNA, any Pth enzyme, and a range of reaction conditions including solvent additives. The method also allows for semi-automated quantitative assessment of peptidyl-tRNA cleavage. No specialized equipment, harmful reagents, or time-consuming techniques are required. We use the new method to characterize Pth activity, determine enzyme kinetic parameters, screen for inhibitors, and determine inhibitory parameters.
Keywords
Peptidyl-tRNA hydrolase; Peptidyl-tRNA; Enzyme activity; Quantification; Hydrolysis; Pth1; pth2
Abbreviations
Pth: Peptidyl-tRNA hydrolase
Introduction
Peptidyl-tRNA hydrolase (Pth) enzymes are ubiquitous throughout all living organisms. Their essential biological function is to recover tRNA by cleaving the ester bond between peptide and nucleotide of peptidyl-tRNA [1]. Peptidyl-tRNA is generated from premature termination of protein synthesis and the expression of minigenes or short ORFs [2-4]. The critical role of Pth enzymes in peptidyl-tRNA recycling is still emerging. In most bacteria, for example, there is a single highly conserved Pth1 enzyme that is solely responsible for recycling peptidyl-tRNA released from the ribosome. Loss of Pth1 function is lethal for these bacteria due to tRNA starvation [5,6]. Select bacterial species have an additional pth2 gene [7]; however functional redundancy has not been experimentally confirmed. For organisms with more complex Pth systems, the interplay of multiple Pth enzymes is still not understood. In S. cerevisiae, knockout of Pth1, pth2, or both does not affect viability [8]. With the discovery of Pth3, Pth4, and postulated Pth domain containing proteins in eukaryotes, it is clear that greater understanding of Pth systems and their function is needed [9].
Although methods of studying Pth1 function have been around for decades and have been recently reviewed [10], all have intrinsic limitations that diminish utility. The first characterization of Pth function was reported using autoradiography and paper electrophoresis [11]. The radiolabeled substrate used for these studies is difficult and time consuming to prepare and introduces the complication of working with radioactivity. More recent methods were developed utilizing fluorescently labeled peptidyl- or aminoacyl-tRNAs [12,13]. Though scalable and adaptable to rapid high throughput screening, these methods perturb the substrate by addition of a costly fluorophore in the proximity of the hydrolyzed peptide:nucleotide ester bond, require specialized equipment to detect fluorescence, and suffer from batch to batch labeling variability. Pth activity can also be monitored using a Northern blot [14]. The high specificity of a Northern blot comes at the cost of using a radioactive probe and multiple handling steps including overnight electrophoresis and lengthy blotting and hybridization to visualize the signal of interest. Slow data acquisition and potential for spontaneous peptidyl-tRNA degradation during the procedure are two major drawbacks of the method. In addition, the readout from all of these techniques is limited to monitoring a single species of peptidyl-tRNA: radiolabeled peptidyl-tRNA (autoradiography), fluorescently labeled aminoacyl- or peptidyl-tRNA (fluorescence), and complementary oligonucleotide probe (Northern blot). Unless information for a specific peptidyl-tRNA is desired, such readouts are not fully representative of the naturally occurring heterogeneous peptidyl-tRNA population found in vivo and do not take into account that hydrolysis rates (at least for Pth1) are known to depend on both the particular tRNA and peptide components of the substrate [3,15].
To overcome the limitations of current Pth assays and facilitate the study of new Pth enzymes, we herein introduce a rapid, precise, inexpensive, highly adaptable, and broadly applicable method for monitoring Pth hydrolysis of peptidyl-tRNA. The method is compatible with homogeneous as well as heterogeneous substrates, native as well as modified substrates, any Pth enzyme, and a wide range of buffers and solvent additives (limited by enzyme tolerance). Furthermore, the method requires no specialized equipment or hazardous reagents. Of particular benefit, the method can employ heterogeneous peptidyltRNAs isolated from bacteria in high quantities with minimal resources [6,16]. We show the applicability of the method using two types of Pth enzymes, bacterial Pth1s and human pth2. We also show that a variety of parameters, ranging from enzyme kinetic constants to inhibitor characterization, can be readily determined using the new method. Though modest in throughput, tolerance to multiple common solvents is particularly enabling for inhibitor screening of natural products, in particular those with intrinsic fluorescence.
Materials and Methods
Pth expression and purification
Bacterial Pth1 enzymes were expressed and purified as previously reported [17-19]. Human pth2 was commercially synthesized (GenScript, Piscataway, NJ) and cloned into the pET28b vector (Novagen/EMD Millipore, Billerica, MA) using NcoI and BamHI restriction sites. Human pth2 was expressed and purified as previously described [20]. All purified enzymes were stored at -80°C in 10 mM Tris-acetate, pH 8.0 with 30% glycerol prior to their use in the activity assay.
Preparation of peptidyl-tRNA
Bulk bacterial peptidyl-tRNAs were produced in C600 pth(Ts) cells [6]. A 3 mL LB starter was inoculated with C600 pth(Ts) cells and grown at 30°C. After overnight growth, 2 mL of the starter were used to inoculate a 100 mL LB culture which was grown at 30°C to an OD600 of 0.4. The temperature was then shifted to 42°C, a non-permissive temperature where Pth1Ts is not functional, and peptidyl-tRNA accumulated for one hour. Cells were harvested by centrifugation at 4,000 g and the pellet stored at -80°C. For purification of peptidyltRNA, the frozen cell pellet was resuspended in ice cold 0.3 M sodium acetate, 10 mM EDTA, pH 4.5, followed by two rounds of phenol/ chloroform extraction. The aqueous fraction was isolated and peptidyltRNA was precipitated by adding 2.5 volumes of ice cold 100% ethanol. After centrifugation at 16,000 g at 4°C, the pellet containing peptidyltRNA was washed twice with 0.3 M sodium acetate, 10 mM EDTA, pH 4.5. Peptidyl-tRNA was re-precipitated, ethanol was removed, and the pellet was stored at -80°C for further use. Prior to use in the cleavage assay, the pellet was resuspended in diethylpyrocarbonate (DEPC) treated ddH2O. The concentration of the extracted RNA was adjusted to 30 μg/μL as determined by UV absorbance.
In vitro Pth cleavage reaction
All Pth cleavage reactions were 20 μL, set up as follows: 1 μL of Pth (typically 30 μM) was mixed with 10 μL of reaction buffer (20 mM Tris-acetate pH 8.0, 20 mM magnesium acetate, 40 mM ammonium acetate) and 7.5 μL DEPC ddH2O. Pth hydrolysis was initiated by adding 1.5 μL of peptidyl-tRNA stock. After timed incubation at room temperature, generally 30 minutes unless otherwise noted, the reaction was quenched by the addition of 20 μL gel loading dye (0.1 M sodium acetate, 7 M urea, 0.5 mg/mL bromophenol blue). For inhibitor screening reactions, 4 μL of water were replaced by a natural product extract or solvent only control. For IC50 determination, concentrations of inhibitor were varied in the constant 4 μL of solvent that substituted for water. An equal volume of solvent was added for all positive (no Pth) and negative (no inhibitor) controls.
Acid urea gel electrophoresis
Single layer acid-urea gels were utilized for tRNA separation. The continuous acid-urea polyacrylamide minigel (1.0 mm thick, 7 cm long) consisted of 8 M urea and 6.5% (19:1 acryl:bis-acrylamide) in 100 mM sodium acetate, pH 5.2. Polymerization was initiated using 3.5 mM ammonium persulfate and 7 mM N, N, N’, N’-tetramethyl-ethane- 1,2-diamine (TEMED). After solidifying, the gel was prerun at 100 V for 15 minutes in a running buffer of 100 mM sodium acetate, pH 5.2 in the presence of an ice pack. The apparatus used was the Mini-Protean Tetra system (Bio-Rad, Hercules, CA), which has a buffer reservoir capacity of up to 1 L. Generally, 20 μL of the quenched reaction mixture were loaded into gel wells that had been cleared of excess urea by flushing with running buffer. The minigel was run cold at constant voltage until the bromophenol blue dye reached the bottom of the gel. RNA was stained by 2 mM methylene blue solution in 80 mM sodium acetate, pH 5.2. Destaining was conducted by successive water changes after removal of stain.
Quantification of Pth1 activity
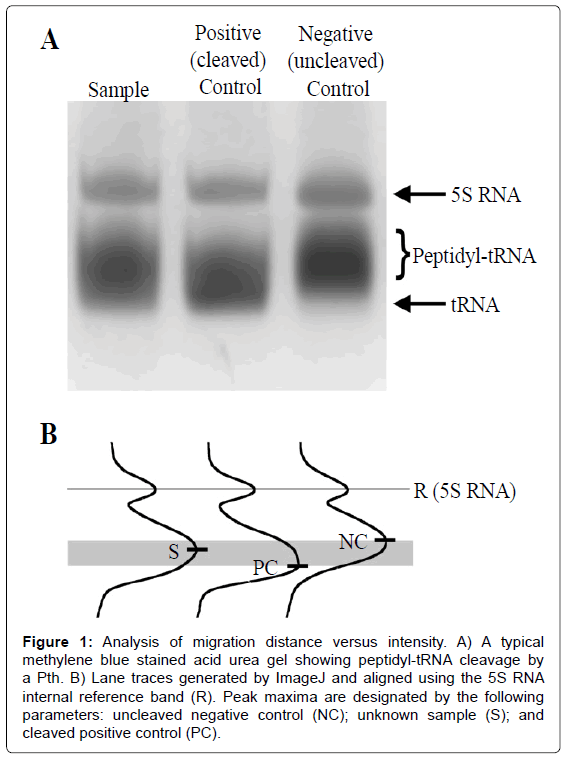
Destained gels were scanned and all sample lanes converted to two dimensional plots of migration distance versus intensity using Image J [21] (Figure 1). Percent cleavage was calculated from Equation 1a
Figure 1: Analysis of migration distance versus intensity. A) A typical methylene blue stained acid urea gel showing peptidyl-tRNA cleavage by a Pth. B) Lane traces generated by ImageJ and aligned using the 5S RNA internal reference band (R). Peak maxima are designated by the following parameters: uncleaved negative control (NC); unknown sample (S); and cleaved positive control (PC).
%Cleavage= ((S-R)-(NC-R))/((PC-R)-(NC-R)) × 100% Equation 1a
=(S-NC)/(PC-NC) × 100% Equation 1b
where the migration distance of the highest intensity sample was S, the reference peak was R, the uncleaved substrate or negative control was NC, and the completely cleaved product or positive control was PC. Migration distances were analyzed using a custom script developed in Mathematica 10.0 [22] with intensity maxima determined using a second order polynomial fit. For samples with an internal reference (i.e. the 5S RNA band conveniently retained from purification of bacterial bulk peptidyl-tRNA, or introduced by addition of an appropriately sized oligonucleotide), migration distances could be calibrated for each lane independently.
Results and Discussion
Electrophoresis optimization
To maximize resolution of non-hydrolyzed substrate peptidyltRNA from the free tRNA product of the Pth enzymatic reaction, optimal gel running parameters were determined. Parameters optimized included gel acrylamide percentage, running voltage, and temperature of the running buffer. Based on the typical size of tRNA, acrylamide percentages from 4 to 15% were tested. An acrylamide percentage of 6.5% yielded the largest separation of substrate peptidyltRNA from product tRNA, in agreement with the optimum acrylamide percentages determined for previous tRNA separations for Northern blotting [23,24]. Minigels with higher percentages of acrylamide exhibited slower sample migration and decreased separation. Lower acrylamide percentages allowed faster migration, but resulted in decreased band resolution and fragile, difficult to handle gels. Altering the degree of crosslinking had minimal effect and 5% crosslinking (i.e. 19:1 acrylamide to bisacrylamide ratio) was used. Three-layer gels [13] in combination with visualization of tRNA by methylene blue did not improve separation.
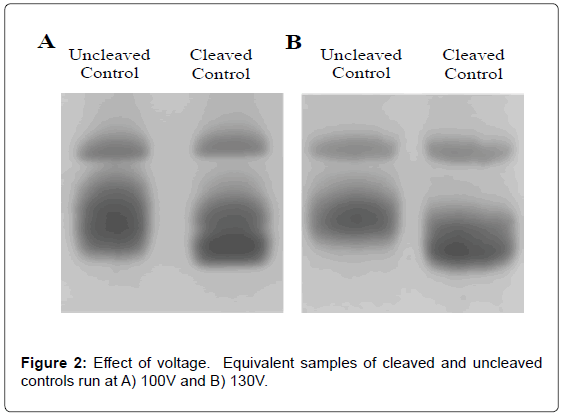
Temperature of the running buffer, which was directly correlated to the applied voltage, was a key consideration for separation. An optimal balance of voltage versus temperature had to be determined for effective and efficient separation. Maintaining running buffer temperatures between 8 and 12°C was found to be essential for resolving tRNA from peptidyl-tRNA. Cooling below 5°C, which caused urea crystallization and led to no migration, should be avoided. In the absence of cooling, the temperature of running buffer and gel increased at all voltages, resulting in decreased separation and resolution. In the presence of an ice pack, or running buffer temperature of 11°C, maximal peak separation was achieved at a constant 100 V applied for 150 minutes (time needed for the dye front to reach the end of the gel). Separation at lower voltages took considerably longer time and did not yield improvements. To reduce gel running time, more effective cooling was implemented, allowing for higher running voltages. By keeping the gel box in an insulated container filled with ice as well as utilizing the maximum volume (1 L) of pre-chilled running buffer, optimal separation could be achieved at 130 V without the temperature of the running buffer rising above 11°C. Gel running times were shortened to 100 minutes. Both 100 and 130 V lead to excellent separation of uncleaved tRNA and peptidyl-tRNA (Figure 2) and allowed highly precise determination of Pth activity (see below). From the relationship between voltage and temperature for the system reported herein (a ~2°C increase per 10 V over 100 V), 130 V was found to be the maximal limit to maintain the running buffer temperature below 12°C by cooling in an insulated ice bath.
Sensitivity
The minimum amount of peptidyl-tRNA necessary for obtaining an interpretable lane trace with methylene blue staining was determined by successive dilution of cleaved bulk peptidyl-tRNA. Below 700 ng/lane, precision was rapidly lost. Note that qualitative, visual determination of complete Pth cleavage of peptidyl-tRNA could be determined from approximately half the amount needed for quantification. The detection limit for quantification could be decreased to below 200 ng/ lane of peptidyl-tRNA (with no appreciable loss in precision) when silver staining was used.
Quantification
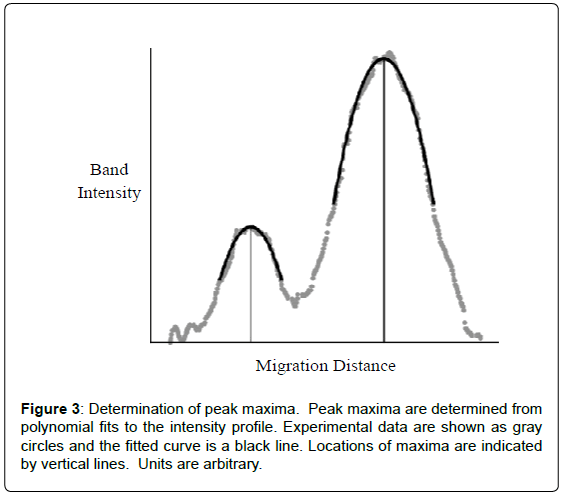
Quantification of peptidyl-tRNA cleavage was readily determined from migration distance versus band intensity generated for each lane. The migration distance was determined as the difference in peak maxima that were obtained from second order polynomial fitting (Figure 3). Using Equation 1a, the percent of peptidyl-tRNA cleaved could be determined since migration distances were directly related to substrate cleavage, see Table 1. This relationship stemmed from empirical observation of a relationship between the amount of cleavage and band position on the gel. The exact nature of this phenomenon has yet to be defined. However, due to not relying on relative intensity changes of uncleaved substrate and cleaved product bands (like for a homogeneous substrate), this procedure is highly precise and accurate. It should be noted that peak maxima could be visually determined with marginal impact on determined percent cleavage and modest decrease in precision. Again, because the Pth activity was determined based on peak position, independent of peak intensity or volume, the method remains effective at low, high and even varying substrate concentrations. Errors due to pipetting and uneven staining are eliminated. Though robust, quantification is highly dependent on the quality of the gel. Smiling or other inconsistencies affect results. An internal reference, which could be added to the sample just prior to electrophoresis, overcomes this limitation. Conveniently, for use of bulk peptidyltRNA, the 5S RNA band serves this purpose. The use of an internal standard greatly improved the precision of the measurement roughly 4-fold. An internal reference has the additional advantages of saving considerable time during non-automated analysis and correction for potential lane to lane differences like smiling or other anomalies.
| 100 V | 100 V No Internal Reference | 130 V | 130 V No Internal Reference | ||||
|---|---|---|---|---|---|---|---|
| Measured (%) | Actual (%) | Measured (%) | Actual (%) | Measured (%) | Actual (%) | Measured (%) | Actual (%) |
| 80.6 ± 0.2 | 80.0 | 79 ± 8.0 | 80.0 | 81.0 ± 3.0 | 80.0 | 79.3 ± 7.1 | 80.0 |
| 62.9 ± 0.1 | 60.0 | 63.3 ± 5.7 | 60.0 | 72.3 ± 2.4 | 60.0 | 73.7 ± 12.6 | 60.0 |
| 40.1 ± 0.1 | 40.0 | 44.4 ± 7.7 | 40.0 | 61.0 ± 1.4 | 40.0 | 54.6 ± 4.6 | 40.0 |
| 31.9 ± 1.3 | 30.0 | 38.7 ± 12.7 | 30.0 | 51.9 ± 4.6 | 30.0 | 55.1 ± 0.5 | 30.0 |
| 19.3 ± 0.1 | 20.0 | 34.8 ± 11.3 | 20.0 | 44.6 ± 0.9 | 20.0 | 54.0 ± 9.6 | 20.0 |
| 10.3 ± 0.1 | 10.0 | 13.7 ± 5.8 | 10.0 | 29.8 ± 1.8 | 10.0 | 37.6 ± 1.3 | 10.0 |
Table 1: The effect of running voltage on measurement precision. Percent cleavage was determined and compared to the actual values from known mixtures of uncleaved peptidyl-tRNA substrate and cleaved tRNA product. Values were determined for constant 100 V and 130 V with and without use of an internal 5S RNA reference from averages of three independent data sets with error determined as the standard deviation.
*For 130 V with no internal reference, one gel of the three could not be meaningfully interpreted so was left out of the analysis. Inclusion of all data resulted in over an order of magnitude increase in the standard deviation reported
Accuracy and precision
The accuracy and precision of peptidyl-tRNA cleavage were evaluated by creating a set of test samples with known amounts of cleaved heterogeneous peptidyl-tRNA isolated from E. coli (Table 1). These samples were made by mixing known volumes of uncleaved peptidyl- tRNA and peptidyl-tRNA that had been fully hydrolyzed. Fully hydrolyzed samples were prepared by incubating peptidyl-tRNA with E. coli Pth1 for 2 hours at room temperature, four times longer than needed for band migration to stop (i.e. complete cleavage). Each experiment was run in at least triplicate with differences no greater than 4.6% observed between the actual and average measured cleavage for all samples tested when utilizing the 5S RNA as an internal reference. A similar analysis was performed without utilizing the 5S RNA as a reference. In this application, the absolute position of the negative and positive controls are set to 0 and 100 percent, respectively, with the percent cleavage of a sample being determined based on the distance between the negative and positive controls. Without an internal reference point in each sample, the ability to determine activity was directly related to the quality of the gel. In the best case (i.e. no gel smiling or other irregularities), analysis can be performed with modest decrease in quantitative quality. However, if the gel does not run uniformly, meaningful data quantification may be lost.
Applications
The presented method is rapid, simple, inexpensive, and can be easily used for a number of applications. Minor modifications such as varying the amount of enzyme, substrate, reaction time, temperature, or adding potential inhibitors can be readily integrated. The following applications present examples of the utility of this highly adaptable method.
Pth enzyme activity
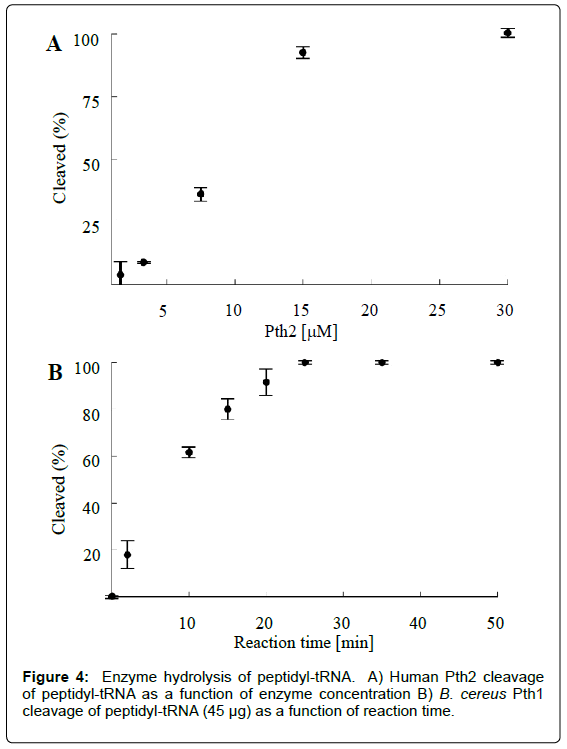
As a functional assay for Pth activity, the presented method can be used to gauge the ability of an enzyme (e.g. a putative Pth) to cleave peptidyl-tRNA. Activity in samples with varying enzyme concentrations can be analyzed to yield a measure of enzyme activity versus enzyme concentration (Figure 4A). Alternatively, by quenching the sample reaction mixtures at regular intervals while keeping the enzyme concentration constant, reaction progress can be also be determined as a function of time (Figure 4B). Beyond determining Pth activity, these experiments can be utilized to optimize more advanced Pth studies. For example, knowledge of the degree of Pth cleavage for a given set of conditions allows for designing experiments to more efficiently determine enzyme kinetic parameters or tune sensitivity for inhibitor screening.
Pth enzyme kinetic parameters
Evaluation of the degree of peptidyl-tRNA cleavage can readily be adapted to determine Pth kinetic parameters. Percent cleaved can be converted to product concentrations and kinetic parameters determined using the integrated rate equation. Alternatively, time courses of Pth cleavage can be run at different peptidyl-tRNA (substrate) concentrations. The resulting data can be analyzed to determine the initial velocities of the reaction at a particular peptidyltRNA concentration. Initial velocity data as a function of known substrate concentrations can then be used to determine the kinetic parameters Vmax and Km (supplementary figure). Following this initial velocity procedure, Vmax was determined to be 4.7 ± 0.2 μmoles/min and Km 38 ± 2 μM for E. coli Pth1. The measured values are in line with the previously reported Km value of 5.5 μM determined for a fluorescently modified aminoacyl-tRNAMet [25].
Pth inhibitor screening
Another application of this method is in vitro screening for inhibitory activity against Pth enzymes. We have used this assay to identify crude plant extracts with inhibitory activity against P. aeruginosa Pth1 (Figure 5). The method is well suited to screening crude extracts since it is insensitive to fluorescent background (a potential complication for fluorescent based assays of Pth activity), and substrate/product separation is not affected by common solvents (including 20% DMSO, ethanol, isopropanol, chloroform, methyl chloroform, or ethyl acetate). Thus, reaction mixtures can contain natural product extracts in DMSO, greatly increasing the array of compounds amenable to screening and increasing sensitivity towards less soluble compounds (by tolerating more solvent to solubilize them at higher levels).
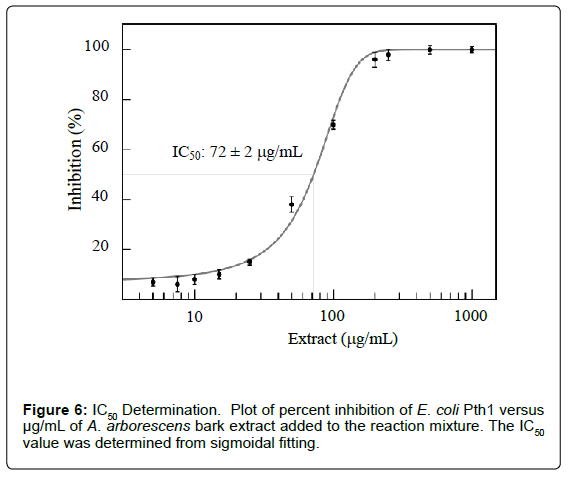
MIC and IC50 values can be determined by varying the amounts of plant extract (Figure 6). Plotting percent inhibition of peptidyl-tRNA cleavage for each concentration of inhibitor tested allows for evaluation of appropriate parameters. Combining the ability to measure inhibitor effects with the previous analysis of kinetic parameters (percent cleaved versus time in the presence of an inhibitor) allows a means to distinguish competitive, uncompetitive, or mixed inhibition.
Conclusion
A robust and expeditious method for analysis of peptidyl-tRNA cleavage by Pth enzymes is presented. The method can be readily performed in any typical biochemistry laboratory, does not require specialized equipment or harmful reagents, is inexpensive, is reliably quantifiable, and data analysis is straightforward. Key parameters are presented that allow adaptation of the method to other gel running systems with a rapid means of optimizing performance. The method is suitable both for qualitative and quantitative analysis of peptidyl-tRNA cleavage with an error of less than 5% readily achievable in the presence of an internal standard. Though the method is presented without use of specialized gel imaging system, trivial modifications to data from dedicated gel imaging systems allows for semi-automated analysis.
The method presented allows for multiple applications, including rapid qualitative assessment of Pth activity, quantitative analysis of Pth cleavage, determination of enzyme kinetic parameters, quantitative screening of extracts or multiple compound mixtures for Pth inhibition, and characterization of inhibitory parameters. Having this methodology in place enables continued, higher throughput screening for antimicrobials [14,26,27]. It also provides a means for establishing Pth activity, accelerating understanding of the many emerging bacterial Pth1s [17,19,28-31] and Pth enzymes in multi-component eukaryotic Pth systems [7,9].
Acknowledgement
The authors thank Geordan Burks for detailed, critical reading of the manuscript.
References
- Das G,Varshney U (2006) Peptidyl-tRNA hydrolase and its critical role in protein biosynthesis. Microbiology 152: 2191-2195.
- Hernández-Sánchez J,Valadez JG, Herrera JV, Ontiveros C, Guarneros G (1998) lambda bar minigene-mediated inhibition of protein synthesis involves accumulation of peptidyl-tRNA and starvation for tRNA. EMBO J 17: 3758-3765.
- Cruz-Vera LR, Hernandez-Ramon E, Perez-Zamorano B, Guarneros G (2003) The rate of peptidyl-tRNA dissociation from the ribosome during minigene expression depends on the nature of the last decoding interaction. J BiolChem 278: 26065-26070.
- Tenson T, Herrera JV, Kloss P, Guarneros G, Mankin AS (1999) Inhibition of translation and cell growth by minigene expression. J Bacteriol 181: 1617-1622.
- Atherly AG, Menninger JR (1972) Mutant E. coli strain with temperature sensitive peptidyl-transfer RNA hydrolase. Nat New Biol 240: 245-246.
- Cruz-Vera LR, Toledo I, Hernández-Sánchez J, Guarneros G (2000) Molecular basis for the temperature sensitivity of Escherichia coli pth(Ts). J Bacteriol 182: 1523-1528.
- Powers R,Mirkovic N, Goldsmith-Fischman S, Acton TB, Chiang Y, et al. (2005) Solution structure of Archaeglobusfulgidispeptidyl-tRNA hydrolase (pth2) provides evidence for an extensive conserved family of pth2 enzymes in archea, bacteria, and eukaryotes. Protein Sci 14: 2849-2861.
- Rosas-Sandoval G,Ambrogelly A, Rinehart J, Wei D, Cruz-Vera LR, et al. (2002) Orthologs of a novel archaeal and of the bacterial peptidyl-tRNA hydrolase are nonessential in yeast. ProcNatlAcadSci U S A 99: 16707-16712.
- Dujeancourt L, Richter R, Chrzanowska-Lightowlers ZM, Bonnefoy N, Herbert CJ (2013) Interactions between peptidyltRNA hydrolase homologs and the ribosomal release factor Mrf1 in S. pombe mitochondria. Mitochondrion 13: 871-880.
- McFeeters H, McFeeters RL (2014) Current Methods for Analysis of Enzymatic PeptidyltRNAHydrolase, J Anal &Bioanal Tech 5.
- Shiloach J, Lapidot Y, de Groot N (1975) The specificity of peptidyl-tRNA hydrolase from E. coli. FEBS Lett 57: 130-133.
- Bonin PD, Erickson LA (2002) Development of a fluorescence polarization assay for peptidyl-tRNA hydrolase. Anal Biochem 306: 8-16.
- Kirchdoerfer RN, Huang JJ, Isola MK, Cavagnero S (2007) Fluorescence-based analysis of aminoacyl- and peptidyl-tRNA by low-pH sodium dodecyl sulfate-polyacrylamide gel electrophoresis. Anal Biochem 364: 92-94.
- Harris SM,McFeeters H, Ogungbe IV, Cruz-Vera LR, Setzer WN, et al. (2011) Peptidyl-tRNA hydrolase screening combined with molecular docking reveals the antibiotic potential of Syzygiumjohnsonii bark extract. Nat Prod Commun 6: 1421-1424.
- De Groot N, Groner Y, Lapidot Y (1969) Peptidyl-tRNA. VII. Substrate specificity of peptidyl-tRNA hydrolase. BiochimBiophysActa 186: 286-296.
- Varshney U, Lee CP, RajBhandary UL (1991) Direct analysis of aminoacylation levels of tRNAs in vivo. Application to studying recognition of Escherichia coli initiator tRNA mutants by glutaminyl-tRNAsynthetase. J BiolChem 266: 24712-24718.
- Hughes RC,McFeeters H, Coates L, McFeeters RL (2012) Recombinant production, crystallization and X-ray crystallographic structure determination of the peptidyl-tRNA hydrolase of Pseudomonas aeruginosa. ActaCrystallogr Sect F StructBiolCrystCommun 68: 1472-1476.
- McFeeters H, Gilbert MJ, Thompson RM, Setzer WN, Cruz-Vera LR, et al. (2012) Inhibition of essential bacterial peptidyl-tRNA hydrolase activity by tropical plant extracts. Nat Prod Commun 7: 1107-1110.
- Taylor-Creel K,Hames MC2, Holloway WB3, McFeeters H4, McFeeters RL5 (2014) Expression, purification, and solubility optimization of peptidyl-tRNA hydrolase 1 from Bacillus cereus. Protein ExprPurif 95: 259-264.
- De Pereda JM,Waas WF, Jan Y, Ruoslahti E, Schimmel P, et al. (2004) Crystal structure of a human peptidyl-tRNA hydrolase reveals a new fold and suggests basis for a bifunctional activity. J BiolChem 279: 8111-8115.
- Abramoff MD, Magelhaes PJ, Ram SJ (2004) Image processing with ImageJ. BiophotonicsInt 11:36-42.
- Wolfram R (2014) Mathematica 10.0, Wolfram Research, Inc., Champaign, Illinois.
- Janssen BD, Diner EJ, Hayes CS (2012) Analysis of aminoacyl- and peptidyl-tRNAs by gel electrophoresis. Methods MolBiol 905: 291-309.
- Köhrer C,Rajbhandary UL (2008) The many applications of acid urea polyacrylamide gel electrophoresis to studies of tRNAs and aminoacyl-tRNAsynthetases. Methods 44: 129-138.
- Goodall JJ, Chen GJ, Page MG (2004) Essential role of histidine 20 in the catalytic mechanism of Escherichia coli peptidyl-tRNA hydrolase. Biochemistry 43: 4583-4591.
- McFeeters H, Gilbert MJ, Thompson RM, Setzer WN, Cruz-Vera LR, et al. (2012) Inhibition of essential bacterial peptidyl-tRNA hydrolase activity by tropical plant extracts. Nat Prod Commun 7: 1107-1110.
- McFeeters RL (2013) Recent Antimicrobial Developments Targeting Peptidyl-tRNA Hydrolases. JSM Biotechnology & Biomedical Engineering 1(1): 1006-1008.
- Vandavasi V, Taylor-Creel K2, McFeeters RL2, Coates L,McFeeters H2 (2014) Recombinant production, crystallization and X-ray crystallographic structure determination of peptidyl-tRNA hydrolase from Salmonella typhimurium. ActaCrystallogr F StructBiolCommun 70: 872-877.
- Clarke TE, Romanov V, Lam R, Gothe SA, Peddi SR, et al. (2011) Structure of Francisellatularensispeptidyl-tRNA hydrolase. ActaCrystallogr Sect F StructBiolCrystCommun 67: 446-449.
- Pulavarti SV, Jain A, Pathak PP, Mahmood A, Arora A (2008) Solution structure and dynamics of peptidyl-tRNA hydrolase from Mycobacterium tuberculosis H37Rv. J MolBiol 378: 165-177.
- Kumar A, Singh N, Yadav R, Kumar RP, Sharma S, et al. (2012) Crystal structure of peptidyl-tRNA hydrolase from mycobacterium smegmatis reveals novel features related to enzyme dynamics. Int J BiochemMolBiol 3: 58-69.
Relevant Topics
Recommended Journals
Article Tools
Article Usage
- Total views: 16398
- [From(publication date):
June-2015 - Aug 17, 2025] - Breakdown by view type
- HTML page views : 11701
- PDF downloads : 4697

