A Preliminary Hydrological Assessment for Sustainable Groundwater Abstraction Using VES, MRS, SR and MODFLOW: A Case of Namanve Industrial and Business Park, Mukono District, Uganda
Received: 11-Sep-2018 / Accepted Date: 11-Oct-2018 / Published Date: 22-Oct-2018 DOI: 10.4172/2157-7617.1000494
Keywords: Hydrological-assessment; Sustainability; Vertical-Electric-Sounding (VES); Magnetic-Resonance-Sounding (MRS); MODFLOW; Groundwater abstraction; Mukono District; Uganda
Introduction
Groundwater is defined by Freeze and Cherry [1] as the subsurface water that occurs beneath the water table in the soils and geologic formations that are fully saturated. It is one of the key subsurface natural resources in the world, and serves as important source of water supply for various purposes e.g. domestic, agricultural, and industrial purposes. This is due to mainly its abundance, with roughly stable quality and it is inexpensive to exploit [2]. Recent figures from the United States Geological Survey (USGS) [3] indicate that groundwater provides an estimated 22% of all fresh water supplies in the world, 37% of the water for agricultural, commonly used for irrigation, 37% of public water supplies, 51% and 90% of safe drinking water for urban and rural population respectively. Generally, groundwater has a fundamental importance of meeting the increasing urban, rural, industrial and agricultural water requirements especially in arid and semi-arid areas where surface water is increasingly becoming more scarce and seasonal due to the effects of climate change.
Uganda, like other African countries that majorly depend on groundwater occurring in the low yielding crystalline rock aquifers which are facing sustainable groundwater supply problems [4-6]. Despite the fact, ambitious developments plans, urbanization and rapid population growth that requires increased volumes of water supply are ongoing in many parts of the country. Groundwater source is one of the key targets to meet water demand for such developments e.g. more than 30 urban water supplies in the country are currently using groundwater [7], industrial and irrigation ground water uses have also increased in many parts of the country.
A situational study in Kampala Industrial and Bussiness Park- Namanve located 12 Km along the Kampala-Jinja high way in Mukono District has showed that; groundwater from drilled boreholes is a significant source of water supply to most industrial establishment in the area alongside National Water and Sewerage Cooperation (NWSC) piped water supply that covers a very limited part of the Industrial park [8]. By June 2015, the time of this study, regulated groundwater abstraction in this area had risen to about 30 permits from about 03 permits in a year 2000 [9]. Currently, groundwater in this area may appear to be abundant, though the increasing rate at which it’s being exploited possess a concern on aspects related to its management for sustainable use purposes. It upon this background that a groundwater abstraction sustainability assessment has been done in the study area in order to understand the groundwater system and the likely impacts of increasing groundwater abstraction on the system.
Geophysical methods (e.g. electrical resistivity, Magnetic Resonance Sounding (MRS) and seismic refractions) alongside borehole drilling logs have been used to provide information on groundwater availability in the area. Electrical resistivity method; being the commonest methods employed in various hydrogeological studies within the crystalline basement rocks e.g. Vertical electrical sounding and correlation of geoelectric data with aquifer parameters [10,11] were used to determine the depth to bedrock and zones of saturation in the subsurface. Hydraulic characteristics of the subsurface aquifers e.g. Transmissivity (T), Hydraulic conductivity (K) and Specific yield (Sy) are important properties for groundwater flow and supply evaluation and were calculated from pumping tests performed on boreholes in the study area [5,6,12]. The resulting information was put together with other hydrological information in the area to develop a hydrogeological conceptual model. The conceptual model was further converted into a computer based mathematical model or a numerical groundwater model [13,14]. The numerical model was then used to describe groundwater flow, water balance conditions and predicting how aquifers may respond to various pumping stresses scenarios and other environmental factors related to groundwater resource management [15,16].
Study area setting
Kampala Industrial and Business Park-Namanve is located about 12 km in the east of Kampala city along the Kampala-Jinja high way, it lies on the northern shores of Lake Victoria and is shared by two central districts of Uganda, namely Wakiso and Mukono (Figure 1). The study focused on an area of about 15 sqkm bounded by ridges in the west, east and the north while the south is a low lying valley area. The area is peri-urban characterized by high population, variety of commercial businesses and a number of industrial establishments.

Figure 1: Map of the study area.
Relief and climate
The study area lies on the altitude between 1,158 m and 1,219m above mean sea level. It has moderate to high relief with some landform features e.g. small hills and ridges. The streams in the area generally drain North wards and the main river in the area is River Namanve [17]. The vegetation in the area is predominantly of the tropics but has been cleared for various commercial developments and a few patches are left. The rainfall is evenly distributed over the area with an annual amount between 1200-1600 mm [18].
Namanve Industrial Park is characterized by a bimodal pattern with most rainfall falling in March to May and September to November. There is normally a short drier spell between the two rainy seasons during mid- June to mid-July. The longest dry season sets in during early December through to early March. July is the driest month of the year as indicated by the average monthly rainfall distribution in Figure 2 (National Agricultural Research Organization- NARO-Mukono zonal area and the source of data was from the Directorate of Water Resources Management - 2014) The annual maximum temperature of the area is about 25°C to 27.50°C and annual minimum temperature is between 15 -17.5°C [19].

Figure 2: Mean Monthly distribution of rainfall in 2013-2014. Adopted from [18].
The study area is specifically comprised of the Kampala Suite granites that consist of variably deformed granitoids and orthogenesis and lies between the Paleoproterozoic Buganda group in the south and various tonalite-trondhjemite-granodiorite/granite (TTG) of gneisses in the north. Being compact and weathering resistant rocks, they usually form hills, that are particularly evident in the study area and rise up to about 110m above the Lake level and they are rounded and covered with laterite soils. The structures in the area include tight folds on ENE axes in the east which varies to the west, with a decrease in intensity and a lowering of the metamorphic grade to the south.
Hydrogeological settings
Groundwater in the area occurs in both shallow aquifers contained in the porous weathered mantle and the deeper fractured bed rock aquifers. The weathered mantle comprises of weathered rocks (saporolite) or sandy-clays consisting of micas, feldspars and quartz grits while the fractured bed rock is made up disintegrated granitic gneisses. Groundwater levels in the area are usually shallow between 5-8 meters [20]. The shallow weathered mantle aquifers and the deeper fractured bedrock aquifers are usually hydraulically interconnected [5,6].
Materials and Methods
Materials
Groundwater occurs in the crystalline rock aquifers in various continents of the world that include Africa, Asia and South America [2]. Crystalline basement rocks are known to form the oldest rocks of igneous origin such as granotoids and gneisses. The age of these rocks ranges between 2.75-2.55Ga and have little or no primary porosity [21]. Groundwater in these rocks is normally present in the fractures or the overlying weathered overburden.
Chilton and Foster [22], estimated that crystalline basement aquifers account for over 40% of the groundwater supplied in the SSA, volcanic rock aquifers that occur mostly in East Africa account for about 6%, the consolidated sedimentary rock aquifers that occur extensively in countries like Chad, DRC and Mozambique account for about 22% and finally the river/alluvial sediment aquifers located along the major river beds have unknown but significant contribution.
Boreholes that are drilled up to the fractured bedrock where the permeability is high and where the storage can be provided by the overburden usually have better yields as compared to the boreholes in the weathered mantle [6]. However, Taylor and Howard [5] observed that fractures in the crystalline basement rocks that form aquifers are sometimes discontinuous and inherently possess low storativities that prolonged or intensive groundwater abstraction from these aquifers depends upon leakage from the more porous overburden.
As presented in Table 1, aquifers are in the crystalline rocks across some few African counties have been noted to be heterogeneous and anisotropic with generally low estimates of transmissivities that commonly vary over three or more orders of magnitude both spatially and vertically [23-26].
| Location | Coordinates | MRS loop Shape & Size |
Azimuth (ᶱN) |
Lamor Freq.(Hz) | Signal to Noise Ratio | Average # stack |
θ_MRS (%) | T2* | Tickness(m) | Measured SWL (m) |
Measurement | |||
|---|---|---|---|---|---|---|---|---|---|---|---|---|---|---|
| UTI_E (m) | UTI_N(m) | |||||||||||||
| Date | Duration (d) | |||||||||||||
| From | To | |||||||||||||
| Ageri | 476181 | 22886 | 8 square: 62 5 m | 45 | 1439.52 | 5.77 | 400 | 8 | 167 | 4.5 | 20.6 | 6.29 | 28/03/2014 | 2 |
| Egum | 474098 | 227367 | 8 square: 62 5 m | 45 | 1440 | 3.93 | 400 | 6.4 | 148 | 10.3 | 33.4 | 30/03/2014 | 2 | |
| Baracer | 477788 | 221298 | square:125m | None | 1440.52 | 4.43 | 300 | 4.6 | 149 | 0.5 | 42.8 | 1.37 | 01/04/2014 | 3 |
| Otong P/S | 409700 | 333782 | 8 square: 62 5 m | 35 | 1442.14 | 3.51 | 450 | 7 | 172 | 3.3 | 16.6 | 5.35 | 09/04/2014 | 2 |
| Roofig | 466324 | 37989 | 8 square: 62 5 m | 215 | 1423.81 | 1.56 | 600 | 6.1 | 68 | 4.3 | 28.4 | 18/04/2014 | 2 | |
| Nsekanambo | 229220 | 9958093 | 8 square: 62 5 m | 175 | 14110.8 | 1.67 | 650 | 4.9 | 125 | 1.4 | 22.9 | 2.82 | 25/04/2014 | 4 |
| Awal Obaro | 429027 | 342154 | 8 square: 62 5 m | 130 | 1442.61 | 1.86 | 400 | 2.6 | 142 | 2.1 | 10.3 | 5.4 | 11/04/2014 | 2 |
| Pagwaya | 328962 | 278913 | square : 125m | None | 1438.96 | 4.39 | 350 | 4.2 | 179 | 15.2 | 72 | 27.4 | 13/04/2014 | 2 |
| Kabolwa | 324495 | 223252 | 8 square: 62 5 m | 335 | 1437.81 | 3.05 | 500 | 2.3 | 143 | 5 | 47.5 | 8.26 | 29/04/2014 | 3 |
| Blowoza | 547477 | 65172 | 8 square: 62 5 m | 80 | Too noisy site Too noisy site |
15/03/2014 | 1 | |||||||
| Nkokonjeru | 491452 | 28444 | 8 square: 62 5 m | 170 | 16/03/2014 | 1 | ||||||||
Table 1: Summary of the Synthesis of MRS measurement and interpretation for the 11 sounding sites in Uganda [41].
Studies in the crystalline basement rock aquifers in Uganda: Geo-hydrological studies in southwestern Uganda in Nyabisheke catchment using well testing, packer testing, collection of water samples for major and minor ions and environmental isotope analysis demonstrated that the crystalline basement rocks of the catchment form a very weak aquifer which is highly susceptible to over pumping hence causing decline in groundwater levels [26]. The studies further suggest that in areas where good hydraulic interconnection between the bedrock and regolith exist, it is likely that the aquifer within the overlying regolith may be transmitting the majority of the vadose-zone recharge and therefore may provide the key feature of groundwater resource development.
Nature of aquifers in the crystalline basement rocks of Uganda: Precambrian crystalline rocks of Uganda have been subjected to long term weathering which is evident from the thick mantle of weathered rock that overlies the bedrock [27]. Aquifers occur in the fractured bedrock and at the base of unconsolidated overburden where coarser bedrock fragments predominate [28]. The occurrences of groundwater in these aquifers depend on the thickness of the weathered zone normally 10-90 m [6] and this zone is anisotropic characterized by permeability and porosity that vary with depth [22]. Porosity and permeability of the bed rock depend mainly on the nature of the formation and the extent of fracturing [6]. Recharge in Uganda amounts to approximately 10% of annual rainfall in the zone of deep weathering in central Uganda [29,30] whereas it is as little as 1% of annual rainfall in the zone of stripping in western Uganda [5]. This therefore suggests that the ability of the weathered crystalline rocks to provide adequate yields of water supply in Uganda depends on both the climatic conditions and aquifer properties.
Hydrogeological conceptual model: Generating a hydrogeological conceptual model for the fractured rock system e.g. the crystalline basement rock system requires a gross simplification or detailed description of the aquifer properties controlling the groundwater flow [31]. Fractured material is represented as an equivalent porous medium (EPM) by replacing the primary and secondary porosity and hydraulic conductivity distributions with a continuous porous medium of equivalent or effective hydraulic properties.
According to Yuri et al. [32], the EPM approach has been frequently applied to simulate flow in fractured media due to its ease of use. This practice results in some severe limitations such as hydraulic head averaging and an inability to handle preferred fluid pathways. When fractures are few and far between and the fractured block hydraulic conductivity is low, the EPM approach may not be appropriate.
In Uganda, the hypothesis of EPM has been successfully applied in the crystalline basement rocks of Pallisa district to construct a conceptual and numerical Model covering the full extent of the Pallisa as applied in groundwater abstraction and contamination [33] hence it was considered applicable in the study area moreover of similar hydrogeological environment.
Aquifer system to increased groundwater abstraction: Over abstraction of groundwater has negative effects on aquifers and the environment in general e.g. drop in groundwater levels and deterioration of groundwater quality [34]. Sustainable groundwater abstraction must be balanced by recharge that ensures stable groundwater levels and quality. In areas where there is groundwater over abstraction, boreholes drilled may either fail at the time of drilling or cease to provide adequate quantity and quality of water within a short time of their construction as a result of decline in groundwater levels and deterioration of the water quality respectively. The cause of these effects is normally linked to reduced recharge, poor borehole yields in relation to water demand, seasonal variations e. g. draughts and the general increased groundwater demand [35].
As described by Carrera-Hernandez and Gaskin [36], the advantage of MODFLOW is that it provides different modules to undertake groundwater flow simulations in confined and unconfined aquifers as well as in aquifers with variable confinement with both constant and variable transmissivity values. The modules provided by MODFLOW can be used to simulate the effect on an aquifer system caused by different stresses such as the presence of extraction and injection wells, of areal distribution of recharge, evapotranspiration or of different hydrological features.
Methods
Resistivity is one of the geophysics method commonly applied in groundwater studies to delineate hydro-stratigraphic units [10]. The method was applied in the study of horizontal and vertical discontinuity in the electrical properties of the subsurface and also in the detection of three-dimensional bodies of anomalous electrical conductivity.
Horizontal profiling in resistivity were detected while Vertical Electric Sounding (VES) data acquisition on depth investigations were made. The results of horizontal profiling and VES for both horizontal and vertical variations in the electrical properties of the ground were noted.
The generated VES data (mainly apparent resistivity and depth variations) were interpreted using computer software to generate models of the subsurface rock units as a function of depth.
In this research study, identification of hydro-stratigraphic units was undertaken using two composite approaches outlined below.
i. Correlation of the available borehole logs from the study area; and
ii. Analysis and interpretation of VES data obtained from the area.
Analysis and interpretation of Geophysics Data-Vertical Electric Sounding (VES): For the present study, geophysical survey results (VES) data obtained using Schlumberg configuration AB/2 distances (usually 200-300m) within the study were provided by private consulting companies’ e.g. Draco drilling Company and Aquatec Enterprises. This data was lateral inverted using 1x1Dv3 Interpex software program. This program models VES data into layers usually the overburden on top, followed by weathered/ highly-fractured rock, then slightly-fractured rock and lastly the hard bedrock. Examples for comparison of VES and borehole log models are presented in Figures 6, 7 and 8.

Figure 3: Variation of abstractions (m3/day-1) at 3 boreholes for a period of 3 years (2013-2016).

Figure 4: A 2D display of the stratigraphy of the study area using borehole drilling logs.

Figure 5: Correlation of apparent elecrical resititivities with drill logs of borehole DWD 30368-Namanve.

Figure 6: Correlation of apparent elecrical resititivities with drill logs of borehole DWD 30283-Namanve.

Figure 7: Correlation of apparent elecrical resititivities with drill logs of borehole DWD 29736-Namanve.

Figure 8: Roofing Rolling Mills Borehole 2, Leakey aquifer solution- Huntush Jacob.
MRS has been applied for estimating aquifer storage properties that are used for calculating groundwater reserves and recharge in the crystalline basement rocks in many parts of the world including Africa. It is a non-invasive geophysical method that measures a subsurface signal directly linked to the presence of groundwater within a given area. The details of the method and its principles are thoroughly described in Legchenko, Valla, Lubczynsky and Roy’s studies [37,38]. The resulting MRS geophysical parameters are the initial amplitude which is linked to the water content ( θMRS ) and the decay time ( T2 *) which is linked to the mean size of the pores that contain water [39] and the main aquifer storage properties estimated by MRS is the aquifer specific yield Sy obtained from MRS free water content [40]. The interpreted MRS results at this site were parametrized using pumping test data for a borehole adjacent to the sounding site hence aquifer storage coefficient Sy and Transmissivity T were estimated [41].
Aquifer hydraulic parameters: Aquifer tests results particularly pumping test data have been used by many authors to estimate the aquifer hydraulic parameters in crystalline rock environments [12]. The principle of a pumping test involves applying a stress to an aquifer by extracting ground water from a pumping well and measuring the aquifer response to the stress by monitoring drawdown as a function of time. The longer the duration of the test, the larger the volume of the aquifer involved hence the more representative aquifer data [42] straight line approach is one of the preferred method because it is flexible in different hydrogeological conditions and has been used successfully by many authors in different environments [43]. Computer software AQTESOLV has also been used as a main alternative for analysis of pumping test data in many research studies [6,12,27]. In this method, records of pumping test data e.g. draw down, saturated thickness of the aquifer, time of pumping test data are fed in the software and the software produces curves with estimated/ calculated hydraulic parameters like T, K and Sy.
Correlation of borehole logs: Boreholes across the study area were selected and their logs were correlated to generate a stratigraphic a 2D cross section model (Figure 5) that represents the major hydrostratigraphic zones in the study area [22].
ArcGIS v.10 software was used to correlate the large number of borehole logs considered in the cross section. Drilling logs related to the selected boreholes were fed into the software and were used to create and guide the dimensions and the vertical stratigraphy of the cross section. The generated cross section model was used to determine the average thickness and continuity of each stratigraphy layers in the area. The cross sections revealed both vertical and lateral variations of the lithology in the area, rock units penetrated by most boreholes, depth of occurrence and thickness of the saturated/ aquifers layers in the area hence a detailed interpretation of the underlying stratigraphic sequence and the extent of the saturated layers (aquifers) occurring in the area.
Evaluation of the hydraulic parameters of the aquifer system: Aquifers behave differently to groundwater withdraw because of the difference in the hydraulic characteristics e.g. transmissivity, hydraulic conductivity and storage coefficient. The difference in the hydraulic characteristics is mainly due to the geologic heterogeneity of the subsurface. Detailed knowledge of the distribution of the aquifer hydraulic properties is thus a prerequisite is such a study. In practice, several investigation techniques e.g. aquifer tests, groundwater flow simulations may be employed to estimate the distribution of hydraulic properties of an aquifer system. In this study, aquifer tests (Pumping test) method was used. Pumping test data used in the study consisted of 01 set of multiple well test at Roofing Rolling Mills Uganda Limited- Namanve area and 09 single well pumping tests (without observation wells) (Table 1). The data was collected from boreholes distributed in Namanve, Seeta, Mukono and Mbalala area. AQTESOLV TM/Pro v4.5 software was used to analyze and interpret the pumping test data.
Hydrogeological conceptual model of the study area: A conceptual model is defined as hypothesis of how a system or process operates and consists of a set of assumptions that reduce the real system to simplified versions that are acceptable. Hydrogeological conceptual models are normally formulated to aid better understanding of the site hydrogeological conditions and define groundwater problems affecting a given area so that a numerical model with a suitable computer codes may be selected for further understanding of the problems [44]. The nature of the conceptual model determines the dimensions and design of the grid involved in numerical modeling. Failure of numerical model to give accurate result is often attributed to errors in the conceptual model. It is therefore critical that a conceptual model form a valid representation of the important aspects of a given groundwater system [31]. In this study, the hydrogeology of the area was conceptualized by incorporating the relevant information in the area e.g. drilling logs, geophysics, pumping tests and monitoring data for groundwater levels and weather events. Several simplifying assumptions e.g. on topography, geology, hydrology and climatic conditions were however applied to complete this conceptual model.
a) Conceptual model boundaries: Conceptual model boundary establishment is normally based on the site-specific knowledge acquired from geology, topography and flow system prevailing in the area. For this study, topography, surface water divides and borehole locations were used in defining the boundaries of the model domain.
b) Terrain: The general terrain of the study area was conceptualized to be of low relief with minor landforms features e.g. hills and ridges that diminish towards the southern part of the study area. Minor Streams occur in the lowest relief areas/ valleys and most of them drain northwards away from Lake Victoria. The commonly exposed lithological units within the study area was mainly lateritic soils and the Kampala Suite granites that consist of variably deformed granitoids and orthogenesis [45].
c) Stratigraphy/hydro-stratigraphy of the area: Based on the analysis of the available subsurface data (resistivity data, drilling logs) together with the general geological knowledge gained from the reconnaissance visit made to the study area, the general stratigraphy of the area may be described as follows:
i. Weathered overburden that combines top soils and other thin profiles e.g. laterites, clays and sands. The thin profiles are quite ubiquitous in their occurrence and were completely missing in some borehole logs [46]. The average thickness of this unit (weathered overburden) is expected to range between 12 to 40 meters. ii. Fractured bedrock formation that is usually granitic and slightly weathered in nature comes follows below and it has an estimated thickness between 9 to 30 meters. iii. The massive and hard granitic rock formation forms the base of the stratigraphic column and its thickness could not be estimated but it occurs at an estimated minimum depth of about 55-70 meters.
The first two stratigraphic units are normally saturated (form aquifers) at varying depth and the total average thickness of the saturated zone within the two aquifers was estimated to be about 48 meters with 17 meters in the weathered over burden and 31 meters.
d) Hydraulic properties of the stratigraphic units: Hydraulic conductivity and transmissivity are key components of the groundwater conceptual model. The pumping test data analysis generally presented very low and highly varying hydraulic conductivities and transmissivities as a major characteristic of crystalline rock environments [22]. The average mean hydraulic conductivity and transmissivity of the deeper fractured rock aquifers was estimated to be 0.1756 m day-1 and 3.275 m3 day-1 respectively. The specific storage of the aquifer demined using MRS soundings together with pumping test results is 4 × 10⁻³.
e) Recharge: Factors contributing to groundwater recharge in the area include rainfall, evapotranspiration and soil type. The recharge in the area is assumed to occur mainly from rainfall/seasonal floods generated from the topographic elevated ridges surrounding the area. Results and conclusions made from previous recharge studies in Uganda that employed various methods e.g. soil moisture balance, water level fluctuation, isotope methods, chloride balance, flow modelling and base flow separation [12,26,28,30] were applied in this study. Most of these studies show that upon reaching the land surface, most of the incoming rainfall (70-90%) is recycled to the atmosphere by evapotranspiration and the reminder stays at the land surface and contributes to surface flow via runoff and to groundwater recharge via infiltration through the unsaturated zone. Taylor and Howard [28] showed that groundwater is recharged by heavy rainfall and that recharge events are effectively restricted to periods of heavy rainfall so that the magnitude of recharge is controlled more by the number of heavy rainfall events (>10 mm d-1). Owor et al. [12] further concluded that the magnitude of observed recharge events is better related to the sum of heavy rainfalls exceeding a threshold of 10 mm day-1, than to that of all daily rainfall events. Since there is a big variation of rainfall received in the different parts of Uganda, the estimated annual groundwater recharge rates in different parts of Uganda are highly variable but amounts to approximately 10% of annual rainfall in the zone of deep weathering i.e. central Uganda whereas its approximately 1% of annual rainfall in the zone of stripping in western Uganda [29,30].
f) Groundwater discharge: The study area is so close to Lake Victoria and one would assume a certain level of groundwater – Lake water (G-S) interaction. It was however practically impossible to establish the hydraulic connection of the two system though [47] through Darcy flow calculations concluded that direct contributions from groundwater to Lake Victoria comprise <1% of the total lake inflows. Considering the small size of the study area, the Groundwater- Lake water interaction and the discharge from the aquifers through seepages along the river banks were considered to fall under the natural groundwater flow from the area.
g) Groundwater flow system: The conceptualization of how and where water originates in the groundwater flow system and how and where it leaves the system is critical to the development of an accurate model [48,49].
As pointed out by different researcher’s [6] regional groundwater flow in the crystalline rock environments is mainly controlled by regional structures for instance faults and lineaments while local flows are controlled by the topography, geology and sometimes degree of fracturing. The mean annual rainfall fed groundwater recharge in the entire Uganda was estimated to be 120mm/year. Basing on this information and the 3 year daily rainfall record of the study area (Figure 3), the mean annual rainfall recharge of the study area was estimated to be 112 mm/year.
The direction of groundwater flow in the area was, however, deduced using calculated hydraulic heads obtained from the initial groundwater levels of each borehole at the time it was drilled. Ground water in the area generally flows from the Northern to the Southern direction. The calculated hydraulic heads were also used in setting the initial conditions for the numerical groundwater modeling. Hydraulic heads were calculated by subtracting Static water level depth (mbgl.) from borehole depth (m).
h) Graphical representation of the conceptual model in the real world: In this aspect, Anderson and Woessner [31] suggested that he conceptual model should be simplified as much as possible while it still remains complex enough to represent the system behavior. In Figure 10, the simplifying assumptions were considered that represented the hydrogeological conceptual model of the area as:
i. The geological formations of concern are considered horizontal.
ii. There is no groundwater inflow from the adjacent sub-basins.
iii. The aquifer system is fully penetrated and saturated.
iv. A 48 m of average aquifer thickness was considered.
The generated conceptual model is regarded as an approximation of the field conditions though useful in obtaining the preliminary hydrogeological information of the area subjected to refinement
Determining the sustainability of groundwater abstraction: The solution for this problem was implemented using numerical modelling approach where simulations of various abstraction and recharge scenarios were performed. The response of the groundwater system to rainfall recharge and abstraction (pumping from boreholes) was presented in form of hydraulic head variations/changes over a given period of time considering that hydraulic head changes due to other discharge and recharge process in the area are negligible.
Three years (2013-2015) weekly monitoring data for groundwater levels belonging to boreholes within the well field were used in this study (DWD 17468, DWD 17465 and DWD 25940).
Model code selection: The selected model code was MODFLOW which is a modular three-dimensional finite-difference groundwater flow model and is based on the flow equation of Darcy and mass continuity equation. MODFLOW numerically uses block-centered finite differences to solve the flow equations in three dimensions. The modules are grouped into packages and each package deal with a specific hydrogeological feature to be simulated. MODFLOW was selected because it is one of the most widely used groundwater flow code in hydrogeological studies, is extensively tested in various environments under different conditions and the theory behind it is well documented and relatively easy to understand. MODFLOW was as well considered for this study based on its relationship with the GMS software that has been used to model ground flow in Kawempe III parish, nearest to my study area (about 15 Km) off. The governing partial differential equation 1 in which MODFLOW is based on, is given below [50].
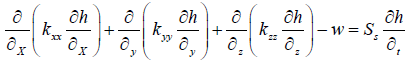 (1)
(1)
Where;
kxx , kyy , kzz represents hydraulic conductivity along x, y and z coordinate axes (LT−1) , which are assumed to be parallel to the major axes of hydraulic conductivity, h represents the potentiometric head (L), W is flux per unit volume representing sources and/or sinks of water(T-1) SS represents the specific storage of the porous material (L−1) and t is time. For consideration of the present study, a two-dimensional model was adopted hence the third component of the equation goes to zero.
Model geometry and model thickness
The horizontal extent of the model domain was 5 Km by 4 Km length. It’s bounded by UTM coordinates: 464659E/52102N, 458044E /46561N, 469057E/33436N and 478269E/40466N (Figure 1) in the introduction. The model covers an estimated area of about 20 square kilometers with a constant layer of average thickness of 48 meters considered.
Model design
By simplifications and assumptions of the actual field condition, the model area was discretized to one layers with a regular grid of (250 m by 250 m, 32 rows by 82 columns) consisting of 1492 active cells.
Model boundaries: The expression applied for the head dependent flow in the general head flow boundary in equation 2 is:
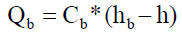 (2)
(2)
Where;
Cb = Hydraulic conductance of the boundary (L2T −1)
hb = Hydraulic head at or beyond the boundary (L)
h = Hydraulic head in the aquifer (L)
The Northern, Western and Eastern boundaries of the model area are generally high relief features/ridges that are assumed to hinder local groundwater inflow into and out the well field and were assigned to be no flow boundaries. Namanve stream cuts through the well field and flows north wards of the model area. There was lack of discharge data for this stream that hindered determining the river-groundwater interaction for various stress periods. For the purpose of modelling, it was assumed that all other indirect discharge and recharge sources e.g. drains reservoirs are integrated in the areal estimated rainfall recharge and borehole abstraction respectively.
Initial conditions: For this case, the static water level records of the wells are averaged within the model to obtain the initial hydraulic heads for the entire model.
Representation of aquifer parameters: The vertical and horizontal hydraulic conductivity of the model area was assumed to be uniform at 0.1756 m day-1 and transmissivity at 3.275 m3day-1. Storativity or Storage coefficient was estimated to be 0.004 while specific yield was calculated to be 10% of the Specific storage.
All these parameters were assigned based on pumping test and MRS analysis results of this study in relation to previous studies done in similar environments near or far from the study area [6,51]. Later all aquifer parameters were adjusted during the modelling process in order to match the observed water levels in the area.
Observation wells: It was hardly possible to obtain a continuous time series monitoring groundwater level data for an independent observational well within in the study area. The three observation boreholes that provided groundwater level monitoring data were as well pumping wells. This implies that the groundwater level data might have been affected by the transient effect of the pumping at the time of water level measurements. Details of the above three wells are highlighted in Table 2. The data of these wells were fed in the model software creating a BOR and OBS file types as described in PMWIN 5.6 manual.
| S/N | Xcord | Y cord | ID NO | Operator | Permit No | Daily vol (m3d-1) |
|---|---|---|---|---|---|---|
| 1 | 468208 | 40526 | DWD15844 | Ridar Hotel Ltd | MN0100717/2GW1DW 2009 | 30 |
| 2 | 466400 | 38195 | DWD 38183 | Roofing Rolling Mills LTD | MNO200940/3WDIDW 2012 | 56 |
| 3 | 466348 | 382% | DWD 35578 | Roofings Rolling Mills Ltd | MPGI0C077/2GWDDW 2000 | 6 |
| 4 | 466317 | 38137 | DWD 38184 | Roofings Rolling Mills Ltd | MNO200940/2GWIDW 2011 | 56 |
| 5 | 466509 | 38256 | DWD 35578 | Roofings Rolling Mills Ltd-DWD 35578 | MNO201110/26W1DW 2013 | 64 |
| 6 | 466502 | 4.00E+05 | DWD 38183 | Roofings Rolling Mills Ltd - DWD 38183 | MNO201111/2GWIDW 2013 | 32 |
| 7 | 466581 | 38213 | DWD 38184 | Roofings Rolling Mills Ltd - DWD 38184 | MNO201109/2GWIDW 2013 | 48 |
| 8 | 466369 | 38042 | DWD 39095 | Roofings Rolling Mills Ltd - DWD 39095 | MNO201116/2GWIDW 2013 | |
| 9 | 466218 | 38213 | DWD39097 | Roofings Rolling Mills Ltd - DWD 39097 | MNO201129/2GWIDW 2013 | 48 |
| 10 | 466400 | 38195 | DWD 17468 | Rvienzori Bottling Co. Ltd | MN0100664/2GWIDW 2011 | 1001 |
| 11 | 466348 | 382% | DWD 17465 | Rwenzod Bottling Co. Ltd | MN0100810/2GWIDW 2010 | |
| 12 | 466317 | 38137 | DWD 34040 | Rvienzori Bottling Co. Ltd | KLA102109/2GWIDW 2011 | 208 |
| 13 | 458747 | 37259 | DWD25940 | Rbsenzori Bottling Co. Ltd - Namanve | MNO200339/2GWIDW 2004 | 3601 |
| 14 | 458747 | 37259 | DWD25941 | Rvienzori Bottling Co. Ltd-Namanve | MN01339/2GWIDW 2011 | 360 |
| 15 | 466099 | 40185 | DWD 33678 | Rvienzori Bottling Co. Ltd DWD 25940 | MN0101664/2GWDW 2013 | 100 |
| 16 | 465139 | 40031 | DWD 30370 | Century Bottling Ca Ltd | MN0100904/26W1DW 2011 | 403 |
| 17 | 465139 | 40031 | DWO 30369 | Century Bottling Co. Ltd | MN0100903/2GWIDW 2011 | 38 |
| 466674 | 40319 | DWD 24720 | VERO Foods | MN0100904/2GW1DW 2012 | 130 | |
| 18 | 466314 | 40273 | DWD 24195 | lorrayi Property Consultants Ltd | MN0100720/2GWDDW 2009 | 418 |
| Total Volume | 2,571 | |||||
Table 2: Details of regulated groundwater abstraction in Namanve well field.
Borehole abstraction: Three-year daily abstraction monitoring data was available from three boreholes (DWD 17468; DWD 17465 and DWD 25940). But the total number of regulated abstraction boreholes in the area is 18 boreholes (DWRM permits data base 2014 and Table 2). Each of these boreholes has its own permitted daily maximum volume of abstraction. Considering the permitted maximum volume at each borehole in comparison with the threeyear daily abstraction records at the above named three boreholes, the average maximum daily abstraction from all the 18 regulated boreholes in the well field was estimated to be 2571 m3 day-1. The three boreholes that have abstraction data were defined in the MODFLOW well package and were used to represent all other the pumping wells. Abstraction of groundwater was assigned to the model as negative and it was assumed that the wells were fully penetrating.
Recharge: Rainfall data was used to generate recharge for a period 2013-2015. A daily rainfall threshold of 10 mm and above was considered because it was assumed to be the minimum amount required to overcome evaporation and interception for recharge to occur and also spark runoff. This method was in accordance with the previous work done in Uganda where it was established that rainfall events greater than 10 mm are considered to influence recharge [12,29]. Therefore, this study used 10% recharge from rainfall amounts greater than 10 mm in the years 2013-2016.
Model calibration
In this case, the field measurements were the observed water levels at the three abstraction/observation boreholes and the target was to match water levels calculated by the model with those measured at the boreholes. However, the field measured heads were definitely associated with some major errors to note:
a) The static water level measurements used to calculate the heads are normally taken just after well completion without stabilization.
b) There were no independent monitoring wells, the water level observations data used came from pumping wells.
c) Measurement errors related to measuring instrument accuracy and operator errors.
The combined effect of these errors was assumed to result in a maximum of 15.0m difference between the observed and calculated water levels. The modeling was carried out for the scenarios of nonpumping and pumping.
Correlation graphs: A scatter plot of observed water levels against simulated water levels is one way of showing the model fit. The scatter plots are visually examined whether points in a plot deviated from the straight line in a random distribution. Deviation of points from the straight line should be randomly distributed.
Sensitivity analysis: The sensitivity analysis was performed by systematically changing one calibrated parameter at a time while noting the observed changes in hydraulic heads. A number of sensitivity analyses were conducted to test the effects on model results due to changes in input parameters or boundary conditions. The values of these input variables e.g. recharge and hydraulic conductivity were multiplied by factors of 0.5, 0.8, 1.1, 1.2 and 1.5. The resulting hydraulic heads for each scenario were graphically compared (Figure 14). The magnitude of change in water levels from the initial model results was the measure of the sensitivity of the model to that particular parameter.
Model validation: Unfortunately, it was impossible to validate a model because usually too short set of observed state data was available, which was already used for calibration. For this reason, model validation was not accomplished in this study.
Simulation of groundwater abstraction in the area: This was done by trial and error modelling where aquifer hydraulic parameters were varied while comparing the simulated heads to those initially observed in wells. During this process, the hydraulic conductivity, recharge and boundary conditions were modified manually, and trial runs were carried out until the model output (hydraulic heads) were within the range of a reasonable error.
The best fit results were achieved when the estimated recharge value was reduced by 4.5% while hydraulic conductivity values applied in this state was 0. 25 m day-1. During the pumping scenario, three boreholes that belong to Rwenzori Bottling Company, one of the leading groundwater abstractors in the area were added to the model. The current average abstraction rates per day at each of these boreholes was considered as the initial pumping rate for the pumping scenario. Values for recharge and hydraulic conductivity obtained in the initial non-pumping scenario were maintained. In order to establish the effects of increased groundwater abstraction on the water levels in the area, abstraction at the above three boreholes was gradually increased up to 500% while monitoring the change in the output (simulated water levels). The expected response signal to sustainable groundwater abstraction was considered to be either stable or decreased of the simulated water levels. The maps of spatial distribution of the simulated hydraulic heads for the non-pumping and pumping scenarios are shown in Figure 11 and Figure 12 respectively.
Results
Analysis of the borehole drilling logs and electrical resistivity data
Analysis of the archived drilling logs from 12 boreholes distributed across the study area using ARC GIS v10 generated a 2D cross-section of the stratigraphy of the study area (Figure 4). The cross section was interpreted to consist of two major zones of weathering that include the upper zone also called the saprolite and the lower zone also called the sap rock.
The saprolite has inconsistence occurrences of the following lithological units: top soils, sands, clays and laterites units while the sap rock consists mainly the weathered granitic rock. At the base of the above weathering profile, there is a fractured granitic rock and is present at most of the boreholes considered in the study. The bottom layer of the profile was interpreted to be a massive granitic rock and only a few boreholes were drilled up to the depth of this rock unit (DWD 21777; WDD 25940; DWD 18300 and DWD 21827).
The eastern part of the cross section area represented by boreholes in Seeta, Mukono and Mbalala shows fairly uniform and continuous distribution of lithological units (clays, weathered granitic and the fractured granitic rocks). The western part of the cross section area is represented by boreholes in Bweyogerere and Namanve areas that shows increased vertical and horizontal variation in the lithological units e.g. the laterites and sands in boreholes (WDD25940 and DWD 2177). Surface water levels (SWL) and borehole construction details obtained from the borehole logs information indicate that the weathered granitic rock and the fractured bedrock are the main saturated geologic units in the area.
Groundwater in these units (aquifers) occurs under confined and semi confined conditions mainly because of the presence of the semi impervious clay and laterite units and percolates from the upper weathered zone aquifer into the lower fractured zone aquifers. The main aquifer storage in the area appear to be confined in the fractured bedrock zone because all boreholes in the area have been drilled to a depth below the upper weathered zone/aquifer. The massive and impermeable granitic bedrock below the fractured zone acts as a barrier to vertical groundwater percolation in the area.
Correlation of borehole drilling logs and geo-electric resistivity (VES) data interpreted using 1x1D v3 software at three borehole sites (DWD 18300; DWD 30368 and DWD 30283) delineated three major stratigraphic units in the well field (Figures 5, 6 and 7). The top stratigraphic layer ranges from (~5 to ~10 mbgl) and most times consists of thin inter-beds/layers of top soils, clays, sands and laterites that display one to three micro-layering in the VES model.
This layer has an averagely low apparent resistivity ranging from 10 to ~80 Ω-m. The next stratigraphic layer ranges from (~12 to ~65 mbgl) with a slightly low apparent resistivity ranging from ~30 to ~150 Ω-m. This layer may be interpreted to consist of the saturated weathered and fractured bed rock units hence the low recorded apparent resistivities. Lastly is the bottom layer that has a very high apparent resistivity (above 1,000 Ω-m) and corresponds to the massive and impermeable bedrock of igneous origin that occurs at an average depth of ~60m but its thickness could not be specified by the VES layer model.
Hydraulic properties of aquifers
Pumping tests data analysis: Pumping test data was analyzed using AQUISOLVE software to generate aquifer hydraulic properties e.g. transmissivity and storage coefficients for the aquifers in the area. Pumping of most wells caused a greater influence on the draw down in the first few minutes of pumping but the influence generally reduced with increasing duration of pumping (Figures 8 and 9). This effect caused the draw down response curves deviate from the perfect confined aquifer drawdown type curves as presented by Theis [52] much as the studied hydro-stratigraphy of the area was indicative to confine or semi confined aquifer conditions. For this reason, effects of boundary conditions e.g. specific head boundaries such as adjacent surface water bodies and leakages within the penetrated formations [21,53] were assumed. Field observation from the study area confirmed the above assumption where the presence of minor streams e.g. River Namanve were noted in the area. Basing on this background knowledge, several AQUISOLVE aquifer analytical solutions were fitted to test the suggested hypothesis but aquifer solutions that take into account well bore storage effects and leaky conditions were mostly adopted to represent the response of the aquifers in the area.

Figure 9: Rwenzori 1 : Leakey Aquifer solution - Neuman-Witherspon.
Table 3 presents the hydraulic parameters obtained from different model curve matching fits. Since there were several models that could try to fit the observed data within a given uncertainty range, the values for the best match fit for each pumping test data set has been presented.
| Boreholes | Pumping test data records |
Aquifer properties | Best matching Pumping test Solution |
Aquifer zone |
||||
|---|---|---|---|---|---|---|---|---|
| No. | Location | Rate (m3/h) |
Duration (hours) |
T (m2/day) |
K (m/day) |
S | ||
| Namanve | ||||||||
| 1 | Rwenzori1 | 3.4 | 72 | 0.610 | 0.0145 | 0.00034 | Neuman (1969) | RF |
| 2 | Rwenzori 2 | 5.5 | 72 | 1.320 | 0.0307 | 0.00091 | Neuman (1969) | RF |
| 3 | Rwenzori 3 | 3 | 72 | 0.760 | 0.0107 | 0.00006 | Papadopoulos | F |
| 4 | Roofings 1 | 3 | 72 | 10.34 | 0.5574 | 0.0011 | Theis (1935) | RF |
| 5 | Roofings 2 | 3 | 72 | 0.728 | 0.0234 | 1.78 × 10⁻⁵ | Neuman (1979) | F |
| 6 | Sai Bev. | 2 | 69 | 0.867 | 0.196 | 0.00069 | Moench (1984) | F |
| 7 | Cent Bott 1 | 22.38 | 72 | 23.36 | 0.865 | 0.00042 | Cooper-Jacob (1946) | RF |
| 8 | Cent Bott2 | 2.12 | 72 | 0.4917 | 0.00983 | 0.00981 | Papadopoulos | F |
| 9 | Vero Bev | 6.5 | 72 | 5.656 | 0.1824 | 1.21 × 10⁻⁷ | Moench (1984) | RF |
| Mukono | ||||||||
| 10 | Fore Front | 2.05 | 18 | 1.514 | 0.0378 | 0.00426 | Papadopoulos (1967) | F |
| 11 | Boss Bev | 1.01 | 12 | 0.8097 | 0.026 | 0.00117 | Papadopoulos (1967) | F |
Key = RF- Regolith and fracture rock aquifers, F-Fractured rock aquifers
Table 3: Summary table of aquifer hydraulic properties in the study area.
The aquifers in the area presented generally low values of aquifer hydraulic properties that varied in a non-uniform mana. The current mean transmissivity values of the study area was estimated to be about 3.275 m2 day-1 while the mean hydraulic conductivity (calculated from the equation:  where: K = Hydraulic conductivity, T = Transmissivity and b = Aquifer thickness) was estimated to be 0.0574 m2 day-1. The Average Storativity or storage coefficient generated from the AQUISOLVE software was 0.004 but was further refined using of MRS method.
The low values of aquifer hydraulic properties and their nonuniform variation respectively suggest low primary porosity and geologic heterogeneity in crystalline rock aquifers as suggested by Chilton and Foster [22]. The obtained hydraulic parameters closely match with values estimated by Tindimugaya [6]. However, the same parameter values are quite higher than those suggested in in other parts of Uganda with similar geological environments [5,54].
Aquifer storage parameters using MRS
Aquifer storage of the upper weathered zone mainly rely on rainfall recharge while the fractured lower bedrock aquifers partly rely on the vertical leakage from the weathered overburden [6], but also from the horizontal flow through the interconnected fracture system. MRS raw data for one sounding site within the study area was used alongside pumping test data to estimate the aquifer storage in the area. The interpreted MRS results at this site were parametrized (Table 4) using pumping test data for a borehole adjacent to the sounding site hence aquifer storage was determined (Table 6).
| Estimated MRS Parameters | |||
|---|---|---|---|
| ΔZ (m) |
θ% | T2* (ms) |
(T2*)2 (ms) |
| 24.1 | 6.1 | 70 | 4900 |
Table 4: Summary of the estimated MRS parameters at roofing rolling mills site.
| Estimated MRS Parameters | Estimated pumping test Parameters | |||||
|---|---|---|---|---|---|---|
| ΔZ (m) |
θ% | T2* (ms) |
(T2*)2 (ms) |
T (m2s-1) |
S | Sy |
| 31 | 6.1 | 70 | 4900 | 9.125 × 10⁻⁶ | 1.631 × 10⁻⁵ | 0.04093 |
ΔZ is the aquifer transmissivity, θis the water content in % volume,T2 is the decay time of the MRS signal.
Table 6: Summary of both MRS and pumping tests results at roofing.
Interpreted pumping test data for a borehole adjacent to the MRS sounding site: The pumping test data was for a period of 72 hours and was interpreted using AQTESOLTM/Pro V4.5 software and results are presented in Table 5 below.
| Aquifer property | Aquifer solution | Average | |
|---|---|---|---|
| Leakey | Unconfined | ||
| Transmissivity (m2s-1) | 1 × 10⁻⁵ | 8.425 × 10⁻⁶ | 9.125 × 10⁻⁶ |
| Storativity | 1.477 × 10⁻⁵ | 1.786 × 10⁻⁵ | 1.631 × 10⁻⁵ |
| Specific yield (%) | - | 0.04093 | 0.04093 |
Table 5: Summary of pumping test data interpretation at roofing rolling mills.
Calculation of un-parametrized MRS aquifer parameters:
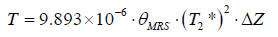
MRS Transmissivity is given by: 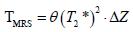
0.061×(0.7)2 ×31 = 0.9269ms2
MRS Storage is given by: 
0.061 × 31=1.891
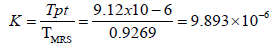
Parametrizing of the MRS results using pumping test results
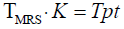
where; TMRS is MRS Transmissivity, K is Constant, Tpt is pumping test transmissivity.
Comparison of MRS and pumping test results: The estimated TMRS Sy MRSand compares closely with the transmissivity and the specific yield estimated from pumping test (Table 7).
| Method | Aquifer parameters | |
|---|---|---|
| Transmissivity (m2s-1) | Specific yield | |
| MRS | 9.116 × 10⁻⁶ | 0.04093 |
| Pumping test | 9.125 × 10⁻⁶ | 0.04093 |
| Relative difference | 0.01 % | 0% |
Table 7: Comparison of MRS and pumping test results.
The major limitation of these results was the unfavorable MRS noisy conditions in the area that hindered carrying out more soundings at any other suitable location in the area hence a more accurate link between MRS measurements and pumping tests in the study area could not be achieved due to the limited number of MRS sounding sites.
Calculating the estimated MRS aquifer storage
MRS storage = Sy. .ΔZ

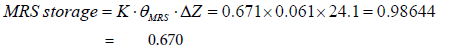

Hence,MRS Storage = 986.44mm
Comparison of MRS results in Uganda and Benin under same geological environment: Vouillamoz [51] used numerous data sets from MRS and pumping test results in the basement rocks of western Africa (Benin) to estimate aquifer hydraulic properties and he has defined the relation between the two sets of data using equations (3) and (4)
 (3)
(3)
 (4)
(4)
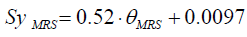
Using equation (1), Sy MRS at Roofing Rolling Mills can be calculated as;
Sy MRS = 0.52 0.061 0.0097 0.0414
Using equation (1), Sy MRS at Roofing Rolling Mills can be calculated as;
TMRS = 3×10-9 ×0.061×0.49×24=2.1×10⁻⁹
Using equation (2) TMRS at Roofing Rolling Mills can be calculated as:
TMRS = 3×10-9 ×0.061×0.49×24=2.1×10⁻⁹
Comparison of the MRS results in Uganda and Benin
In comparison of Uganda to the Benin scenario, the MRS results of this study presented a certain degree of linkage with pumping test results that can be improved by carrying out more MRS measurements in the study area in order to confirm the conclusion (Table 8) above.
| Method | Aquifer parameters | |
|---|---|---|
| Transmissivity (m2s-1) | Specific yield | |
| MRS Uganda-calculated | 9.116 × 10⁻⁶ | 0.04093 |
| MRS-Benin equation | 2.1 × 10⁻⁹ | 0.0414 |
| Relative difference | 9.76% | 1.135% |
Table 8: Figures of MRS results in Uganda and Benin.
Model Conceptualization
Despite of the heterogeneous hydrogeological conditions in the area, a simplified conceptual hydrogeological model (Figure 10) of the area was developed on the basis of information from the geology, hydrogeology and hydrology. The model was however based on a number of assumptions in order to reduce the real hydrogeological system into a simplified version but acceptable in view of its validity to represent the important hydrogeological conditions and the objectives of the study.

Figure 10: Conceptual model of the area.
Demonstrating sustainability of groundwater abstraction in the area
This was undertaken by simple numerical modelling. The main output of the of the numerical modelling was simulated ground water levels under variable major input parameters conditions that include; rainfall recharge and pumping rates. The response signal for sustainable groundwater abstraction was either stable or decreased simulated groundwater levels. Stability of the simulated groundwater levels indicated sustainability of groundwater abstraction in the area while the decrease in the simulated groundwater levels indicated vise-versa. The maps of spatial distribution of the simulated water levels for the non-pumping and pumping scenarios in Namanve area are shown in (Figures 11 and 12) respectively. The results are also graphically presented as comparisons of the observed and simulated hydraulic heads in both cases of non-pumping and pumping scenarios (Figures 13 and 14).

Figure 11: Distribution of hydraulic heads with non-pumping scenario.

Figure 12: Distribution of hydraulic heads with pumping scenario.

Figure 13: Correlation of the observed and simulated heads in the pumping scenario DWD 25940.

Figure 14: Sensitivity model with respect to recharge and hydraulic conductivity variations.
The modelling results shows that most of the simulated heads were within the pre-established calibration target and the overall results of the groundwater model are comparable with the measured well data and in agreement with conceptual model.
Model sensitivity graphs: It was found out that slight changes in rainfall recharge rate affected the distribution of water levels in the model more as compared to the hydraulic conductivity hence the model is more sensitive to recharge fluxes than hydraulic conductivity changes (Figure 14).
Groundwater budget: The input term to the groundwater considered for the present study is a direct recharge from rainfall. The output terms considered are well withdrawals and head dependent, groundwater flows out of the aquifer system through the southern boundary. The groundwater flow budgets calculated by the model for the non-pumping and pumping scenarios are indicated in Table 9 and Table 10 respectively.
| Flow Term | In (m3/day) | Out (m3/day) | In-Out (m3/day) |
|---|---|---|---|
| Head dependent flow through the southern boundary | 0 | 15039 | -15039 |
| Wells | 0 | 0 | 0 |
| Recharge | 15039 | 0 | 15039 |
| Total | 15039 | 15039 | 0 |
Table 9: Simulated groundwater budget for non- pumping scenario.
| Flow Term | In (m3/day) | Out (m3/day) | In-Out (m3/day) |
|---|---|---|---|
| Head dependent flow through the southern boundary | 0 | 14514 | -14514 |
| Wells | 0 | 525 | -525 |
| Recharge | 15039 | 0.0000 | 15039 |
| Total | 15039 | 15039 | 0 |
Table 10: Simulated groundwater budget for pumping scenario.
Model predictions
Scenario groundwater level simulations were undertaken by increasing the monthly abstraction rates at each well by 20%, 50%, 100%, 200% and 500% while maintaining all other parameters constant. Significant change (decrease) in the water levels was not realized until the pumping rate at the wells was increased up to 500% of the current monthly pumping rate. The resulting water levels generated from this simulation is indicated in Figure 15.

Figure 15: Distribution of hydraulic heads at 500% increase in the abstraction rate at the wells.
In this scenario, decrease in the hydraulic head was calculated to be 10%. The abstraction rate at which lowering of groundwater levels started indicates that there is still a high potential of groundwater abstraction in the area without causing any serious stressful conditions.
Reliability of the model results: There are several indicators that the overall result of the model developed are realistic.
a) There is a minimal deviation of the simulated heads from the observed heads.
b) The model calculated inflow and outflow terms are balancing.
c) Groundwater flow direction simulated by the model is reasonable and in agreement with the flow direction defined in the conceptual model.
Limitations of the model: Nevertheless, there are a number of limitations and uncertainties because numerical models are basically limited in their representation of the physical groundwater flow system. The built model of this research can therefore be associated with uncertainties such as; the hydro geological heterogeneity that caused difficulties in the conceptual simplification of the field conditions due to lack of detailed description of the heterogeneity. Assumptions and simplifications were therefore made during the conceptualization of the system. Definitely there were uncertainties that were introduced in as the result of these assumptions and simplifications because various forms of heterogeneity in the porous media can have different fluid flow behavior in the individual zones [55]. There were generally few locations where hydrogeological observations were available and the geological structure of the aquifer was only partially known. Groundwater abstraction in the area is poorly documented and the little recorded data has quite a number of inconsistencies. The operating periods of the boreholes are also not well known; thus, it was difficult to get the accurate borehole abstraction rate from the area.
Lack of proper site characterization could also have resulted in a model that does not representative the actual field conditions. Other main constraints include; data gaps and poor quality of the available data.
The data which have a key role in defining the model geometry (screen length and aquifer thickness) are not well documented. The available records of the water level measurements were continuous for only 3 years and were highly associated with measurement errors.
There was no sufficient independent data for model calibration or validation. Defining the boundary conditions of the model domain also presented uncertainties because it was done based on physical features in the area, yet the extent of the well field/sub catchment may not coincide with the surface expressions of these features.
The lack of model input data e.g. the base flow through the aquifer, evapotranspiration and runoff may also contribute to a number of uncertainties. The area was conceptualized as a single layer assuming impermeable basement rock at the base of the layer. In reality, this may not be true because the bottom of the layer may be partially pervious due to localized fractures.
Conclusion
Sustainability of grounwater abstraction in the area was investigated by use of combined methods of hydrogeoloical data analyses and numerical modelling. The study noted that stratigraphy of the area is highly heterogeneous in both lateral and vertical extent and is made up of permeable and less permeable geologic units that include, top soils,sands, clays, laterites and fractured/fresh granitic rocks. The area has two aquifers systems the top aquifer that occurs in the wethered overburden and the lower aquifer that occurs in the fractured bedrock. The latter aquifer is the main/ principal aquifer in the area as it was noted that all boreholes in the area were drilled up to its depth despite of the initial water strikes encountered in the top aquifer system. The occurrence of the impermeble and semi permiable layers in the stratigraphical sequency of the area presented both confined and semi confined aquifer systems in the area. In response to the geological heterogeneity, broad ranges of aquifer parameters (transmissivity and hydraulic conductivity) are reported from the results of pumping test analysis. However, in a general sense, the area is characterised by low values of hydraulic parameters as a result of low porosity values in the crystalline basemet rocks. Despite of the heterogeneous hydrogeological condition in the area, a simplified conceptual hydrogeological model of groundwater system was constructed and was implemented in the numerical modelling within the same study. A numerical groundwater flow model was developed a non-pumping and pumping scenarios to assess the groundwater resource sustainability in the area.
The model simulated a mean annual recharge of 42 mm year-1. The accuracy of the model recharge is dependent on annual recharge values obtained by other authors in Uganda. A steady-state groundwater flow modeling has demonstrated that an average recharge of 42 mm year-1 maintains the natural equilibrium. On the other hand, the model results with pumping scenario show that the current estimated groundwater abstraction of 2175 m3 day-1 in the area has resulted in a groundwater level decline of up to 38.3 meters in the well field and the decline will increase with increased abstraction.
Further Study Areas
This preliminary research forms a good starting work for detailed groundwater water assessment in the study area. With additional data, further refinement of this research is possible and can be expected to improve the accuracy of the results. Therefore, extensive field-based hydrological and hydrogeological data acquisition and observations using various geological and geophysical techniques are necessary in order to delineate a detailed hydrogeological framework for the study area. Furthermore, groundwater modelling in the area under study require detailed geological structural mapping in order to characterize the aquifer systems in the area and re-define the boundary conditions. In the present study, only the deeper aquifer system is modeled as there is no data for the shallow aquifer system, thus future studies should consider the upper aquifer system and study the relation between the two aquifer systems together with the regional groundwater flow in the area. The hydraulic conductivity and recharge to which the model is highly sensitive requires better future refinement and finally the cell size applied in the discretization of the model domain (250 m by 250 m) is not small enough to adequately represent the drawdown in the wells. Thus, the model can be further improved by integrating additional data and by applying finer grids in the pumping areas.
Finally, I do advise in considering the following actions in relation to groundwater resources development in the well field: Future actions on groundwater resource development plans in the well field should take into account the balance between the groundwater recharge and the intended abstraction rates to ensure the sustainability of the resource in the catchment; and In order to reduce the groundwater stress resulting from localized pumping, drilling of boreholes should be evenly be distributed within any area under study.
Acknowledgements
The author is grateful to the material support from Kyambogo University for the provision of space and time to conduct this research. The technical assistance from the Ministry of Water and Environment under the Directorate of Water Resources Management, Entebbe, Mukono District Water Office for provision of drilled data of the boreholes, MET Department Kampala for provision of rainfall and temperature data. All these contributions are greatly appreciated.
References
- Freeze RA, Cherry JA (1979) Groundwater; Prentice-Hall, Inc. Englewood Cliffs, New York, USA. pp: 604.
- Morris B, Lawrence ARL, Chilton PJC, Adams B, Calow RC, et al, (2003) Groundwater and its susceptibility to degradation: A global assessment of the problem and options for management 2: 1.
- USGS Professional Paper (2013) Global groundwater availability 1766: 225.
- MacDonald A, Davies J, Calow R, Chilton J (2005) Developing groundwater: A guide for rural water supply; ITDG Publishing pp: 301-358.
- Taylor RG, Howard KWF (1998) Post-Palaeozoic evolution of weathered land surfaces in Uganda. by tectonically controlled deep weathering and stripping. Geomorphology 25: 173-192.
- Tindimugaya C (2008) Groundwater flow and storage in weathered crystalline rock aquifer systems of Uganda: Evidence from environmental tracers and aquifer responses to hydraulic stress. Unpublished Ph.D. Thesis. University College London, London, UK. pp: 157
- Tindimugaya C (2005) Maximizing the benefits from water and environmental sanitation: Groundwater resources management in urban areas of Uganda; experiences and challenges. Proceedings of 31st WEDC International Conference, Kampala, Uganda.
- WSP/NWSC (2008) Identification of management options for improved water and sanitation services in informal settlements in Kampala, Situational Assessment Report for Water and Sanitation Programme. National Water and Sewerage Corporation pp: 140.
- DWRM (2015) Water and environment sector Performance Report 2015 Permits Data Base.
- Batte A, Muwanga A, Sigrist P, Wowor M (2008) Vertical electrical sounding as an exploration technique to improve on the certainty of groundwater yield in the fractured crystalline basement aquifers of eastern Uganda. Hydrogeology Journal 16: 1683-1693.
- Batte A, Barifaijo E, Kiberu JM, Kawule W, Muwanga A, et al. (2010) Correlation of geoelectric data with aquifer parameters to delineate the groundwater potential of hard rock terrain in central Uganda. Pure Appl. Geophys 167: 549-1559
- Owor M, Taylor RG, Tindimugaya C, Mwesigwa D (2009) Rainfall intensity and groundwater recharge: Empirical evidence from the Upper Nile Basin. Environ. Res Lett 4: 035009.
- Brassington R (1998) Field hydrogeology (Second edition) Wiley & Sons, Chichester pp: 372
- Jusseret S, Vu TT, Dassargues A (2009) A groundwater flow modelling in the central zone of Hanoi, Vietnam, Hydrogeol J 17: 915-934.
- Fetter CW (2001) Applied hydrogeology, Visual Modflow, Flownet and Aqtesolv student version software on CD - ROM (4th edn). Upper Saddle River: Prentice Hall.
- Scanlon BR, Mace RE, Barrett ME, Smith B (2003) Can we simulate regional groundwater flow in a karst system using equivalent porous media models? Case study, Barton Springs Edwards aquifer, USA. Hydrogeol J 276: 137-158.
- Ministry of Local Government (2007–2008) Uganda Districts Information Handbook, Expanded edition
- DWRM (2014) Mapping of groundwater resources in Uganda: Mukono district groundwater report, Kampala. European Union Water Facility pp: 67.
- Mukono District (2009). Five-year District Investment Plan, 2009-2014; Ministry of Local Government, Unpublished Report pp: 212.
- Biryabarema M (2001) Groundwater contamination and the role of geologic strata in retaining pollutantants around waste disposal sites in greater Kampala. PhD thesis, Makerere University, Kampala, Uganda.
- Davis NS, De-Wiest JMR (1966) Hydrogeology. John Wiley Sons, New York, USA. pp: 428.
- Chilton PJ, Foster SSD (1995) Hydrogeological characterization and water supply potential of basement aquifers in tropical Africa. Hydrogeol J pp: 36-49.
- Taylor RG, Barrett M (1999) Urban groundwater development in sub-Saharan Africa. IN: Pickford, J. (ed). Integrated development for water supply and sanitation: Proceedings of the 25th WEDC International Conference, Addis Ababa, Ethiopia pp: 203-207.
- Chilton PJ, Smith-Carrington AK (1984) Characteristics of the weathered basement aquifer in Malawi in relation to rural water supplies. Presentation on Challenges in African Hydrology and Water Resources Symposium, IAH Series Publication 144: 15-23.
- Houston FT, Lewis RT (1988) The Victoria Province drought relief project II; Borehole yield relationships; Groundwater 26: 418-426.
- Howard WFK, Arundu J (1992) Constraints of the development of basement aquifers in East Africa- water balance implications and the role of the regolith. J Hydrol 139: 183-196.
- Howard AD (1994) Bad lands in Geomorphology of Desert Environments, Edited by A. Abrahams and A. Parsons, Chapman and Hall, London pp: 213-242.
- Taylor RG, Howard WFK (1999) Lithological evidence for the evolution of weathered mantles in Uganda by tectonically controlled cycles of deep weathering and stripping. Catena 35: 65-94.
- Taylor RG, Howard WFK (1996) Groundwater recharge in the Victoria Nile basin of East Africa: support for the soil-moisture balance method using stable isotope and flow modelling studies Hydrogeol J180: 31-53.
- Tindimugaya C (2000) Assessment of groundwater development potential for Wobulenzi town,Uganda. Unpublished MSc, UNESCO- IHE, Deft, The Netherlands.
- Anderson MP, Woessner WW (1992) Applied groundwater modelling: Simulation of flow and Adjective transport. San Diego: Academic Press 15: 167-173.
- Yuri M, Christopher G, Henkar U (2004) Development and Application of a MODFLOW preprocessor using percolation theory for fractured media. J Am Water Resour Assoc 40: 229–239.
- Nyende J, Vermeulen VTG (2013) Conceptual and numerical model development for groundwater resources management in a regolith-fractured-basement aquifer system. J Earth Sci Clim Change 4: 156.
- Klismas A, Gregorauskas M (2002) Groundwater abstraction and contamination in Lithuania as geoindicators of environmental change. Environ Geol 42: 767-772.
- Harvey JW, Bencala KE (2004) The effect of groundwater over abstraction in the mountainous catchments within the Basement aquifers of tropical Africa. Water Resour Res 29: 89-98.
- Carrera-Hernandez JJ, Gaskin SJ (2006) The groundwater modeling tool for GRASS (GMTG): Open source groundwater flow modeling. Computers & Geosciences 32: 339-351.
- Legchenko A, Valla P (2002) A review of the basic principles for proton magnetic resonance sounding measurements. J Appl Geophy 50: 3-19.
- Lubczynsky MW, Roy J (2003) Hydrogeological interpretation and potential of the new magnetic resonance sounding (MRS) method. Hydrogeol J 283: 19-40.
- Schirov M, Legchenko A, Creer G (1991) A new direct non-invasive groundwater detection technology for Australia. Explor Geophys 22: 333-338.
- Vouillamoz JM, Sokheng S, Bruyere O, Caron D, Arnout L (2012) Towards a better estimate of storage properties of aquifer with magnetic resonance sounding. Hydrogeol J 458: 51-58.
- Lawson,FMA, Vouillamoz JM (2014) Application of the Magnetic Resonance Sounding (MRS) method to characterize aquifers in Uganda: Result of a fieldwork carried out in Uganda from the 5th of March to the 3rd of May 2014; unpublished report pp: 31.
- Cooper H, Jacob C (1946) A generalized graphical method for evaluating formation constants and summarizing well-field history, AGU: 27: 256-354.
- Sandow M, Obed FF, Larry PC, Daniel KA (2013) Hydrogeological conditions of a crystalline aquifer: Simulation of optimal abstraction rates under scenarios of reduced recharge. ‎Sci World J pp: 1-8.
- Yihdego Y (2005) Three dimensional ground water model of the aquifer around Lake Naivasha area, Kenya. Unpublished MSc Thesis, ITC, Enschede.
- Westerhof AB, Paavo H, Isabirye E, Katto E, Koistinen T, et al. (2014) Geology and geodynamic development of Uganda with explanation of the 1: 1,000,000 -Scale Geological Map; Geological Survey of Finland Special Paper.
- Owor M, Taylor RG, Mukwaya C, Tindimugaya C (2011) Groundwater - surface water interactions on deeply weathered surfaces of low relief: evidence from Lakes Victoria and Kyoga. Hydrogeol JÂ 19: 1403-1420.
- Gebregziabher B (2003) Integrated geophysical methods to investigate the geological structures and hydrostratigraphic unit of the Aynalem area, Southeast Mekelle. MSc thesis Addis Ababa University, Ethiopia.
- Hussien K (2000) Hydrogeology of Aynalem Wellfield, Tigray, Northern Ethiopia. Unpublished Msc. thesis, Addis Ababa University, Ethiopia.
- Harbaugh AW, Banta ER, Hill MC, McDonald MG (2000) MODFLOW-2000, the US Geological Survey Modular groundwater model: User guide to modularization concepts and groundwater flow processes: US Geological Survey, Reston, VA, USA.
- Vouillamoz JM, Lawson FMA, Yalo N, Descloitres M (2014) The use of magnetic resonance sounding for quantifying specific yield and transmissivity in hard rock aquifers: The example of Benin. J Appl Geophys 107: 16 - 24.
- Theis CV (1935) The relation between the lowering of the piezometric surface and the rate and duration of discharge of a well using groundwater storage. Am Geophys Union Trans 16: 519-524.
- Kruseman G, De-Ridder (2000) Analysis and Evaluation of pumping test data. International Institute for land reclamation and Improvement (ILRI) Wageningeni. pp: 377.
- Howard K, Hughes M, Charlesworth D, Ngobi G (1992) Hydrogeologic evaluation of fracture permeability in crystalline basement aquifers of Uganda. Applied Hydrogeology 1: 55-65.
- Vouillamoz JM, Sophoeun P, Bruyere O, Arnout L (2014) Estimating storage properties of aquifer with MRS: A field verification in Northern Cambodia of the gravitational water apartment cutoff time concept. Near Surf Geophys 12: 211-216.
- Das DB, Lewis M (2007) Dynamics of fluid circulation in coupled free and heterogeneous porous domains. Chem. Eng. Sci 62: 3549-3573.
Citation: Nyende J (2018) A Preliminary Hydrological Assessment for Sustainable Groundwater Abstraction Using VES, MRS, SR and MODFLOW: A Case of Namanve Industrial and Business Park, Mukono District, Uganda. J Earth Sci Clim Change 9: 494. DOI: 10.4172/2157-7617.1000494
Copyright: © 2018 Nyende J. This is an open-access article distributed under the terms of the Creative Commons Attribution License, which permits unrestricted use, distribution, and reproduction in any medium, provided the original author and source are credited.
Select your language of interest to view the total content in your interested language
Share This Article
Recommended Journals
Open Access Journals
Article Tools
Article Usage
- Total views: 5423
- [From(publication date): 0-2018 - Dec 20, 2025]
- Breakdown by view type
- HTML page views: 4387
- PDF downloads: 1036