Research Article Open Access
A Proposed Method on the Analysis of the Square Functionality: A Case Study: Beyazit Square Field Work
Fatih SEMERCİ1* and Enes YAŞA2*1Erbakan University, Engineering and Architecture Faculty, Architecture Department, Köycegiz Campus, C Block, Meram, Konya, Turkey
2Necmettin Erbakan University, Engineering and Architecture Faculty, Architecture Department, Köycegiz Campus, C Blok, Meram, Konya, Turkey
- *Corresponding Author:
- Fatih SEMERCİ
Necmettin Erbakan University
Engineering and Architecture Faculty
Architecture Department, Köycegiz Campus
C Block, Meram, Konya, Turkey
Tel: 00 90 5356561490
E-mail: fsemerci@konya.edu.tr
- *Corresponding Author:
-
Enes YASA
Necmettin Erbakan University
Engineering and Architecture Faculty
Architecture Department, K�?¶ycegiz Campus
C Blok, Meram, Konya, Turkey
Tel: 00 90 5325051705
E-mail: eyasa@konya.edu.tr
Received date June 24, 2016; Accepted date July 14, 2016; Published date July 21, 2016
Citation: SEMERCİ F, YAŞA E (2016) A Proposed Method on the Analysis of the Square Functionality: A Case Study: Beyazit Square Field Work. J Archit Eng Tech 5:167. doi: 10.4172/2168-9717.1000167
Copyright: ©2016 SEMERCİ F, et al. This is an open-access article distributed under the terms of the Creative Commons Attribution License, which permits unrestricted use, distribution, and reproduction in any medium, provided the original author and source are credited
Visit for more related articles at Journal of Architectural Engineering Technology
Abstract
In this research, analysis method based on users and sustainable squares should be focused of the users. In this context, “Observation Method” was used for users orientation in the fields (squares).By this method, we can do users observation and users mapping analysis. By This way to compare the data obtained with the mathematical data used Space Syntax method. Space Syntax is an user-oriented method. In this way, we can obtain data about using space and user orientation in the space. So, square’s circulation and static fields are determined. By using the methods, functional and useful spaces will be provided at the same time the production of sustainable spaces.
In this research, Beyazit Square in the İstanbul Historic Peninsula is selected for application area. The method has been tested in this area. With the results of the analysis demonstrated comments for sustainable square design.
Keywords
Squares; Observation method; Space syntax; Open spaces; Squares analysis; Square functionality
Introduction
Technological developments and industrialism after the industrial revolution has caused migrations from rural areas to urban areas and as such has caused fast urbanization which has led to unplanned development of cities. People have started to use motor vehicles to reach far distances in the cities which have changed form and scale by spreading their boundaries. Especially after the II World War, as the motored vehicles have become the dominant form of transportation, the road surfaces in cities have increased and in inverse proportion to this, available areas for pedestrians have decreased.
One of the biggest urbanization problems that we are faced with today includes not taking into account the usage of the city areas by the pedestrians. Especially the traffic problem that reaches greater heights in metropolitan cities and the fact that pedestrians are not able to find any place on the roads for themselves has made it mandatory to take new planning decisions relate to transportation in our era. One of the most significant solutions created as part of this planning is the concept of a pedestrian area. The squares which can be shown as an example area for pedestrians have the functionality of social life. These squares are totally devoid of vehicle traffic. Also they are places which meet the needs for all the activities of pedestrians.
In public squares which have dense usage and social content, there are differences seen in the design principles due to fast developing technological activities, globalized world standards, and differentiation of social life. New and different functionalities will cause the birth of different design principles. Furthermore, the users of the area also transform to different profiles and thus the design program also changes as a result. Hence, in the design of these squares, it is essential to direct user needs (profiles), technological inputs and the architectural needs of the contemporary era. The important issue that needs to be taken care of is that the design must reflect the needs of the user rather than the wants of the user along with the current technological capabilities. An area design using this criterion would be functional and it would lead to a public square planning which will allow for high levels of user satisfaction.
This study has the purpose of determining the reasons for selecting public squares, their usage and purpose, and analyzing how much they meet the needs of the public, as well as their contribution to the city. Furthermore, it will show the relationship between the design of the square and the behavior of the users. In order to validate the model, the Beyazıt Public Square which is in the Historical Istanbul Peninsula has been used as a research area.
Literature Review
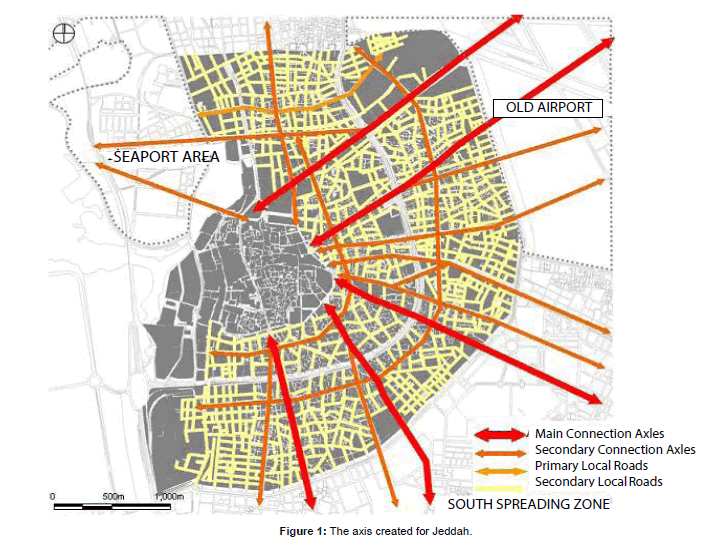
It is seen from the methods used in the studies that Space Syntax is a method has been developed in order to be used in the analysis of social spaces. Professor Hillier who utilized the method has mentioned the information about the usage of the method in the analysis of social spaces in the works of “Space is the Machine”, (Hillier 1996) and Social Logic of Space”, (Hillier and Hanson 1984). In addition, many researches and studies have been carried out about this method [1- 22]. Positive results are observed to be obtained from the investigated references in the area analysis performed with Space Syntax. If it is needed to give an example in the context of the work: one of the important projects is Jeddah City Plan. Jeddah, one of the largest cities of Saudi Arabia, is a city established near to Mecca in the Red Sea shores and all the city sights are produced with the analysis obtained from Space Syntax method. The Airport is also included in this (Figure 1).
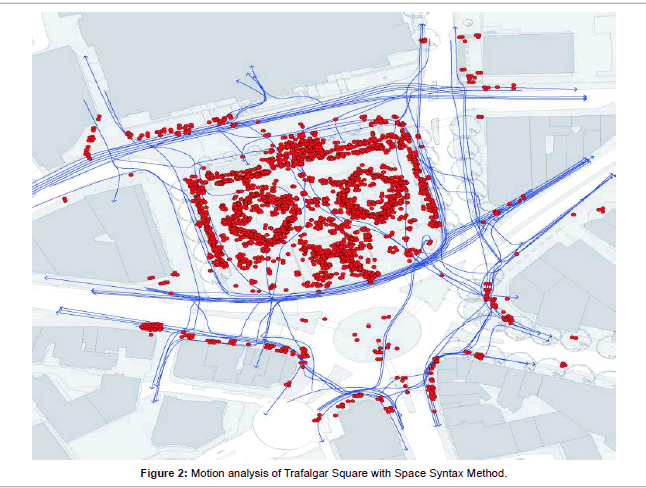
One of the important open public squares which have been designed with Space Syntax is the Trafalgar Square. It has been determined through the Space Syntax Methods that the utilization of the square has increased.
Also important public areas such as “Brighton City Center”, the Nottingham Old Market Square, Woolwich Square are regions which have been planned with Space Syntax.
While the observation method is not used as densely as Space Syntax method, it is a contemporary method which is used in studies. For this method, the references of Şener 2006, Edgü 2003, Hillier 1996, Tutal, 1999, Winett 1991, Morval 1985 have been used (Figure 2).
Purpose of the Study
In the present, public squares present areas are studied, which have different features and functionality and which have different physical and symbolic meanings. These areas are places where the lifestyle and the culture of the people who live there can be observed and where social communication and social integration takes place. The public squares contribute to highlighting and protecting the historical values of the cities, to supporting tourism, to take care of the recreational needs of the city dwellers, to increase daily commerce and to increase the green areas of the city.
In this study, a method has been developed for explaining and for analyzing the relationship between the design of the public squares and the behavior of the users in these regions. The objective is to analyze and study the users in the squares and to contribute to the design of public squares. Hence, for this reason, the Beyazıt Square in the Historical Istanbul Peninsula has been chosen as a testing site since it is one of the first pedestrian areas in our country and it is an area used for historical, cultural, commercial, religious, educational and architectural, recreational and touristic purposes and also that it has many contemporary problems.
Methodology
In this study, Beyazit Square located in Istanbul historical peninsula is defined as the work area and determinations are made with the area analysis. The usage analysis of the area was conducted with the priority observation method. Because of this analysis, the trends of men and women using the area are observed and processed into the maps. Circulation axes of the users in the maps created are intended to be tested by Space Syntax method. For this reason, Space Syntax method is benefited by doing motion analysis. Thus, both methods of the area are compared and the determinations of the circulation axis with the static areas are controlled. Obtained results are aimed to be used as inputs for the design.
Methods of analysis
In the method which has been proposed, methods focusing on the users have been taken into consideration. In this aspect, Space Syntax methods which are used for observation and for social purposes have been used as content for this method. The analysis obtained through observation and the validation of results has been verified through mathematical data using Space Syntax.
Area – oriented utilization of observation method: With this method, the objective is to identify the user preferences in the area and to identify circulation-stationary areas. This way, it would be possible to specifically design these public squares regionally. This will allow reasoned usage and functionality of the design of stationary areas and with circulation axes. Hence, it is essential to use the observation method.
This approach takes spatial behavior as a subjective experience and it tries to decipher the effect of the environment on the individual [1]. Spatial behavior is the essence of environment-behavior studies and it contains many factors which effect behavior [2].
The relationship between the formal structure and the movement intensity of the environment is named as the natural movement principle. The distribution of the pedestrian movement in public areas is extremely important for determining the environmental behavior [3]. Environmental behavior is based on the natural mobility. Since the source of the movement is human, user diversity and behavior differences are effective on the natural movement. Formal structure produces natural mobility, gives direction to it and is not the only reason, but is the main reason for causing the pedestrian movement [4].
Method focuses more on environmental related variables rather than human focused variables such as personality, conscience and emotions. Furthermore, while the method acknowledges the effect of persons on variables for explaining the behavior of users; the theory6 states that the actual defining factor is environment [5].
Yıldız and Şener [6] has stated a relationship between the type of activities that take place in the defined space, as well as the frequencies of these activities, the utilization of the space at certain hours and the amount of time that the visitors 2222222 stay in the square.
Furthermore, it is observed that users with different ages and gender perform different spatial activities in different seasons, days or times. For example noise, temperature, and other environmental factors such as lighting levels can affect the time of stay in the spatial area. In addition, there are other effects such as place of birth, seating period, transportation mode, cultural contexts, education, personality and social status has an effect on how the person behaves in that particular area [1].
Area-oriented usage of Space Syntax method: Space Syntax is a method used frequently in the analysis of the social environments as previously mentioned. Motion analysis oriented part of this method, which contains many analysis types, is discussed. Comparison of the movement analysis performed based on the mathematical data in digital environment with the circulation axis obtained from the observation method and testing them with one another will be provided. Therefore, Space Syntax method is benefited by doing movement analysis. If the method needs to be investigated in detail; spatial index is a method used for examining the relationship between human and the environments that they have formed [7]. The relationship between the formal structure of the spatial dimension extending from building scale such as architecture, urban areas, transport areas to the city scale with the users’ behaviors in the environment is evaluated numerically with the help of a computer program [3,4].
Spatial index method offers approaches oriented for both predesign and the usage process unlike the other methods in terms of handling the space [8]. It is a tool helping the design, testing the design or revealing the mistakes of the existing design. Therefore, it provides an objective angle of view to the spatial design [9]. Particularly, it is an important approach in terms of design readability with the users’ eye [2].
Depth arises in the cases when passing through the environment which crosses multiple times to reach a place [7]. If this place that will be reached has less value in terms of changing direction, this is called shallowness; the opposite one is called depth. The important thing here is to show the relationship of each place with all other places as a value [10]. In an axes map, the number of the straight line connected to any straight line directly gives the connectedness value. This implies the straight line number closest to an axial straight line. Control value indicates the degree of the relationship of an axial straight line with the other straight lines [11]. The most important value in the determination of the potential movement in the area is the integration value [3]. Integration values are obtained by calculating the straight lines used to reach from one place to another and taking the average value. With this value, how much the axial line is used in the system is investigated [12]. Axis with high integration values needs fewer straight lines to reach the other axis in the system. Accessibility of the axis with high integration values is higher comparing to the axis with low integration value and these axes are more suited to be selected as the main route [13,14]. In the points where the natural movement i.e. the user densities are high, integration values are also found high. Integration value is the most significant criterion to estimate the potential pedestrian movement in the area. In other words, if an area is integrated, the pedestrian density in that space is also high [3]. In this way, intense or infrequently used spaces are determined, mathematical data about the space preference of the users and which axes they choose are reached [15].
The most important property of the method is to establish a relationship between the morphological pattern of the urban areas and pedestrian movement model with the help of the calculated integration values [16]. Calculating the integration value allows to predict what the performed design can bring to the area, to reform the design according to a desired movement level, to revive the unused areas and to add functionality to the design [14]. In this sense, it offers a professional consulting service in the evaluation of the design of the urban areas [17,18].
Field Study
In this section, a sample area is selected in order to test the functional analysis of the squares and the methods are tested in this area. As it is mentioned in the aim of the study, Beyazit Square, one of the first pedestrian region samples in our country, one of the historical Peninsula Squares having many current problems today and carrying historical, cultural, commercial, religious, educational, recreational and touristic properties, used for different purposes depending on the political, economical, technological and socio-cultural conditions of the period through the history is determined to be the testing area of the method.
Beyazit Square
Istanbul University Buildings are located in an area bounded by Sahaflar, Beyazit Mosque and Complex, Coppersmith Bazaar and Istanbul University Library. Beyazit Square is located onto one of the highest points in the Historical Peninsula [19]. Since it is an area close to the accommodation and commercial centers between the historical buildings and educational buildings, it is an area addressing the users with different profiles especially students and tourists. Beyazit Square is a region having an important place in the physical structure of Istanbul as a Palace Square in Ottoman Era, the biggest Forum of the city in the Byzantine period [20].
Application and analysis of the observation method in the area
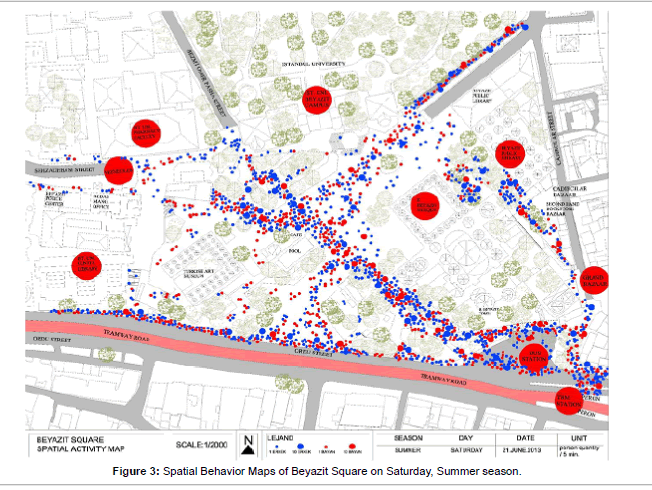
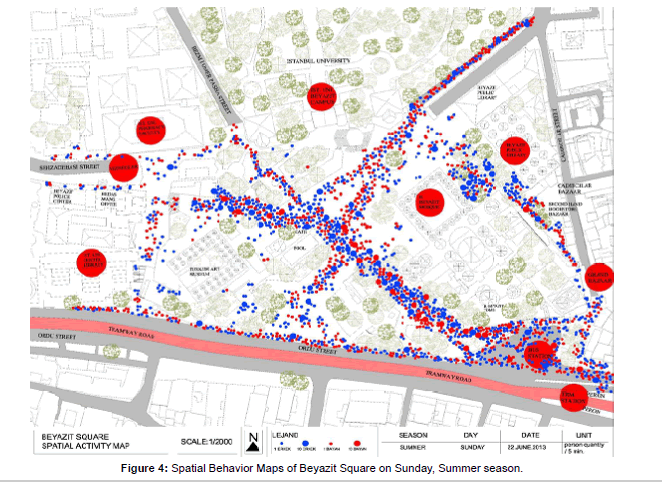
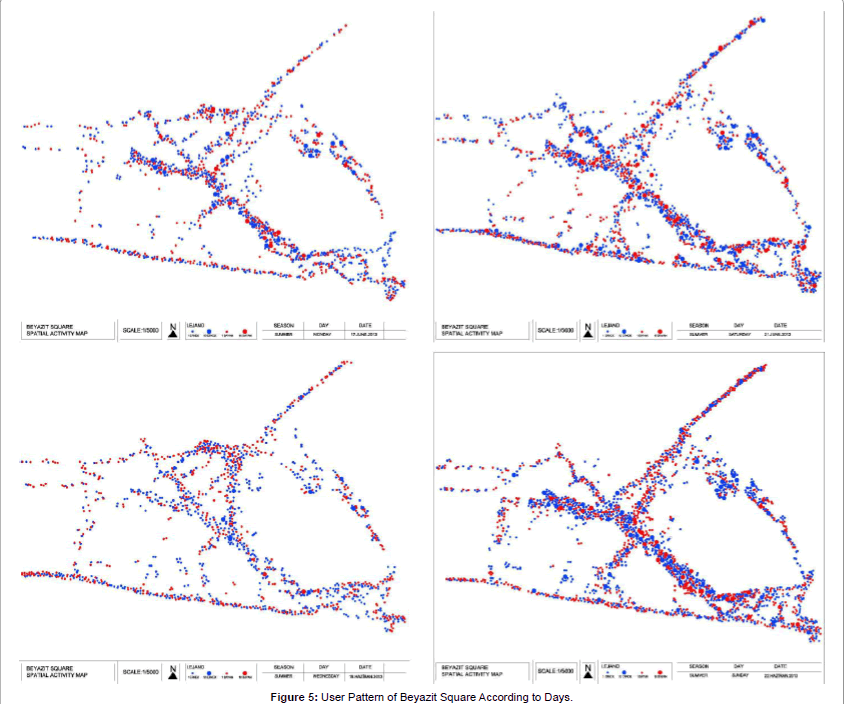
In this section, firstly the criteria about the observation method are determined. By considering June of the summer season as one of the busiest months, observation analysis for Mondays and Wednesdays with the weekends of this month are performed. The main aim in observation method is the observation analysis in the times where the target area is intense. Because the highest level of the user density should be taken as basis in the regulations of the square. The designs in which user density is considered will provide the area usage to be in optimum level. Therefore, observation performed in the area is carried out in four different days (Monday, Wednesday, Saturday and Sunday when the area is more intense). Istanbul University located in the area shows intensity in the usage of the area in weekdays. With the cameras placed in certain points of the area, recording is made in the busy hours with high density of the determined days. Analysis for hour periods selected from morning, noon and afternoon/evening hours of each day determined in the area are performed. Record counting is made between 09.00-10.00 in the morning, 12.00-13.00 at noon and 17.00-18.00 in the afternoon hours of the days to be analyzed. In the performed counting, user densities are calculated and the average density is processed into the graphs. The results taken from these counts are scaled down to 10-minute rates to process into the map in Autocad environment and “Spatial Behavior Map” was formed by processing the average person number/10 minutes of that day (Figure 1). In the observations performed in weekdays and weekends in the same season, air temperature, wind etc. seasonal and environmental conditions are noted to be similar.For summer season in 2013, days of 17. (Monday), 19. (Wednesday), 21. (Saturday) and 22. (Sunday) of June are selected and analyzed. By considering the users’ genders in the analysis performed, their trends in the fields are observed. Thus, static (stationary) and movement (circulation) analysis of the areas are performed. Users’ functions in the area are determined as versatile. Performed observations are evaluated and examinations for that day are made from these data.
For summer season in 2013, days of 17. (Monday), 19. (Wednesday), 21. (Saturday) and 22. (Sunday) of June are selected and analyzed. By considering the users’ genders in the analysis performed, their trends in the fields are observed. Thus, static (stationary) and movement (circulation) analysis of the areas are performed. Users’ functions in the area are determined as versatile. Performed observations are evaluated and examinations for that day are made from these data.
According to the analysis of Monday, June, summer season; number of people proportioned to 10 minutes in Beyazit square is 2381. In the analysis, 1007 women and 1374 men were counted. According to the analysis of Wednesday, June, summer season; number of people proportioned to 10 minutes in Beyazit square is 2021. In the analysis, 794 women and 1227 men were counted. According to the analysis of Saturday, June, summer season; number of people proportioned to 10 minutes in Beyazit square is 3027. In the analysis, 1221 women and 1806 men were counted. According to the analysis of Sunday, June, summer season; number of people proportioned to 10 minutes in Beyazit square is 3165. In the analysis, 1243 women and 1922 men were counted (Figures 1-5).
As per the data from Summer Season Observation Method; it is observed that university students are found in higher frequency as young users are found along with a great number of tourists and visitors. The axis formed by the university students is different from the axis formed by the tourists and visitors and both have significant density levels in terms of number of people. While the public square is heavily used, it is observed that it doesn’t meet the needs of the users and the public in general. This is due to the fact that even when it is heavily used, it is generally utilized as a place of passing through. This condition shows that the utilization of the public square is weak. Hence, a new layout or a new design or regional renovations are needed (Figures 1 and 2).
Implementation of Space Syntax method in the fields and analysis
Spatial index analysis was conducted to perform morphological analysis in Beyazit Square chosen as the study area, to evaluate pedestrian movements and usages in the area from a mathematical point of view, to investigate the design of the area, to determine the efficiencies of the current design in the area and to find the causes and solutions for these deficiencies. The accuracy and the density of the current location of the pedestrian circulation emerged from the observation method plays an important role in testing. Thus, the accuracy and density of the naturally generated user axes in the observation method will be tested by space syntax method and programs.
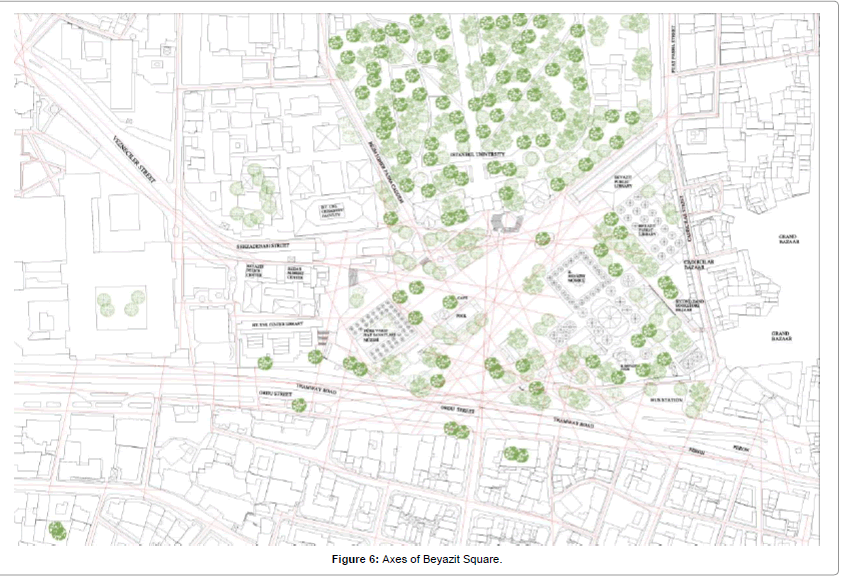
With this method, movement analysis has been conducted for the square. Primarily, the maps which include the perimeters of the region as well as the axis which are fundamental to movement analysis have been drawn in Autocad environment (Figure 3). Then the density analysis for the Space Syntax Method has been conducted with the Dept Map software. In the analysis, the densities of the axes have been formed as per their importance. The Space Syntax method has been used in the analysis of the utilization of the area by pedestrians [4].
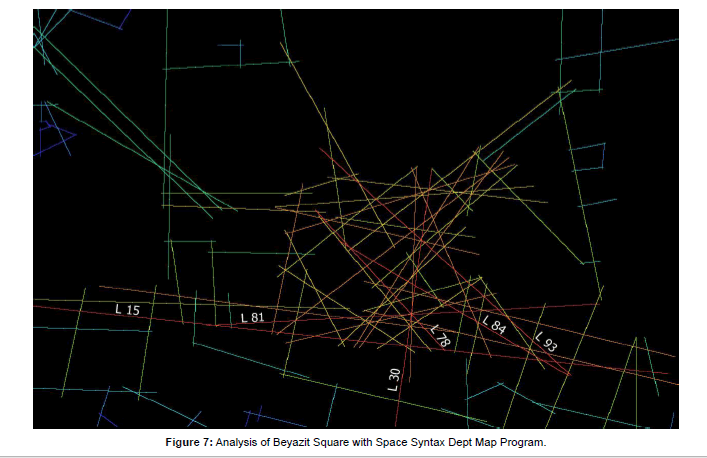
In the studies performed with Space Syntax Method, the criteria explaining the natural movement in the square and revealing the usage value of the outdoors in the most accurate way is determined to be obtained by calculating the integration values [21]. Integration values are expressed numerically in the prepared maps and transformed to Spatial Integration Maps automatically by the program [22]. All axes in the Spatial Integration Map are colored as per the range of the integration values (Figures 6 and 7).
In the Spatial Integration Maps prepared for the study areas, axes are colored as per their densities by Dept Map program. In the prepared maps, all axes from the axes with high integration values to the lower axes are emphasized, dense axes are numbered and colored as the most intense red, while the least dense is colored as blue by the program.
As a result of the study performed with Space Syntax method in Beyazit Square, the average integration value of the research area is found to be 0,639205. As it can be seen from the integration map, axes having the highest Rn (global) integration value in the field are:
Ordu Street having 0,770889 Rn value and represented with L 15 code, Ordu Street-Vezneciler (Sehzadebasi Street) axis having 0,768194 Rn value and represented with L 93 code, Ordu Street-Istanbul University axis having 0,760108 Rn value and represented with L 30 code, Ordu Street-Kapalı Bazaar axis having 0,756065 Rn value and represented with L 81 code, Ordu Street-Istanbul University Library axis having 0,753369 Rn value and represented with L 84 code, Ordu Street-Meydan cafeteria axis having 0,732394 Rn value and represented with L 78 code (Figure 4).
According to the movement analysis performed in Beyazit Square; the most intense axes are seen to be Ordu street axis (L 15) and Ordu Street-Istanbul University campus axis which is perpendicular to the previous axis (L 30), Ordu Street- Kapali Bazaar axis (L 81) and Ordu Street-Sehzadebasi Street axis (L 93). These axes are the red color ones in the movement analysis. The density of these axes is at high level. Then the orange axes shows intensity. For this area, orange color axes are seen as circulation areas feeding the red color dense axes mentioned before. In the analysis, the axis which is having the lowest movement density is shown in blue (Figure 4).
Result and Discussion
According to the data obtained with the observation method, the square is observed to be more intense during the summer and in the spring months and less intense in winter and partially in autumn. The square is generally busier at weekends. More intense use of the square at weekends also increases functional diversity of the area. It is observed with this increase that the usage of different age groups and with different purposes shows intensity at weekends. The usage of the area at weekdays is directed to certain functions. Weekday usage of Beyazit Square can be said generally to be transition, education and work purposes. Here, the importance of the traditional shopping patterns of Istanbul University and around is big. In addition, Grand Bazaar adds a great richness to the area. Especially the effect of the Grand Bazaar in the usage of the area at weekends is extremely high. In a sense, it gives an attractive feature to the square. Another functionality hosted in the square is the historic booksellers’ market. This market where all people in Istanbul prefer in book purchase heavily enriches this market area. These properties of the square, being unchangeable for the people of Istanbul transform as density to the square. The historic Cinaraltı section is another factor supporting the square. This part is a section convenient to the historic pattern of the square and defined as the stable part of the area. In this part, keeping the square alive and maintaining the waiting-resting functions of the square seem to be a more accurate decision.
Generally, Space Syntax Method provides the determination of liveliness of movement axes and stable areas in the study. This determination is also tested with the Observation Method.
In the performed comparisons, the densities of the axes of both methods seem to have consistency. Therefore, circulation densities of these axes should be considered in the future designs.
Inputs of general planning principles should form around the axes in space syntax and observation methods, functionality and the sizes of the areas should be adjusted based on especially the axis densities.
According to Space Syntax analysis; in the analysis made with Dept Map program and in the maps produced by the program, axes which are important in first and second level and the axes determined to be used intensively from the Observation Method are found to show compatibility. These axes are determined to have higher integration values than the average and to be the axes passing mostly through the square center.
It is determined as a result of the performed studies that the data obtained from the method reveals realistic tables and the method offers informative values about the movement pattern of the square.
Space Syntax Method tests in which axes the usage densities seem more prominent via mathematical analysis and helps the physical structure of the square to be recognized and thus to reveal the design errors in the area. When the method is associated with the other methods performed in the area, it seems to be consistent. Especially, ensuring a compliance with the axes of the Observation Method shows that this method can be used for the squares.
It seems from the comparison that the densities of the axes of both methods have consistency. Therefore, circulation densities of these axes should be considered in the future designs. Determining the circulation areas points what kind of design and function will be in these axes. In addition, with the determination of the stable areas, functionality of these regions will be clearer. Usage flexibility of the squares arranged or designed in this way will increase. Planning is also provided to have clearer lines. This is due to the fact that it will be easier to continue with the design data in the sub-section on regions and axes of the squares which are big in scale. Developing new design alternatives by analyzing the urban spaces in this way makes it possible to determine and solve the existing problems. For this method revealing the users’ spatial behaviors, conveniences provided by the computer technology are indispensable qualities. All of these methods form the basis of the design of sustainable and livable squares.
Conclusion
In our time, developing values, technological approaches and changing social living conditions affect the design of open spaces and squares. In order for architectural design criteria and design process to give results proper to today’s conditions, new methods and techniques should be supported. Especially using the user’s requirements and technological possibilities as inputs for the design will provide to increase the functionality of the squares and to obtain user satisfactions. In any square regulation, using different methods capable of analyzing the area and the users and obtaining the data that can operates the design with the right steps will produce positive results. In this context, a new method is proposed to the square planning process. Suggested method is tested by performing field studies in Beyazit Square determined in Historic Peninsula. The method seems to provide significant conveniences for achieving the aims mentioned at the beginning. Obtaining the data shaping the formation of the design and easing the design process provides the study to conclude with positive results and ensure its necessity. Support and validation of the performed analysis and the obtained results show the consistency of the method.
Criteria aiming in this study to increase the square arrangements and design functionality are:
- Completing the Social, cultural and physical analysis of the area in Square arrangement.
- Determination and integration of the user-oriented methods for the areas to be regulated or designed.
- Integration of the analysis located in both lists and verification with each other by testing,
- Customizing ,stable area designs and circulation axes within the lights of the obtained data and performing the necessary and distinctive design of each region in the square.
- Original designs to be prepared which also help to energize the spirit and the vitality of the area.
Hence, the designed spaces will be functional as well as comfortable.
Acknowledgements
This work was supported by N.E.U. Scientific and Technological Research Projects Funding Program (Grant No: 121219003).
References
- Morval J (1985) Introduction a la Psychologie de environnement (Introduction to Environmental Psychology). Trans N information, Ege University Press, Izmir.
- Edge E (2003) Housing Preferences and Parameters Spatial Array Behavior and Spatial Relations.PhD Thesis, ITU Institute of Science and Technology, Istanbul.
- Hillier B (1996) Space Is The Machine.(1stedn) Cambridge University Press, Cambridge.
- TUTAL O (1999) Housing Area in Investigation of the formal structure of the Space Syntax Method. Institute of Science and Technology, Istanbul.
- Winett RA (1991) Empiricist-positivist Theories of Environment and Behavior: New Directions for Multilevel Frameworks.In:Zuber R, Moor D (eds.) Advances in Environment, Behavior and Design, Plenum Press, New York. pp: 29-58.
- Stars D, Sener H (2006) Building the Defined Use Value Analysis Model of Exteriors. ITU Journal/w Architecture, Planning, Design, Istanbul 5:115-127.
- Hillier B, Hanson J (1984) Social Logic of Space. Cambridge University Press, London.
- Uzbek M (2007)Physical Space Fiction of Social Affairs over Arnavutkoy Settlement Body of the Space Syntax (Space Syntax) Investigation and Method.MimarSinan University, Istanbul, Turkey.
- Altin�?¶z�?¼ G (2003) with a Array Spatial Analysis Formal Methods in Urban Texture: A Case Study in Amasya. Master Thesis, ITU Institute of Science and Technology, Istanbul.
- Yellow F (2003) Form and Function Relationships in Urban Space: Izmir Port District Urban Design with Space Syntax Analysis Method ofProposal.Master Thesis, ITU Institute of Science and Technology, Istanbul.
- Jiang, Claramunt BC (2002) Integration of Space Syntaxinto GIS: New Perspectivesf Urban Morphology, Transactions in GIS 6: 295-309.
- Hillier B (1999) Centrality of Attraction As Process Accounting For Inequalities In Deformed Grids. Proceedings of the 2th Space Syntax Symposium, Brazilia 6: 1-20
- Extract O (2006) Relation of pedestrian movement and space-Galata Area Example.Master Thesis, ITU Institute of Science and Technology, Istanbul, Turkey.
- Rose G (2007) of its impact on the Bosphorus Bridge in Istanbul Open Space Systems Space Syntax Method and Evaluation. Master Thesis, ITU Institute of Science and Technology, Istanbul, Turkey.
- Outstanding YO (2004) Evaluation of the Changing Use of Open Spaces in the Historic City Amasya Case. ITU Institute of Science and Technology.
- TeklenburgJAF, Timmermans HJP, Wagenberg AF (1993) Space Syntax Standardised Integration Measures and Some Simulations. Environment and Planning B: Planning and Design 20: 347-357.
- Ayvaz C (2007) A Study on the Spatial Organization of building accommodation Master Thesis, Y.T.�?�?. Institute of Science and Technology, Istanbul, Turkey.
- �?�?zsul Z (2005) Protection of Traditional Cultural Landscape Assessment Settlement terms: Mudanya Case. Executive Institute of Science and Technology, Istanbul, Turkey.
- Cansever T (1991) BeyazitSquare Pedestrian Project 1969.ArredementoArchitecture,Istanbul. pp: 24.
- Kuban D (1998) Urban and Architecture on Writing Istanbul. YEM Publications, Istanbul.
- Jiang B, Claramunt C, Batty M (1999) Geometric and Geographic Information Accessibility Extending Desktop GIS to Space Syntax. Computers, Environment and Urban Systems 23: 127-146.
- Thomson RC (2003) Bending the Axial Line: Smoothly Continuous Road Centre-Line Segments As A Basis For Road Network Analysis. Proceedings of the 4th International Space Syntax Symposium, London.
Relevant Topics
- Architect
- Architectural Drawing
- Architectural Engineering
- Building design
- Building Information Modeling (BIM)
- Concrete
- Construction
- Construction Engineering
- Construction Estimating Software
- Engineering Drawing
- Fabric Formwork
- Interior Design
- Interior Designing
- Landscape Architecture
- Smart Buildings
- Sociology of Architecture
- Structural Analysis
- Sustainable Design
- Urban Design
- Urban Planner
Recommended Journals
Article Tools
Article Usage
- Total views: 13791
- [From(publication date):
September-2016 - Aug 31, 2025] - Breakdown by view type
- HTML page views : 12793
- PDF downloads : 998
