Assessment of Natural and Artificial Radioactivity Levels and Radiation Hazards and their Relation to Heavy Metals in the Industrial Area of Port Said City, Egypt
Received: 06-Feb-2014 / Accepted Date: 27-Feb-2014 / Published Date: 02-Mar-2014 DOI: 10.4172/2157-7617.1000188
Abstract
A detailed gamma ray spectrometry survey was carried out to make an action in environmental impact assessment of urbanization and industrialization on Port Said city, Egypt. The concentrations of the measured radioelements U-238, Th-232 in ppm, and K-40 %, in addition to the total counts of three selected randomly dumping sites (A, B and C) were mapped. The concentration maps represent a base line for the radioactivity in the study area in order to detect any future radioactive contamination. These concentrations are ranging between 0.2 to 21 ppm for U-238 and 0.01 to 13.4 ppm for Th-232 as well as 0.15 to 3.8 % for K-40, whereas the total count values range from 8.7 to 123.6Ur. Moreover, the dose rate was mapped using the same spectrometer and survey parameters in order to assess the radiological effect of these radioelements. The dose rate values range from (0.12 to 1.61mSv/year). Eighteen soil samples were collected from the sites with high radioelement concentrations and dose rates to determine the activity concentrations of Ra-226, Th-232 and K-40 using HPGe spectrometer. The activity concentrations of Ra-226, Th-232 and K-40 in the measured samples range from 18.03 to 398.66 Bqkg-1, 5.28 to 75.7 Bqkg-1 and 3237.88 to 583.12 Bqkg-1 respectively. In addition to analyze heavy metal for two high reading samples (a1 and a10) which give concentrations of Cd and Zn elements (a1: 40 ppm and a10: 42 ppm) and (a1: 0.90 ppm and a10: 0.97 ppm) respectively that are in the range of phosphate fertilizer products that very suggested as a dumped man-made waste in the site "A". All indicate that the measured values for the soil samples in the two sites of three falls within the world ranges of soil in areas with normal levels of radioactivity, while site "A" shows a potential radiological risk for human beings, and it is important to carry out a specifically detailed monitoring program periodically.
Keywords: Gamma ray contamination; Dose rate; Industrial area; Environmental assessment; Egypt
5853Introduction
Human beings are exposed to ionizing radiation every day from natural radionuclides in the ground, building materials, air, food, the universe and even elements in their own bodies. The assessment of these doses from natural materials is important as external radiation exposures from natural materials contribute about 50 % of the average annual dose to humans from all radiation sources [1].
Gamma radiation emitted from naturally occurring radioisotopes, such as K-40 and the radionuclides from the Th-232 and U-238 series and their decay products (also called terrestrial background radiation), which exist as trace levels in all ground formations, represents the main external source of irradiation to the human body [2].
Radioisotopes that are present in soil significantly affect terrestrial gamma radiation levels. In the last decade, several studies were carried out to assess the average outdoor terrestrial gamma dose rate in air [3-14].
Natural radioactivity in soil, sand and rock comes from the Ra- 226 and Th-232 series and K-40, which in turn depends upon the local geology of each region. As natural radionuclides are not uniformly distributed, the knowledge of their concentration and distribution in materials plays an important role in radiation protection. Such investigations can be useful both for the assessment of public dose rates and keep reference data records, to ascertain possible changes in the environmental radioactivity due to nuclear, industrial and other human activities [15].
The mining, milling and industrial uses of Naturally Occurring Radioactive Materials (NORM) cover a range of mineral resources and industrial activities. Due to the technological processes evolved in some of these industrial processes, the concentration of natural radioactive elements in the products and in the wastes can be much higher than that in the ore/raw materials. TENORM stands for technologically enhanced naturally occurring radioactive materials. "Technologically enhanced" was added to distinguish clearly between radionuclides which occur naturally and those which are produced by human activity. High levels of NORM and consequently increased exposure to NORM have been identified in several major industries including energy production using fossil fuels, phosphate industry, as well as oil and gas production [16]. The originated wastes in these activities are released in the environment and hence, an environmental management of the highest quality is needed to reduce the resultant safety problems for both environment and population. The growing concern amongst the population about the quality of their environment increases the significance of impact assessment of radioactive wastes that discharged into the environment even if natural radionuclides occur.
In the present research the radiological risks associated with the presence of natural and artificial radionuclides in Port Said city was assessed. For this purpose radiation doses of gamma radiation were measured in situ using portable RS-230 BGO gamma ray spectrometer and then radiation hazards parameters were calculated. Results of this work are important both in assessment of the risk for human health and in the development of environmental assessment tools in Egypt. Also, these results can be used as a reference point for radiological mapping of the area of Port Said city.
Port Said city lies in the north-eastern part of Egypt, between latitudes 32°12'59" and 32°19'15" E and longitudes 31°12'4" and 31°17'6" N. It has a triangular shape, surrounded by the Suez navigation Canal to the east, the Mediterranean Sea to the north and the eastern part of Lake Manzala to the west (Figure 1a). Port Said city belongs to the far western part of the Sinai Peninsula coastal plain, with a flat topography alleged that ranges from half a meter to about a meter above sea level as it is part of the sandy coastal strip. The region is characterized by a lack of any manifestation of the topography of the terrain preference and covered parts of the southern region of Lake Manzala. The area dates back to Holocene Era where it is composed of Nile deposits represented by three formations which are the Mit-Ghamer formation; consists of about 115 meters of sand, silt sand and mud with overlaps of limestone sand, especially in the upper part of the underground waterbearing formations, this is due to its geological age Pleistocene, The Bilqas formation; consists of 18 meters of soft brown sand structures with overlaps of silt where this configuration represents a natural extension of the Nile River Delta sediments and old age due to geological Pleistocene era and Aeolian sand which covers most of the coastal area of Port Said, in addition to some of the islands and barriers sandy sediments; a soft sandy minute graininess good Category [17,18]. Nile River transported black sand from mountain ranges of Sudan and Abyssinia to its delta in the Mediterranean coast of Egypt. This black sand contains anomalies of relatively higher natural radioactive nuclides than the other coastal sands [19-22]. Uranium and thorium isotopes have been used commonly as radiotracers for studies of marine sediments, including their sources, transport and sedimentation rates in relation to the sedimentary and geochemical processes in the marine environment [23-26]. Three sites (A, B and C) have been selected to carry out the present study.
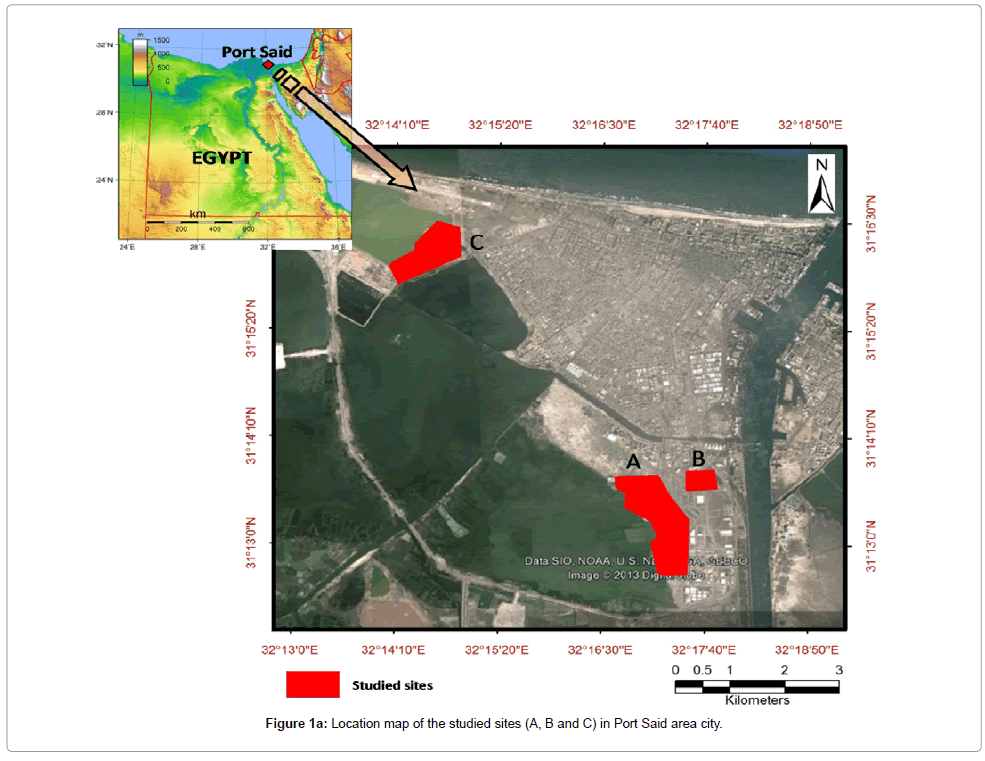
Figure 1a: Location map of the studied sites (A, B and C) in Port Said area city.
Materials and Methods
The investigation methods which have been carried out in the studied sites are: ground gamma ray spectrometric survey and laboratory measurements for soil samples. A description of these investigation methods is given as follows.
Ground gamma ray spectrometric survey
The three studied sites (A, B and C) were selected in the study area (Port Said city) according to their spatial relations with probable sources of contamination. Two of them (A and B) are located near the industrial area of Port Said city (Figures 1b and 1c), whereas site C is located near the solid waste dump and sewage treatment plant. Systematic detailed ground gamma ray spectrometric survey was carried out to measure the vertical and lateral spatial distribution of the radioelement concentration and to measure the dose rate using the RS-230 BGO gamma ray spectrometer provided by Radiation Solutions INC.
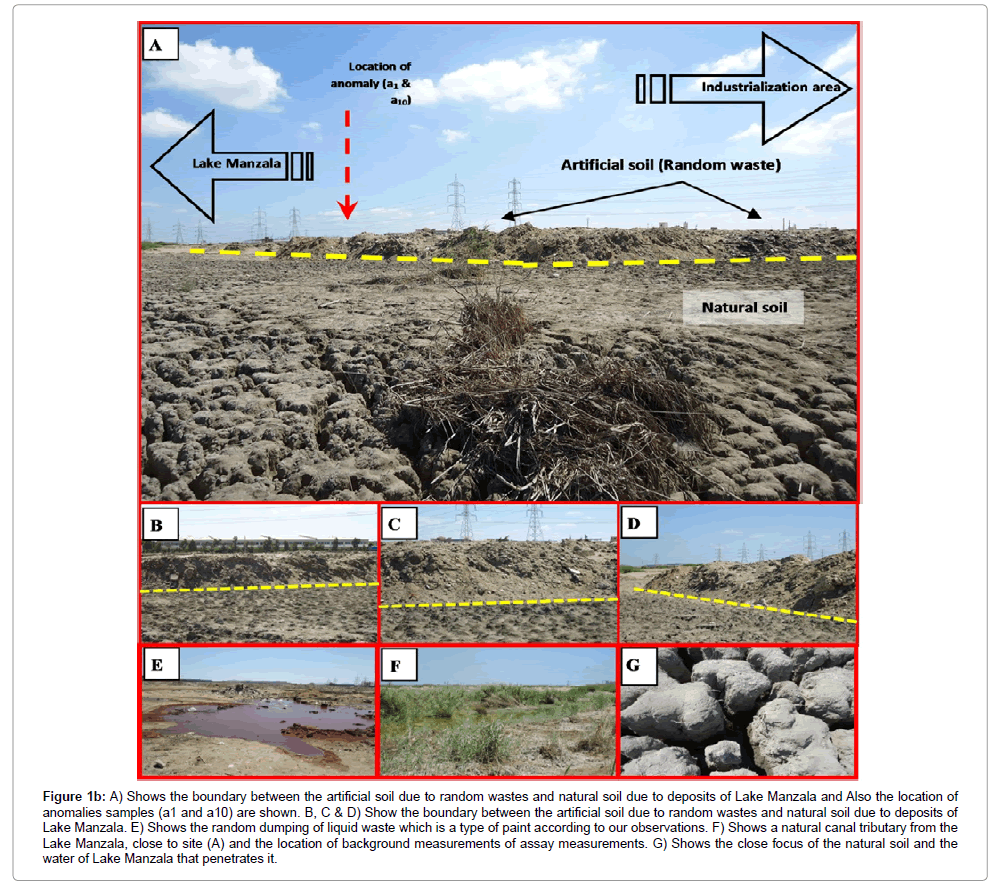
Figure 1b: A) Shows the boundary between the artificial soil due to random wastes and natural soil due to deposits of Lake Manzala and Also the location of anomalies samples (a1 and a10) are shown. B, C & D) Show the boundary between the artificial soil due to random wastes and natural soil due to deposits of Lake Manzala. E) Shows the random dumping of liquid waste which is a type of paint according to our observations. F) Shows a natural canal tributary from the Lake Manzala, close to site (A) and the location of background measurements of assay measurements. G) Shows the close focus of the natural soil and the water of Lake Manzala that penetrates it.
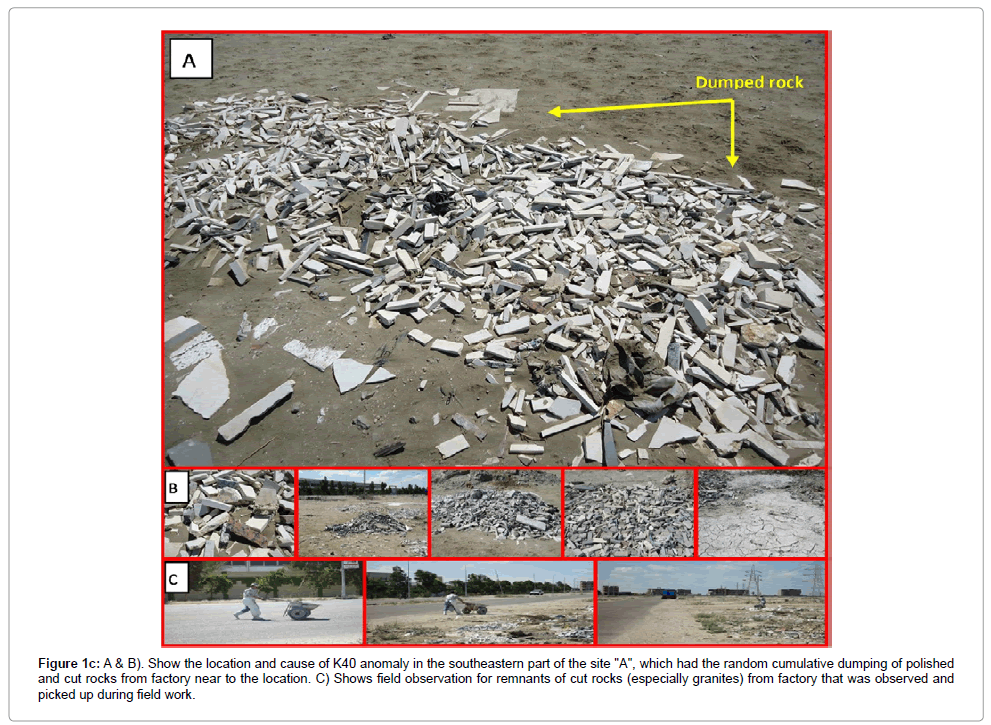
Figure 1c: A & B). Show the location and cause of K40 anomaly in the southeastern part of the site "A", which had the random cumulative dumping of polished and cut rocks from factory near to the location. C) Shows field observation for remnants of cut rocks (especially granites) from factory that was observed and picked up during field work.
The spectrometer uses a 6.3cu INS bismuth germinated detector which provides typically 3x equivalent performance over comparably sized Sodium-Iodide detectors. The detector is previously calibrated and self-stabilized; it gives a direct measurements of total radiation, uranium and thorium concentrations in ppm, potassium concentration in percent and the dose rate. Both the spectrometer function and variations in background radioactivity have been checked daily at an established reference station in the survey area. The assay time was set to two minutes to achieve the best accuracy. The assay data were stored on the internal memory of the spectrometer which is then dumped into the PC using the GeoView software delivered with the spectrometer [27]
The locations of the measuring points were identified using a Garmin GPS model 71 champ, and stored on the internal memory of the GPS, then dumped into the PC coincide along with the assay measurements of the gamma ray spectrometer. Both data sets were merged into one single sheet for each site, which is then used to produce the radiometric maps for total count, potassium, uranium and thorium dose rate.
Soil samples
Eighteen soil samples have been collected from the studied sites (A, B and C) to measure the activity concentrations of Ra-226, Th-232 and K-40 .Theses measurements were determined using a high purity Germanium detector HPGe spectrometer. The detector is housed inside a low-background lead shield to reduce the background of the system. The energy calibration and absolute efficiency calibration of the spectrometer were carried out using known amounts of standard thorium, uranium and potassium oxide samples dispersed in sand. The masses of the collected samples varied between 250 and 350 gm. The samples were dried at 105°C for 48 hours to ensure that moisture is completely removed. They were then crushed and grounded to fine grain size of about 1 mm and sieved in order to remove the big sizes. The powdered samples were then packed in a standard plastic container (7.5×5.5 cm) and after property tightening the threatened lid, the containers were sealed with adhesive tape and left for four weeks before counting by gamma spectrometry in order to ensure that the daughter products of Ra-226 up to Pb-210 and of Th-232 up to Pb-208 in secular equilibrium with their respective parent radionuclides and then the gamma ray spectrum was accumulated to up to 900 min [28].
Heavy metal analysis
The samples that record highest concentrations in radioelements and total radioactivity will be analyzed to heavy metals concentrations (Pb, Zn, Cu, Ni and Cd). This analysis was measured by atomic absorption spectrophotometer to find if there is a relation between these heavy metals concentrations and the source of this high radioactivity.
Results and Discussion
Results of the ground radioactive measurements of the studied sites (A, B and C) in the Port Said city are represented in the form of graded colors maps for K%, U ppm and Th ppm. These maps show the spatial distribution features of the apparent and relative surface concentrations of the three radioelements K, U and Th, in addition to the integral gamma ray response (T.C.) of the study area. In the following, an inspection is given for each of these maps starting with some information about the background radiation.
In order to assess for the radioactivity of the study area, the natural radioactivity background should first be determined. This background represents the lowest level of radiation in the area. It was measured over the lake Manzala at 50 m from the shore, where the water depth at the measuring point is about 1.3 m. It was found that the background values are nearly the same as the minimum values of radioactivity in site "B". As the purpose of this work is to monitor the environmental radiation and the changes occurred due to human activities, the radioactivity background was chosen to be the minimum values that were measured in site "B" as shown in Table 1 because the soil at this site is a natural soil.
| T.C. in (Ur) | K in (%) | U in (ppm) | Th in (ppm) |
|---|---|---|---|
| 8.7 | 0.01 | 0.2 | 0.01 |
Table 1: Background values of T.C., K, U and Th for the three studied sites (A, B & C).
Radioelements maps of site (A)
Total count (T.C.) map: Total count grade map (Figure 2a) shows a wide range of radioactivity from a very low level reaching 13.4 Ur in value to a very high level reaching 123.6 Ur. The highest T.C. value (a1) is located in the northeastern corner of the site "A" where the total count value reaches 123.6 Ur. During the field survey in this anomalous zone, it was noticed that the radioactivity value of the soil increased with depth and the values were duplicated at a depth of 30 cm. There are other two anomalies (a2 and a3) located to the northwestern part and southeastern part of this site with a maximum value of 27 Ur, and 24 Ur respectively.
Potassium (K %) map: Potassium grade map (Figure 2b) shows values varying from 0.01 to 3.8 %, with two highest anomalies (a2 and a3) in the northwestern part and southeastern part of site "A" which coincide with the T.C. anomalies. It was believed that the main reason of potassium in this site is due to the accumulation of pieces of granites, coming from a factory close to site (A) as shown in Figure 2c. It is also noticed that the other high anomaly appeared in the T.C. map of the site "A" disappeared in the K% map. This may prove the artificial source containing traces of uranium and thorium.
Uranium (U ppm) map: Uranium grade map of site "A" (Figure 2c) shows anomalies coincide with the T.C. anomalies. The uranium values range from 0.6 to 21 ppm, where the highest value (a1) coincides with the T.C. anomaly that gives the main reason of uranium as the radioelement responsible for this anomaly. This anomalous value may indicate the presence of a buried artificial radioactive source rich in uranium, as the site "A" is located nearby an area with condensed artificial activities.
Thorium (Th ppm) map: Thorium grade map (Figure 2d) shows a wide range of values varying from 0.3 to 13.4 ppm. The anomalous values are generally located at the northern part of site "A". The highest anomaly value coincides with the "U" and "T.C." anomalies (a1) at the northeastern part of this site. Other anomalies are miss-matched with uranium anomalies and also are very limited and localized anomalies. This may be due to the difference in mobility behavior between uranium (under oxidation conditions) and thorium [29].
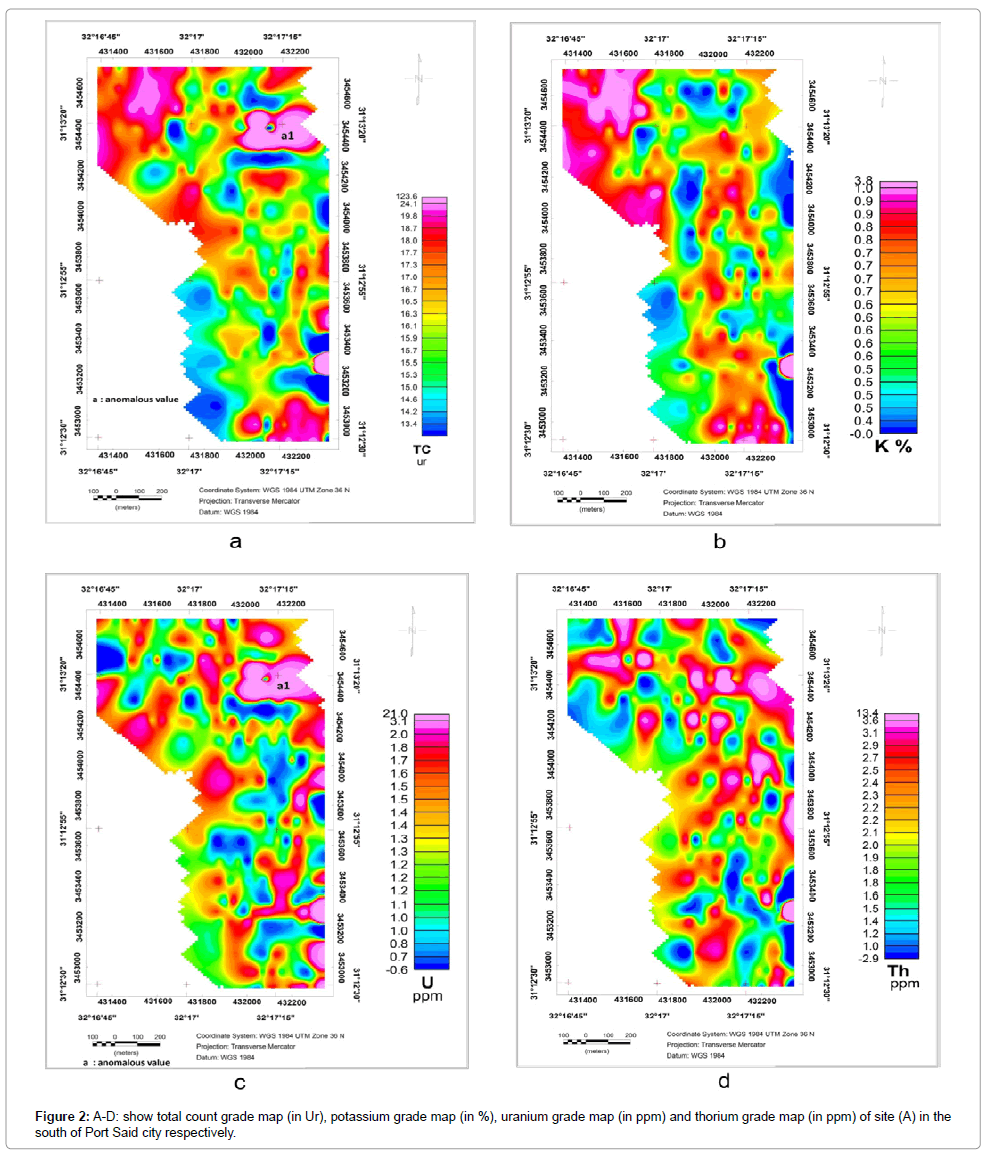
Figure 2: a-d: show total count grade map (in Ur), potassium grade map (in %), uranium grade map (in ppm) and thorium grade map (in ppm) of site (A) in the south of Port Said city respectively.
Radioelements maps of site B
Total count (T.C.) map: Total count grade map of site "B" (Figure 3a) shows a general trend of increment toward the center of this site. The values range from 8.7 to 27.5 Ur.
Potassium (K%) map: Potassium grade map of the site "B" (Figure 3b) shows the same trend of the total count anomaly map with values ranging from 0.1 to 1.3%. This gives an indication that the source of the high radioactivity in this zone may be due to the high concentration of K-40. This anomaly has nearly the same shape as the total count with the maximum value at the same position and trend. This reflects the presence of natural radioelement (K) due to the contribution of Nile and marine deposits in the study area [21,30].
Uranium (U ppm) map: Uranium grade map of the site "B" (Figure 3c) shows values considerably varying from 0.2 to 2.7 ppm with an average value of 1.5 ppm. Six anomalies, randomly distributed, could be noticed in this site. Also, the central part of this site shows a low uranium concentration which differs completely with the total count and potassium grade maps (Figure 3a and 3b). This may indicate that the total count anomaly is not due to the concentration of uranium and may be due to the type of sediments as marine sediments. As many authors concluded, that uranium and thorium isotopes have been used commonly as radiotracers for studies of marine sediments, including their sources, transport and sedimentation rates in relation to the sedimentary and geochemical processes in the marine environment [23-26].
Thorium (Th ppm) map: Thorium grade map of the site "B" (Figure 3d) shows values ranging from 0.01 to 6.3 ppm where there are three anomalies spreading in this site. One of them (a1) is directed to the north which nearly coincides with the total count grade anomaly. The second anomaly (a2) is located in the northwestern corner of site" B". It has a spherical shape and a maximum value of 6.3 ppm. The third anomaly (a3) occupies the western part of this site with a maximum value of 6.3 ppm.
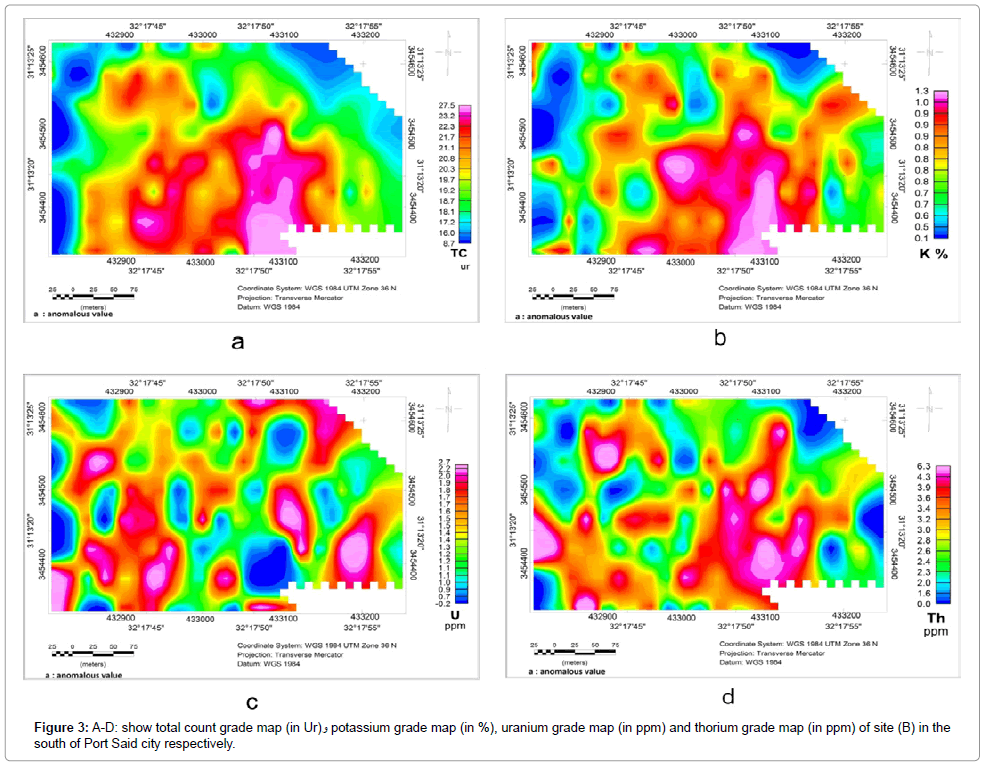
Figure 3: a-d: show total count grade map (in Ur)و potassium grade map (in %), uranium grade map (in ppm) and thorium grade map (in ppm) of site (B) in the south of Port Said city respectively.
Radioelements maps of site C
Total count (T.C.) map: The total count grade map of site "C" (Figure 4a) shows total radioactivity ranging from 17.5 to 41.4 Ur. More than ten small anomalies are distributed in this site. These anomalies have irregular shapes and all have nearly the same maximum value (i.e. 35 to 41 Ur).
Potassium (K%) map: The potassium map of site "C" (Figure 4b) shows a range of values from 0.1 to 2.5% which is nearly coincide with the T.C. anomalies. This may give an indication that the T.C. values may be associated with high concentrations of K-40. It is also noticed that the values of K-40 are lower than those in site "A" and higher than those at site "B". Potassium anomalies have random shapes and trends. The shape, value and size of the anomalies at site "C" are different from those of site "B". This is because the anomalies in site "B" reflect the natural soil that formed by the effect of marine and Nile deposits. While the anomalies in site (C) look like many limited and localized anomalies spread all over the area, which reflects the artificial soil (man-made soil) that made by the random dump of wastes, as this site is considered the solid waste dump and sewage treatment plant of Port Said city.
Uranium (U ppm) maps: The uranium grade map of site "C" (Figure 4c) shows a range of values varying from 0.7 to 4.5 ppm. These anomalies coincide with the total count and K-40 maps of the site "C "and have also NW trends. It is also noticed that the maximum values of uranium in the site "C" are lower than those at site "A" and higher than those at site "B as mentioned above in the potassium grade map of site "C".
Thorium (Th ppm) map: The thorium grade map of site "C" (Figure 4d) shows a range of values varying from 1.5 to 8.3 ppm. The number of the thorium anomalies is larger and more restricted than those of the uranium, which also confirms the difference in mobility of these two radioelements [29]. The anomalies have a semi spherical shape, and they show a considerable coincidence with the total count anomalies in the site "C".
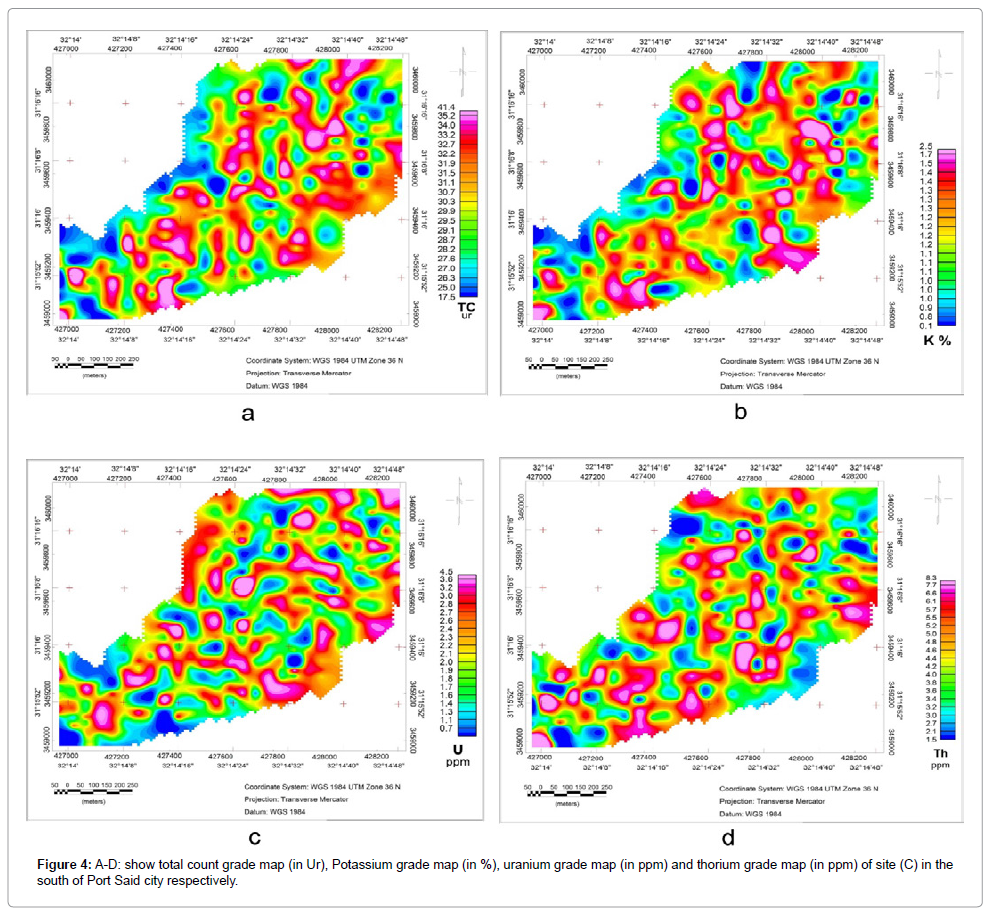
Figure 4: a-d: show total count grade map (in Ur), Potassium grade map (in %), uranium grade map (in ppm) and thorium grade map (in ppm) of site (C) in the south of Port Said city respectively.
Table 2 summarizes the univariate analysis of the total count, potassium, uranium and thorium values in the three studied sites. It is clear that the site "A" is superior to the site "C" in the all measured parameters, while site "B" has the lowest values. This is due to the type of soil, as in the site "B" the soil is a natural soil which has a low radioactive background, while the soil in the sites "A" and "B" are artificial soil that contains wastes from many sources especially the neighboring industrial area which confirmed by high standard deviation values (i.e. the data points are spread out over a large range of values) of the total count, potassium, uranium and thorium in these two sites.
| SITE | Total count (Ur) | Potassium (%) | Uranium (ppm) | Thorium (ppm) | ||||||||||||
|---|---|---|---|---|---|---|---|---|---|---|---|---|---|---|---|---|
| Min | Max | STD | Mean | Min | Max | STD | Mean | Min | Max | STD | Mean | Min | Max | STD | Mean | |
| A | 13.4 | 123.6 | 1.6 | 53.4 | 0.01 | 3.8 | 0.23 | 0.76 | 0.6 | 21 | 1.7 | 1.42 | 0.3 | 13.4 | 1.13 | 2.11 |
| B | 8.7 | 23.5 | 0.83 | 8.21 | 0.1 | 1.3 | 0.17 | 0.79 | 0.2 | 2.7 | 0.55 | 1.4 | 0.01 | 6.3 | 1.13 | 1.7 |
| C | 17.5 | 41.4 | 0.97 | 16.3 | 0.1 | 2.5 | 0.2 | 0.95 | 0.7 | 4.5 | 0.9 | 1.01 | 1.5 | 8.3 | 1.08 | 1.95 |
Table 2: Univariate analysis of T.C., K, U and Th for the ground spectrometric survey of the three sites (A, B and C).
Dose rate maps
In general, approximately 85% of the annual total radiation dose of any person comes from natural radionuclides of both terrestrial and cosmogenic origin [13,31,32]. Dose rate is most unlikely to exceed 1 mSv in a year. Very little action needs to be taken in this dose range for evaluating and controlling worker doses. If dose rate ranges between 1 and 6 mSv in a year, a dose assessment program is necessary and can utilize work place monitoring or individual monitoring. Wherever dose rate is likely to exceed 6 mSv in a year, individual monitoring of the transport personnel is mandatory [33-35].
Dose rate mapping survey was carried out in the three studied sites (A, B and C) using the RS-230 BGO gamma ray spectrometer. The spectrometer has the capability to give measurements of dose rates in Nano-Sievert per hour (nSv/h) [27]. A field survey in the three sites has been taken by the same survey parameters used in radioelements mapping survey. The constructed dose rate maps in milli-Sievert per year (mSv/year) are illustrated below (Figure 5).
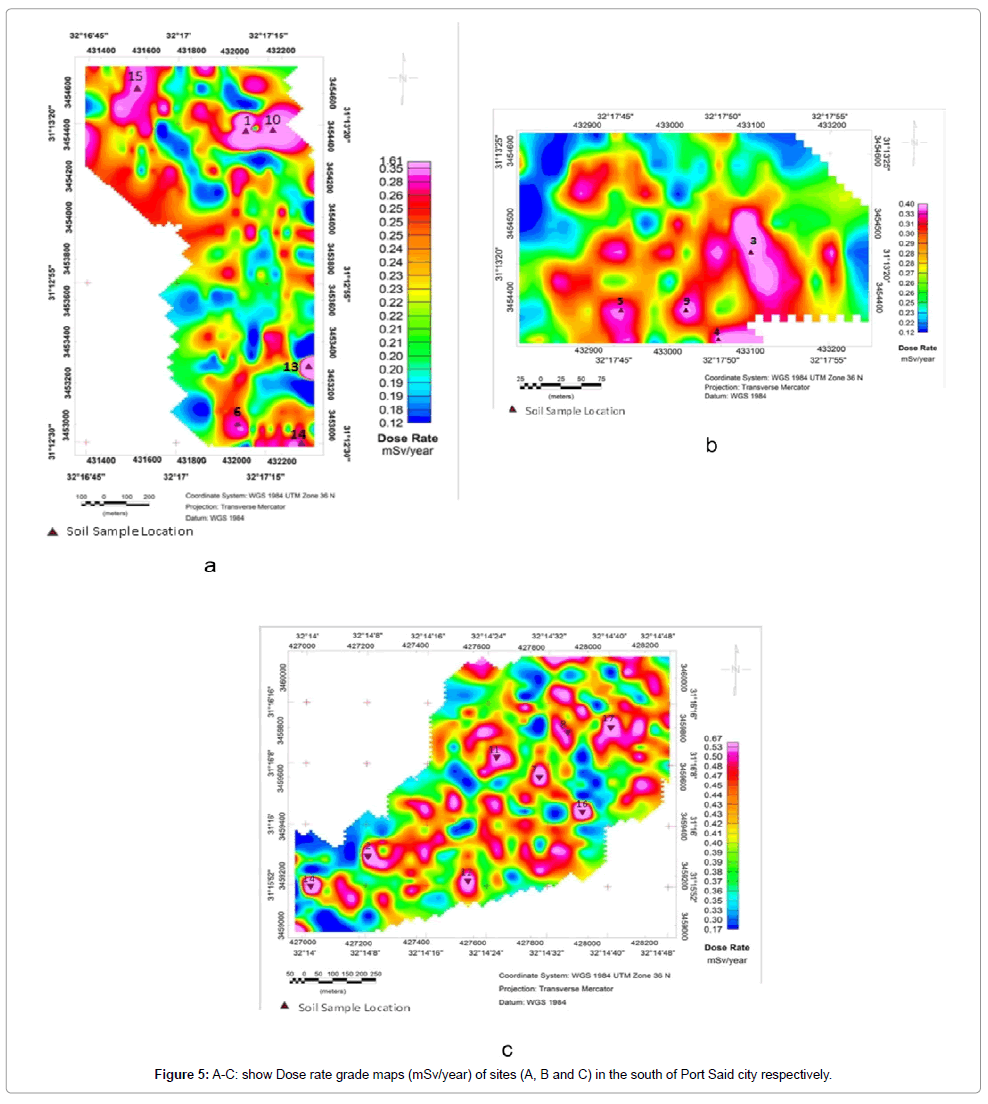
Figure 5: A-C: show Dose rate grade maps (mSv/year) of sites (A, B and C) in the south of Port Said city respectively.
The dose rate grade map of site A (Figure 5a) shows a considerable weight variation of values ranging from 0.12 to 1.61 mSv/year. The maximum anomaly is coincident with the anomalous values of the U ppm, Th ppm and total count anomalies in the northwestern corner of site "A" (Figures 2a, 2c and 2d). The value of 1.6 mSv/year is considered to be risky as it exceeds the safe limit (33-35]. Accordingly a remediation action should be conducted in these locations to get rid of these risky sources. The rest of the dose rate values in site "A" range between 0 to 1 mSv/year which is within the safe limit of radioactivity.
During phosphate fertilizers manufacture, the phosphate ore is firstly attacked by sulfuric acid to produce the phosphoric acid (green acid) where uranium will be mainly concentrated in the phosphoric acid. Several studies showed also that heavy metals in phosphoric fertilizers can accumulate in soil and become readily available to plants. In term of fertilizer use, U, As, Cd, Cr, F, Sr, Th, and Zn are the elements that have a potential risk of accumulation in soil [36,37].
Heavy metals analysis: Two samples (a1 and a10) were taken from the risky zone that exceeds safe limits and then analyzed to the concentrations of Pb, Zn, Cu, Ni, and Cd that were measured by atomic absorption spectrophotometer as shown in Table 3, [38]. The most common heavy metal contaminants are: Cadmium (Cd), Copper (Cu), Molybdenum (Mn), Lead (Pb), Nickel (Ni) and Zinc (Zn) [39,40].
| Site | Sample no. | Heavy metals concentrations in (ppm) | |||||
|---|---|---|---|---|---|---|---|
| Cu | Pb | Cd | Zn | Ni | Mn | ||
| A | a1 | 12 | 16 | 0.90 | 40 | 22 | 70 |
| a10 | 11 | 17 | 0.97 | 42 | 26 | 67 | |
Table 3: Heavy metals concentrations in (ppm) of samples (a1 and a10) in the risky site (A).
In general, the concentrations of the studied heavy metals in the two samples could arrange as: Mn>Zn>Ni>Pb>Cu>Cd. These elements concentrations are in the range of phosphate fertilizer products that very suggested as a dumped man-made wastes in the site A. Cd concentration shown in Table 3 which recorded in the two samples (a1:0.90 ppm and a10:0.97 ppm) is in the known range of Cd concentration in the phosphate fertilizers. Cd occurs naturally as a minor constituent of phosphate ore and is transferred in variable amounts to phosphorus fertilizers during manufacturing process [41]. Rock phosphate contains large amounts of Zinc and cadmium as impurities [42,43]. Zn concentration in (Table 3) that recorded in the two samples (a1:40 ppm and a10:42 ppm) is also in the known range of Zn concentration in phosphate fertilizers. Approximately one-half to two-thirds of the Zn is of anthropogenic origin, whereas for Cd the value may exceed 90% [44].
The dose rate grade map of site B (Figure 5b) shows a range of values oscillating from 0.12 to 0.46 mSv/year. The highest value is concentrated in the center of the site and it is coincident with the potassium and total count anomalies (Figure 3a and 3b). However, the dose rate values in the rest of this site are considered to be less than1 mSv/year and have not affected by any anthropogenic origin and dumped wastes.
The dose rate grade map of site C (Figure 5c) shows values ranging from 0.17 to 0.67 mSv/year. Some of the relatively high values coincide with the high values of K%, while the others are related to the U ppm and Th ppm anomalies. Also the dose rate values in the site "C" are in the safe level of radioactivity. But the anomalies of dose rate in site "C" differs from those in site "B". Site C has many limited anomalies, because it is located near the solid waste dump and sewage treatment plant and may be contaminated by random wastes that slightly contain compounds of radioelements.
Activity concentrations
The radioelement concentrations are measured for 18 soil samples which have been collected from the studied sites (A, B &C). They were converted from part per million (ppm) to activity concentrations in Bq/kg of the Ra-226, Th-232 and K-40 radionuclides using the conversion factors which were produced by IAEA [45]. The results are listed in Table 4. The worldwide average concentrations of the radionuclides- Ra-226, Th-232 and K-40 which were reported by UNSCEAR [32] are 35, 30 and 400 Bqkg-1 respectively.
| Site | Sample no. | Ra-226 Bq/kg | Th-232 Bq/kg | K-40 Bq/kg |
|---|---|---|---|---|
| A | 1* | 348.27 | 54.00 | 237.88 |
| 6 | 65.46 | 7.92 | 403.77 | |
| 10* | 398.66 | 75.70 | 273.56 | |
| 13 | 33.38 | 6.07 | 583.12 | |
| 15 | 75.27 | 9.10 | 464.34 | |
| 18 | 20.74 | 14.89 | 388.75 | |
| B | 3 | 35.07 | 8.93 | 380.62 |
| 4 | 29.02 | 5.28 | 507.06 | |
| 5 | 18.65 | 10.76 | 316.13 | |
| 9 | 18.03 | 12.95 | 338.04 | |
| C | 2 | 53.11 | 10.15 | 244.14 |
| 7 | 32.48 | 8.24 | 347.43 | |
| 8 | 30.13 | 9.26 | 494.54 | |
| 11 | 61.07 | 11.67 | 280.76 | |
| 12 | 40.34 | 10.27 | 307.31 | |
| 14 | 21.45 | 12.37 | 363.55 | |
| 16 | 37.35 | 9.48 | 399.54 | |
| 17 | 34.65 | 10.65 | 568.72 | |
| MAX | 398.66 | 75.70 | 583.12 | |
| MIN | 18.03 | 5.28 | 237.88 |
Table 4: Activity concentrations of Ra-226, Th-232 and K-40 Bq/kg for the soil samples in the sites (A, B and C).
The activity concentration of Ra-226 ranges from 18.03 to 398.66 Bq/Kg. The two highest concentrations of Ra-226 were recorded in samples (a1 and a10) which were collected from the risky zone in the northeastern part of site "A". The activity concentration of Th-232 ranges from 5.28 to 75.70 Bq/Kg. Also the highest concentrations of Th- 232 were recorded in samples (a1 and a10). The activity concentrations of uranium and thorium confirmed what had been estimated from the highest anomalies in T.C., U and Th grade maps of site "A". Whereas the activity concentration of K-40 ranges from 237.88 to 538.12 Bq/ Kg. The highest activity concentration of K-40 was recorded in sample (a13) which has been collected from the southeastern part of site "A" and confirms the highest anomaly of K-40 due to the dumped remnants of rock cuttings from the close factory.
Conclusion
Ground gamma ray spectrometry measurements have been carried out in three sites (A, B and C) in the industrial area of Port Said city. Results indicated that the measured values for the radioelements concentrations in the site "B" have the lowest values as the soil type in this site is an original soil which is characterized by low radioactivity, while the highest radioelements concentrations were recorded in site "A", as the soil in this site is an artificial soil, composed due to the dumping of wastes from many sources especially the industrial area. This may indicate that these wastes have higher radioactivity than the natural background.
In order to assess for the radiologic effect of these concentrations, the activity concentrations of Ra-226, Th-232 and K-40 in soil samples have been measured and the radiological hazard parameters were calculated. Results indicated that soil samples of sites "B" and "C" fall within the world ranges for soil in areas with normal levels of radioactivity, but for site "A" a highly radioactive zone (at the northeastern part of this site) is detected which represents a potential contamination and foretells a possible future risk.
The obtained results, in the light of the industrial activities in the area, give an indication about the possible source of these contaminants, as the raw materials used in steel production are iron ore, coal and limestone [46]. They each contain low levels of naturally occurring radionuclides: potassium-40, uranium-283, uranium-253 and thorium-232 decay chains. The steel production process result in releases to the environment of materials with concentrations of NORM that are enhanced with respect to the raw materials used [47]. Accordingly it is expected that the source of these contaminants is the steel industry in the area.
Elements concentrations especially Cd and Zn that resulted from heavy metal analysis are in the range of phosphate fertilizer products that very suggested as a dumped man-made waste in the site "A".
A remediation action is highly recommend making in site "A" by replacing the contaminated soils by another clean soil, and treat the contaminated soil. Also, it is suggested to design a monitoring program that should be carried out periodically in this site to assess for any future contamination by comparing the current radioelements maps with any new consequent maps in this area.
Acknowledgements
The authors thank the Department of Geology in both Universities (Suez Canal University and Port Said University) first one for providing us with experience in our field "Applied and environmental geophysics" and second for providing "RS- 230 BGO gamma ray spectrometer" used for this study and last but not least that we are belonging to.
References
- UNSCEAR (2010) Sources and effects of ionizing radiation. United Nations Scientific Committee on the Effects of Atomic Radiation. United Nations Publication, New York, USA.
- Harb S, El-Kamel AH, Abd El-Mageed AI, Abbady A, Rashed W (2008) Concentration Of U-238, U-235, Ra-226, Th-232 And K- 40 For Some Granite Samples In Eastern Desert Of Egypt. Proceedings of the 3rd Environmental Physics Conference, 19-23 Feb. 2008, Aswan, Egypt.
- Faheem M, Mujahid SA, Matiullah (2008) Assessment of radiological hazards due to the natural radioactivity in soil and building material samples collected from six districts of the Punjab province-Pakistan. RadiatMeas 43: 1443-1447.
- Ngachin M, Garavaglia M, Giovani C, NjockKMG, Nourreddine A (2008) Radioactivity level and soil radon measurement of a volcanic area in Cameroon. J Environ Radioact 99: 1056-1060.
- Jankovic M, Todorovic D, Savanovic M (2008) Radioactivity measurements in soil samples collected in the Republic of Srpska. RadiatMeas 43: 1448-1452.
- Degerlier M, Karahan G, Ozger G (2008) Radioactivity concentrations and dose assessment for soil samples around Adana, Turkey. J Environ Radiat 99: 1018-1025.
- Psichoudaki M, Papaefthymiou H (2008) Natural radioactivity measurements in the city of Ptolemais (Northern Greece). J Environ Radioact 99: 1011-1017.
- Al-Hamarneh IF, Awadallah MI (2009) Soil radioactivity levels and radiation hazard assessment in the highlands of northern Jordan. RadiatMeas 44: 102-110.
- Baykara O, Dogru M (2009) Determination of terrestrial gamma, U-238, Th-232 and K-40 in soil along fracture zones. RadiatMeas 44: 116-121.
- Lee SK, Wagiran H, Ramli AT, Apriantoro NH, Wood AK (2009) Radiological monitoring: terrestrial natural radionuclides in Kinta District, Perak, Malaysia. J Environ Radioact 100: 368-374.
- Taskin H, Karavus M, Ayb P, Topuzoglu A, Hidiroglu S, et al. (2009) Radionuclide concentrations in soil and lifetime cancer risk due to gamma radioactivity in Kirklareli, Turkey. J Environ Radioact 100: 49-53.
- Radenkovic M, Alshikh SM, Andric VB, Miljanic Å S (2009) Radioactivity of sand from several renowned public beaches and assessment of the corresponding environmental risks. J Serbian ChemSoc 74: 461-470.
- Belivermis M, Kılıç Ö, Çotuk Y, Topcuoğlu S (2010) The effects of physicochemical properties on gamma emitting natural radionuclide levels in the soil profile of Istanbul. Environ Monit Assess 163: 15-26.
- El-Taher A, Makhluf S, Nossair A, Abdel Halim AS (2010) Assessment of natural radioactivity levels and radiation hazards due to cement industry. ApplRadiatIsot 68: 169-174.
- Eissa HS, Medhat ME, Said SA, Elmaghraby EK (2010) Radiation Dose Estimation Of Sand Samples Collected From Different Egyptian Beaches. RadiatProtDosimetry 147: 533-540.
- UNSCEAR (1993) Sources and Effects of Ionizing Radiation, Report to General Assembly with Scientific Annexes. Annex A: Exposures from Natural Sources of Radiation, United Nation Scientific Committee on the Effects of Atomic Radiation, United Nations, New York, USA.
- SEAM Programme (2005) Damietta Governorate Environmental Profile, Ministry of State for Environmental Affairs. Egyptian Environmental Affairs Agency, UK.
- Environmental Description of Port Said Governorate (2007) Egyptian Environmental Affairs Agency. Arabic version.
- El-Naggar AM (1990) Environmental radioactivity; Sources and effects on man, Regional Symp Environ Stud(UNARC), Alexandria University, Egypt.
- El-Khatib AM, Denton M, El-sabrouti MA (1993) Isotope identification of Egyptian black sands from Rossetta using neutron activation analysis. J Fiz Mal 14:1-10.
- El-Gamal A, Saleh I, Nasr S, Naim M (2004) Radiological assessment of the Egyptian Mediterranean coast. International Conference on Isotopes in Environmental Studies- Aquatic Forum 2004, Monte-Carlo, Monaco.
- Hussein AEM (2011) Successive uranium and thorium adsorption from Egyptian monazite by solvent impregnated foam. J RadioanalNuclChem 289: 321-329.
- Cochran JK, Krishnaswami S (1980) Radium, thorium, uranium, and Pb in deep-sea sediments and sediment pore waters from the North Equatorial Pacific. Am J Sci 280: 849-889.
- Li W Q, GuinassoJr NL, Cole KH, Richardson MD, Johnson JW, et al. (1985) Radionuclides as indicators of sedimentary processes in abyssal Caribbean sediments. Mar Geol 68: 187-204.
- Cole KH, GuinassoJr NL, Richardson MD, Johnson JW, Schink DR (1986) Uranium and thorium series isotopes in recent sediments of the Venezuela basin, Caribbean Sea. MarGeol 68:167-185.
- Suman, DO, Bacon MP (1989) Variations in Holocene sedimentation in the North American basin determined from 23†Th measurements. Deep-Sea Res 36:869-878.
- Radiation Solution INC (2009) RS 230 BGO super spec user manual, Ontaria, Canada.
- Powell BA, Hughes LD, Soreefan AM, Falta D, Wall M, et al. (2006) Elevated concentrations of primordial radionuclides in sediments from the Reedy River and surrounding creeks in Simpsonville, South Carolina. J Environ Rad 94: 121-128.
- Attia TE (2009) Geophysics and mineral prospecting. Geophysical studies for exploring promising sites of mineralization in the basement rocks of south Sinai, Egypt. LAP LAMBERT Academic Publishing, Germany.
- Saleh I, El-Gamal A, Nasr S, Naim M (2004) Spatial and temporal variations of uranium and thorium series along the Egyptian Mediterranean coast, International Conference on Isotopes in Environmental Studies- Aquatic Forum 2004, Monte-Carlo, Monaco.
- NCRP (1994) Exposure of the population inthe United States and Canada from Natural Background Radiation. NCRP Report No: 94. Bethesda, Maryland: NCRPM, USA.
- UNSCEAR (2000) Sources, Effects and Risks of Ionizing Radiation, United Nations Scientific Committee on the Effects of Atomic Radiation, United Nations Publication, New York, USA.
- IAEA (2005) Decommissioning of Nuclear Facilities, International Atomic Energy Agency, safety standard series.NewYork, USA.
- Anonymous (2005) Regulation of the Council of Ministers (Poland) on ionizing radiation dose limits.
- ICRP (2009) Annual of International commission on Radiological Protection. Canada.
- Sauerbeck D (1992) Conditions controlling the bioavail- ability of trace elements and heavy metals derived from phosphate fertilizers in soils. Proceeding of IMPHOS Conference on Phosphorus, Life and Environment, Casa-blanca.
- Modaihsh AS, Al-Swailem MS, Mahjoub MO (2004) Metals content of commercial inorganic fertilizers used in the Kingdom of Saudi Arabia. J SciRes Agri MarSci 9: 21-25.
- APHA (1998) Standard methods for the examination of water and waste water, American Public Health Association (20th edn.). Washington DC, USA.
- Lasat MM (2002) Phytoextraction of toxic metals: A review of biological mechanisms. J Environ Qual 31: 109-120.
- USEPA (1997) The incidence and severity of sediment contamination in surface water of the United States. Volume 1-National Sediment Survey; U.S. Environmental protection Agency. Washington, DC, USA.
- Alloway BJ, Steinnes E (1999) Anthropogenic addition of cadmium to soils. Dordrecht: Kluwer Academic Publishers, The Netherlands.
- McMurtry GM, Wiltshire JC, Kauahikaua JP (1995) Heavy metal anomalies in coastal sediments of Oahu, Hawaii. Pacific Sci 49: 452-470.
- Kpomblekuo K, Tabatabi MA (1994) Metal contents of phosphate rocks. Comm Soil Sci Plant Anal 25: 2871-2882.
- De Carlo EH, Spencer KJ (1995) Records of lead and other heavy metal inputs to sediments of the AlaWai Canal, Oahu, Hawaii. Pacific Sci 49: 471-491.
- IAEA (2003) Guidelines for Radioelement Mapping Using Gamma Ray Spectrometry Data. International Atomic Energy Agency, Vienna, Austria.
- NRPB (2003) Radiological Impact on the UK Population of Industries which Use or Produce Materials Containing Enhanced Levels of Naturally Occurring Radionuclides. National Radiological Protection Board, UK.
Citation: Attia TE, Shendi EH, Shehata MA (2014) Assessment of Natural and Artificial Radioactivity Levels and Radiation Hazards and their Relation to Heavy Metals in the Industrial Area of Port Said City, Egypt. J Earth Sci Clim Change 5: 188. DOI: 10.4172/2157-7617.1000188
Copyright: ©2014 Attia TE, et al. This is an open-access article distributed under the terms of the Creative Commons Attribution License, which permits unrestricted use, distribution, and reproduction in any medium, provided the original author and source are credited.
Select your language of interest to view the total content in your interested language
Share This Article
Recommended Journals
Open Access Journals
Article Tools
Article Usage
- Total views: 16179
- [From(publication date): 4-2014 - Aug 29, 2025]
- Breakdown by view type
- HTML page views: 11432
- PDF downloads: 4747